1 Introduction
The classical theory of portfolio choice rests on the assumptions of no transaction costs and investors with full information about the risks and returns related to available assets. If all investors face the same returns distribution and have the same information set, differences in attitudes to risk affect the allocation of wealth between safe and risky assets, but not the particular asset selected. Also, if the utility function exhibits constant relative risk aversion, asset shares are independent of wealth. Under these assumptions, the rich man's portfolio is simply a scaled-up version of that of the poor man. However, recent empirical studies show that household portfolios exhibit too much heterogeneity to be consistent with the classical model. Empirical evidence documents a strong positive correlation between stock-market participation and financial wealth in many industrialized countries, providing support for models featuring entry costs (Vissing-Jørgensen, Reference Vissing-Jørgensen2002; Guiso et al. Reference Guiso, Haliassos and Jappelli2003) to explain the so-called stockholding puzzle (Haliassos and Bertaut, Reference Haliassos and Bertaut1995). Furthermore, the shape of the financial portfolio appears to be affected by many other characteristics, including financial sophistication, social interactions, familiarity, and trust; see Guiso et al. (Reference Guiso, Haliassos and Jappelli2003), Guiso and Sodini (Reference Guiso, Sodini, Constantinides, Harris and Stulz2013), and references cited therein.
In this paper, we relate the heterogeneity of household portfolios to their degree of financial knowledge. Acquiring human capital in the form of financial knowledge helps investors to identify assets with high returns, and to save on transaction and entry costs. We posit that, like other forms of human capital, financial information can be accumulated, and that the decision to invest in financial literacy has costs and benefits. A few papers analyze the joint determination of financial information, and saving and portfolio decisions, using theoretical models; see Delavande et al. (Reference Delavande, Rohwedder and Willis2008), Jappelli and Padula (Reference Jappelli and Padula2013), and Lusardi et al. (Reference Lusardi, Michaud and Mitchell2013). The survey by Lusardi and Mitchell (Reference Lusardi and Mitchell2014) shows that the human capital approach to financial literacy has important implications for welfare analysis as well as for policies intended to enhance levels of financial knowledge in the larger population.
Following this approach, we assume that people are endowed with an initial stock of financial literacy which they acquire before entering the labor market, and that investing in financial literacy gives access to better investment opportunities, raising the returns to risky assets, or lowering entry costs. Acquiring financial information, however, entails costs in terms of time, effort, and resources. Therefore, the model delivers an optimal investment in financial literacy, and conditions for optimal saving and asset allocation. In particular, the model implies that financial literacy and stockholding are positively correlated. However, the relation between the two variables is not causal, because both variables depend on preference parameters, household resources, and the cost of acquiring information. The model shows also that introducing a social security system (or making an existing system more generous) reduces the incentive to save, to invest in financial literacy, and to invest in risky assets. Therefore, the social security system impacts on stockholding in two ways: directly by reducing discretionary wealth, and indirectly by reducing the incentive to invest in financial literacy, thereby making stockholding less desirable.
In Section 2, we review the relevant literature, with a particular focus on studies of the relation between financial sophistication and stockholding, and work addressing the endogeneity of financial literacy with respect to stockholding. Section 3 presents our theoretical model, analyzing two distinct channels through which financial literacy affects asset allocation, i.e., by raising assets returns (Model I), and by lowering transaction costs (Model II). To convey the main insights within the simplest framework, we focus on a two-period model with an iso-elastic utility function. The model also features a social security system, showing that the replacement rate (as an indicator of the generosity of the system) affects saving, portfolio choice, and investment in financial literacy. The two models deliver several testable implications: (1) in both models, the initial stock of financial literacy affects the trajectory of literacy in later life; (2) Model I predicts that the stockholding decision does not depend on financial literacy, while the share invested in risky assets increases with literacy; (3) Model II predicts a positive relation between literacy and participation, but no relation between literacy and the share of risky assets; (4) both models predict that the presence of social security affects portfolio choice, reducing stock-market participation, and investment in risky assets; (5) the effect of social security on the demand for risky assets depends on the initial stock of financial literacy.
In Section 4, we present our microeconomic data derived by merging the Survey of Health, Ageing, Retirement in Europe (SHARE) which covers a representative sample of individuals aged 50+ in Europe, and SHARELIFE, a retrospective survey of the same individuals. We define indicators of financial literacy based on a series of questions available in SHARE (for current literacy) and SHARELIFE (for literacy early in life). The SHARE indicator is framed in the context of simple financial questions, and elicits the ability to understand and perform standard financial operations. Mathematical competence does not necessarily span all domains of financial literacy, for instance, awareness of the specific financial products, rates of return, or tax incentives. However, a minimal level of mathematical competence is needed to evaluate the return and risk characteristics of financial products, as suggested by the limited impact of financial education programs that do not explicitly address a minimal level of mathematical literacy; see Carpena et al. (Reference Carpena, Cole, Shapiro and Zia2011). Therefore in the empirical section, we use indicators of mathematical competence early in life available in SHARELIFE, to proxy for financial literacy. Our regression results for the determinants of stockholding and of the share of risky assets are presented in Section 5. We find that the initial stock of financial literacy is strongly associated with stockholding, but not with the share of risky assets, lending support to models in which literacy lowers transaction costs (Model II). Section 6 summarizes our results.
2 Financial sophistication and portfolio performance
Many recent empirical studies using panel data on household portfolios find that a low level of financial sophistication is associated with poor risk diversification, inefficient portfolio allocations, and low wealth accumulation. Calvet et al. (Reference Calvet Laurent, Campbell John and Sodini2007, Reference Calvet Laurent, Campbell John and Sodini2009), using Swedish data, find substantial heterogeneity in account performance, and that part of the variability of returns across investors is explained by financial sophistication. In particular, they show that predictors of financial sophistication (such as wealth, income, occupation and education) are associated with higher Sharpe ratios, and that richer and more sophisticated households invest more efficiently. Hackethal et al. (Reference Hackethal, Haliassos and Jappelli2012) use data on German brokerage accounts and find that years of experience tend to contribute to higher returns. Feng and Seasholes (Reference Feng and Seasholes2005) find that investor sophistication and trading experience eliminate reluctance to realize losses.Footnote 1 Campbell et al. (Reference Campbell John, Ramadorai and Ranishy2012) study investment strategies and the performance of individual investors in Indian equities over the period 2002 to 2012.Footnote 2 They study learning by relating account age (length of time since the account was opened) and past portfolio mistakes, to account performance, which they find improves significantly with account age.
A parallel strand in the literature studies other features of households’ trading behavior. Bilias et al. (Reference Bilias, Georgarakos and Haliassos2010) relate portfolio inertia to education and limited resources. More recently, Hoffmann et al. (Reference Hoffmann, Post and Pennings2013) and Bucher-Koenen and Ziegelmeyer (Reference Bucher-Koenen and Ziegelmeyer2014) analyzed trading behavior around the recent financial crisis and investigated the role of individuals’ risk perceptions and financial literacy.
Other studies relate household portfolio decisions to direct indicators of financial literacy as a measure of sophistication. van Rooij et al. (Reference van Rooij, Lusardi and Alessie2011) rely on a special module in the Dutch DNB Household Survey. The module includes questions on the ability to perform simple calculations and to understand compound interest, inflation, and money illusion, and more advanced questions on stock-market functioning, characteristics of stocks, mutual funds, and bonds, equity premiums, and the benefits of diversification. The authors find that financial sophistication is associated with the probability of investing in the stock market, and a higher propensity to plan for retirement.
Guiso and Jappelli (Reference Guiso and Jappelli2008) use data from the 2007 Unicredit Customer Survey (UCS) and find that financial literacy is strongly correlated to the degree of portfolio diversification, even when controlling for socioeconomic characteristics and risk aversion. Banks and Oldfield (Reference Banks and Oldfield2007) look at numerical ability and other dimensions of cognitive function, in a sample of older adults in the English Longitudinal Study of Ageing (ELSA); they find that numeracy levels are strongly correlated with indicators of retirement savings and investment portfolios, understanding of pension arrangements, and perceived financial security. Stango and Zinman (Reference Stango and Zinman2009) analyze the pervasive tendency to linearize exponential functions. Using the 1977 and 1983 Surveys of Consumer Finances, they show that exponential growth bias can explain the tendency to underestimate an interest rate given other loan terms, and the tendency to underestimate a future value given other investment terms. Christelis et al. (Reference Christelis, Jappelli and Padula2010) study the relation between cognitive abilities and stockholding using SHARE data, and find that the propensity to invest in stocks, directly and indirectly (through mutual funds and retirement accounts), is strongly associated with mathematical ability, verbal fluency, and recall skills. von Gaudecker (Reference von Gaudecker2011) investigates the composition of the financial portfolios of Dutch households, and relate the poor levels of diversification to lack of financial knowledge and financial advice. The comprehensive survey by Lusardi and Mitchell (Reference Lusardi and Mitchell2014) concludes that available studies show that ‘general knowledge (education) and more specialized knowledge (financial literacy) both contribute to more informed financial decisions making. In other words, investment in financial knowledge appears to be a specific form of human capital, rather than being simply associated with more years of schooling’ (p. 23–24).
One econometric problem that arises in testing the human capital approach to financial literacy is that the incentive to invest in financial information depends on household resources, because the benefit of stockholding (and therefore the cost of not investing in the stock market) depends on the amount invested; see Lusardi et al. (Reference Lusardi, Michaud and Mitchell2013). Furthermore, since the true stock of financial literacy is not observed by applied researchers, empirical studies are affected by measurement error problems. The endogeneity and measurement issues are similar to those arising in studies that estimate the returns to schooling: any attempt to estimate the structural relation between schooling and wages must deal with the endogeneity of the schooling decision and measurement errors in the quantity and quality of education (Card Reference Card2001). Some studies address these important econometric concerns using an instrumental variables approach; see Christiansen et al. (Reference Christiansen, Joensen and Rangvid2008), Lusardi and Mitchell (Reference Lusardi and Mitchell2008), Behrman et al. (Reference Behrman Jere, Mitchell Olivia, Soo and Bravo2012), and van Rooij et al. (Reference van Rooij, Lusardi and Alessie2012).
In the next section, we build on the insights from these papers and provide a theoretical framework to study the relation between financial literacy and portfolio choice. In successive sections we explore its empirical implications.
3 Theoretical background
We propose a model in which financial literacy, saving, and asset allocation are jointly determined. The model builds on the idea that investors can increase the pay-off from their financial portfolios by acquiring information on the rate of return, an idea first proposed by Arrow (Reference Arrow1987).Footnote 3
As in the human capital models of financial literacy proposed by Delavande et al. (Reference Delavande, Rohwedder and Willis2008), Jappelli and Padula (Reference Jappelli and Padula2013), and Lusardi et al. (Reference Lusardi, Michaud and Mitchell2013), we posit a direct link between financial literacy and portfolio returns. This allows us to investigate the life-cycle aspects of investment in financial literacy, and the effect of social security arrangements on the decision to acquire financial information.Footnote 4
Following this approach, we assume that people are endowed with an initial stock of financial literacy, which is acquired before they enter the labor market, and that investing in financial literacy gives access to better investment opportunities, raising the expected return to saving (Model I) or reducing the cost of participating in financial markets (Model II). The two models extend the model in Jappelli and Padula (Reference Jappelli and Padula2013), which has a single asset and no uncertainty about asset returns.
In each period, people can invest their wealth in a safe asset, in a risky asset and in financial literacy. Investment in literacy can directly raise the risk-free rate available to investors, or the mean of the return from the risky asset (e.g., through lower fees), reduce the variance of the return from the risky asset through increased diversification, or affect the market entry cost for the risky asset.Footnote 5
The stock of financial literacy depreciates over time, but people can acquire financial knowledge, which entails costs in terms of time, effort, or resources. Investing in financial knowledge might also help in hiring financial advisors who can search for better investment opportunities and reduce the cost of financial investments.Footnote 6 Accordingly, agents choose how much to invest in financial literacy, how much to save, and how much to invest in the risky asset, given their initial level of literacy, the cost of literacy, the depreciation of the stock of literacy, and their preferences. As noted by Jappelli and Padula (Reference Jappelli and Padula2013) and Lusardi et al. (Reference Lusardi, Michaud and Mitchell2013), the incentive to invest in literacy depends not only on the return to literacy (because increased literacy provides access to better investment opportunities) but also on the amount of wealth available for financial investment (because the incentive is an increasing function of wealth). This implies also that, given their limited resources, some people may not find it worthwhile to invest in financial literacy, as Lusardi and Mitchell (Reference Lusardi and Mitchell2014) argue.
In both Models I and II, consumers live for two periods, and earn income y in period 0 and retire in period 1. At the beginning of period 0 they have no assets but are endowed with a stock of financial literacy, Φ0. The initial stock of literacy is what people know about finance before entering the labor market. This depends on schooling decisions and parental background, neither of which we model explicitly.
Consumers can increase their stock of financial literacy by investing in financial literacy in period 0. Literacy depreciates at the rate δ; the relative cost of literacy in terms of the consumption good is p, which includes monetary and time costs incurred by consumers. The stock of literacy therefore evolves according to:
 $${\Phi _1} = (1 - \delta ){\Phi _0} + \varphi, $$
where φ denotes the investment in financial literacy.
We assume that the utility function is iso-elastic, so that consumers choose saving (s), financial literacy (Φ1) and the risky asset share (ω) to maximize:Footnote 7
 $$\mathop {\left( {1 - \displaystyle{1 \over \sigma}}\right)}\nolimits^{ - 1} \left( {c_0^{1 - {\textstyle{1 \over \sigma}}}+ \beta {E_0}c_1^{1 - {\textstyle{1 \over \sigma}}}} \right)$$
subject to the budget constraint, where 0 < β < 1 is the discount factor and E 0(·) is the expected value of consumption in period 1.Footnote 8
Our theoretical analysis of Models I and II proceeds in two steps. In the first step, we derive optimal saving, investment in the risky asset, and financial literacy. In the second step, we study how the generosity of the social security system – summarized by the replacement rate – affects these decisions. We find that in the presence of a social security system with mandatory contributions, people have fewer resources to invest in financial markets (the familiar Feldstein displacement effect), acquire less financial knowledge, and have fewer incentives to invest in stocks. The purpose of the two models is to derive testable implications in the simplest framework.Footnote 9
3.1 Model I: Financial literacy and asset returns
In Model I, the portfolio return is paid at the beginning of period 1 on wealth transferred from period 0 to 1. Denoting by ω the share of wealth invested in the risky asset, the gross portfolio return is:
 $$R({\Phi _1},\alpha, \zeta, \omega ) = \left\{ {\matrix{ {{\theta _1}({\Phi _1},\alpha, \zeta, \omega )} & {{\rm with}\;{\rm probability}} & {\eta ({\Phi _1}),} \cr {{\theta _2}({\Phi _1},\alpha, \zeta, \omega )} & {{\rm with}\;{\rm probability}} & {1 - \eta ({\Phi _1}),} }} \right.$$
where θ 1(Φ 1 ,α,ζ,ω) = Φ 1 α (1+ωζ) and θ 2(Φ 1 ,α,ζ,ω) = Φ 1 α (1−ωζ), ζ > 0 and η′(·) > 0 and η″(·) < 0. The higher the parameter α, the stronger the effect of raising literacy on the portfolio return. If ω = 0, wealth is entirely invested in the riskless asset and the gross return is Φ 1 α . If ω = 1, wealth is entirely invested in the risky asset and the gross return is Φ 1 α (1+ζ) with probability η(Φ1) and Φ 1 α (1−ζ) with probability 1 − η(Φ1). Therefore, the mean return of the risky asset is {ζ[2η(Φ 1)−1] + 1}Φ 1 α and the first two moments of the equity premium distribution are [2η(Φ 1) − 1]Φ 1 αζ and Φ 1 2 αζ, respectively. The Sharpe ratio is an increasing function of financial literacy since η′(·) > 0, an assumption that is motivated by the empirical literature on portfolio performance and financial sophistication surveyed in Section 2.Footnote 10
Appendix A.1 solves the model and shows that the share of wealth invested in the risky asset is:
 $$\omega = \displaystyle{{\eta {{({\Phi _1})}^\sigma}- \mathop {\left[ {1 - \eta ({\Phi _1})} \right]}\nolimits^\sigma}\over {\zeta \left\{ {\eta {{({\Phi _1})}^\sigma}+ \mathop {\left[ {1 - \eta ({\Phi _1})} \right]}\nolimits^\sigma}\right\}}}.$$
Equation (2) has an important implication for empirical work. In a cross-section of households reporting information on financial literacy (Φ1) and the risky asset share (ω), equation (2) implies a positive association between the two variables. But clearly it cannot be concluded from this correlation that a higher stock of literacy leads to a higher risky asset share, because both variables are endogenous. In our model, equation (2) is therefore an equilibrium condition between the optimal risky asset share and the optimal stock of literacy, not a reduced form equation. Thus, it implies that any factor that leads to higher financial literacy will also raise investment in the risky asset.
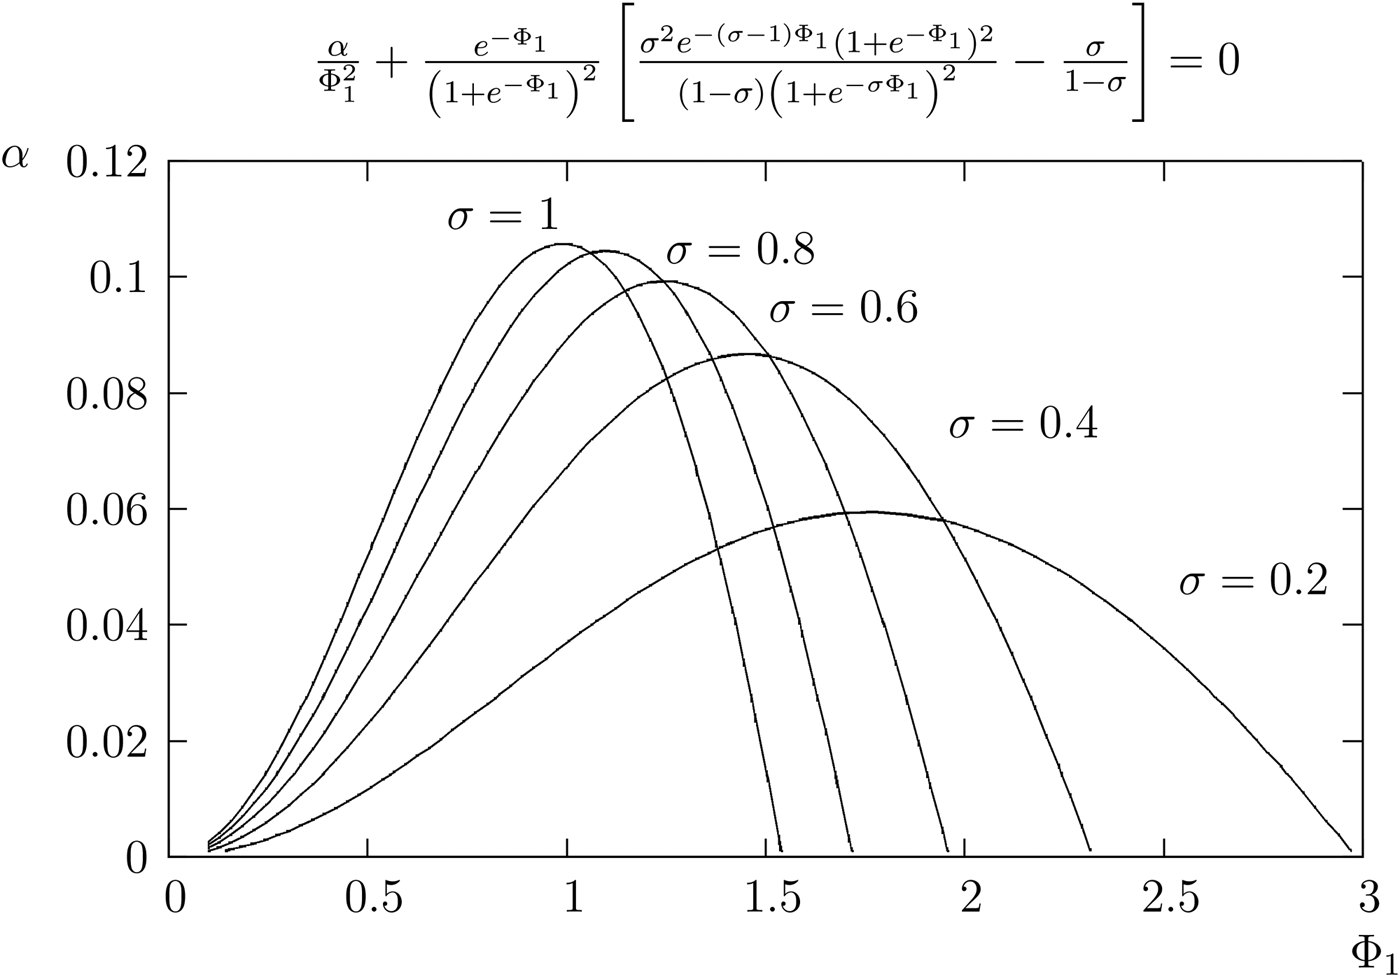
As we show in Appendix A.1, the marginal return of financial literacy depends on the effect of literacy on the expected portfolio return as well as on the distribution of the asset return. Furthermore, Appendix B derives the fairly general conditions under which the marginal return of financial literacy is a decreasing function of Φ1, leading to the following proposition.
Proposition 1
If the marginal return of financial literacy is a decreasing function of Φ 1 , the optimal level of financial literacy is an increasing function of α, β, Φ0, and y and a decreasing function of p and δ, i.e.:
 $$\displaystyle{{\partial \Phi _1^ *}\over {\partial \alpha}} \gt 0,\quad \displaystyle{{\partial \Phi _1^ *}\over {\partial \beta}} \gt 0,\quad \displaystyle{{\partial \Phi _1^ *}\over {\partial {\Phi _0}}} \gt 0,\quad \displaystyle{{\partial \Phi _1^ *}\over {\partial y}} \gt 0,\quad \displaystyle{{\partial \Phi _1^ *}\over {\partial p}} \lt 0,\quad \displaystyle{{\partial \Phi _1^ *}\over {\partial \delta}}\lt 0.$$
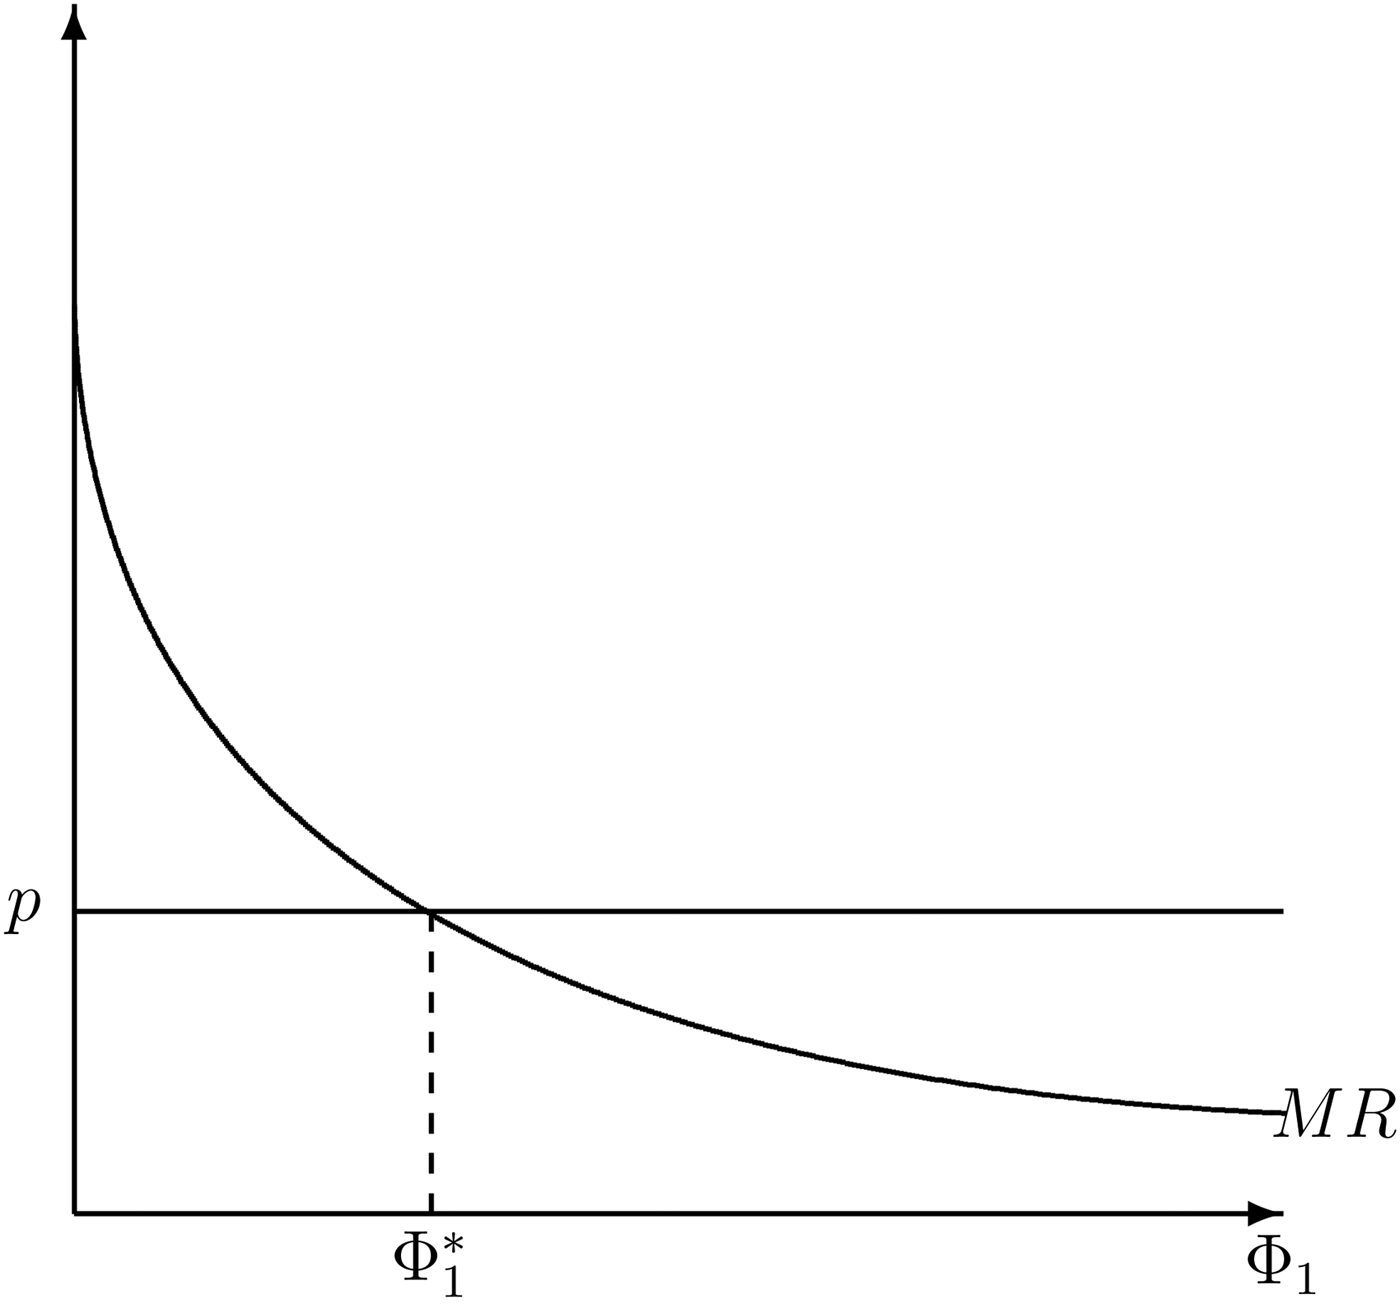
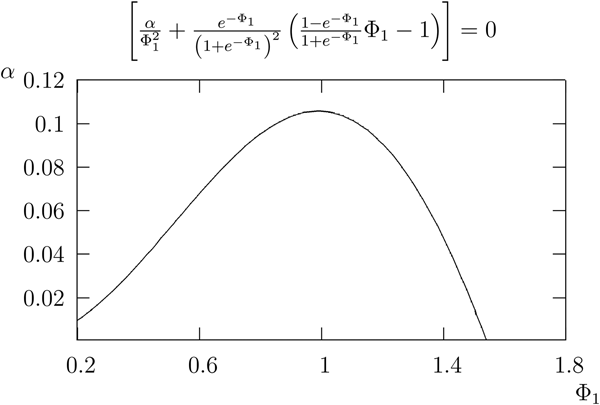
Figure 1 plots the marginal cost (straight line) and the marginal return (curved line) of investing in financial literacy as a function of Φ1. The curved line shifts up if α increases, that is, the optimal level of literacy increases with α. The curve shifts upwards also if β, Φ0, y increase, and downwards if p or δ increase.
Marginal return and cost of investing in financial literacy.

From equation (2), the risky asset share ω is positively associated with Φ1 *; therefore the optimal share of risky assets is an increasing function of Φ0. In addition, since Φ1 * is an increasing function of αβ, Φ0, and y and a decreasing function of p and δ, one can show the following proposition.
Proposition 2
If the marginal return of financial literacy is a decreasing function of Φ 1 , then the optimal share of risky assets is an increasing function of α, β, Φ0, and y and a decreasing function of p and δ, i.e.:
 $$\displaystyle{{\partial {\omega ^ *}}\over {\partial \alpha}}\gt 0,\quad \displaystyle{{\partial {\omega ^ *}}\over {\partial \beta}}\gt 0,\quad \displaystyle{{\partial {\omega ^ *}}\over {\partial {\Phi _0}}} \gt 0,\quad \displaystyle{{\partial {\omega ^ *}}\over {\partial y}} \gt 0,\quad \displaystyle{{\partial {\omega ^ *}}\over {\partial p}} \lt 0,\quad \displaystyle{{\partial {\omega ^ *}}\over {\partial \delta}}\lt 0.$$
In addition,
 ${\rm lim}_{\sigma \to \infty} {\omega ^{\ast}} = {\textstyle{1 \over \zeta}} \gt {\rm lim}_{\sigma \to 0}\,{\omega ^{\ast}} = 0.$
Proposition 2 has three implications. First, any factor leading to a high share of wealth invested in risky assets also increases financial literacy. For instance, patient individuals (high β) feature a relatively high share of risky assets as well as relatively high levels of financial literacy.Footnote 11 For the same reason, any variable that affects literacy also affects the risky asset share. For instance, as we shall see below, the generosity of the social security system affects the risky asset share as well as financial literacy. Second, the initial stock of literacy, Φ0, affects the risky asset share only through its effect on the current stock of literacy Φ1 *. The third implication is that while in standard models with constant relative risk aversion (CRRA) the risky asset share does not depend on wealth, in this setup the share depends – through its effect on literacy – on households’ resources. Therefore, the model delivers a positive correlation between the risky asset share and wealth, even with a CRRA utility function, contrary to the standard portfolio model.
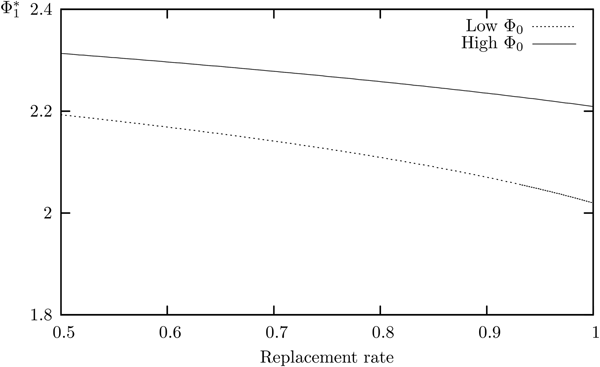
To study the effect of social security on financial literacy investment and portfolio choice, we modify the baseline model and assume that in period 0 consumers earn income y, and in period 1 they collect pension benefits denoted by b. Appendix A.1 solves the model and shows that Φ1 * is a decreasing function of b and that a higher Φ0 dampens the effect of b on Φ1 *. To provide the intuition for these results, we plot in Figure 2 the relation between the optimal stock of financial literacy and the replacement rate (b/y). The relation between these two variables is negative because a more generous social security system reduces private wealth and the incentive to invest in financial literacy as well as the risky asset share. Figure 2 also shows that the effect of the replacement rate on optimal literacy depends on the initial value of literacy Φ0: the higher Φ0 the lower the effect of the replacement rate on Φ1 *, an implication of the model that we will empirically evaluate.
Optimal stock of financial literacy and replacement rate

3.2 Model II: Financial literacy and transaction costs
We now assume that acquiring financial literacy reduces the transaction cost of entering the stock market, rather than assuming that it raises the asset return (as in Model I). In particular, we assume that:
 $$R = \left\{ {\matrix{ {1 + \omega \zeta}& {{\rm with}\;{\rm probability}} & {\eta,}\cr {1 - \omega \zeta}& {{\rm with}\;{\rm probability}} & {1 - \eta,}}} \right.$$
where η > 1/2. Moreover, we assume that if ω > 0, the consumer incurs a transaction cost equal to (Φ 1 −γ/γ), with γ > 0.
Under these assumptions the intertemporal budget constraint is
 $${c_0} + \displaystyle{{{c_1}} \over R} - p{\Phi _1} + p(1 - \delta ){\Phi _0} - \displaystyle{{\Phi _1^{ - \gamma}} \over \gamma} 1\left\{ {\omega \gt 0} \right\} = y,$$
where 1{·} is an indicator function and the other variables are defined as in Model I. Appendix A.1 shows that in Model II the share of wealth invested in risky assets does not depend on financial literacy, contrary to what happens in Model I. Furthermore, one can show that the utility gain from stockholding is a monotonically increasing function of Φ0 since the utility of investing in the risky asset is an increasing function of Φ0, while the utility of not investing in risky assets is not affected. The result is summarized in the following proposition:
Proposition 3
The utility gain from investing in the risky asset, VI −VNI, is an increasing function of Φ 0 , where VI and VNI are, respectively, the indirect utility of investing and not investing in the risky asset.
Proposition 3 implies that (in a random utility setting) the probability of stock-market participation increases with Φ0, an important difference with respect to Model I. From Proposition 3 one can also show that the optimal level of financial literacy is an increasing function of Φ0 (see Appendix A.1 for details). Moreover, the following proposition holds.
Proposition 4
There exists a value for Φ
0
,
 ${\bar \Phi _0}$
, such that VI = VNI, and if
 ${\Phi _0} \ge {\bar \Phi _0}$
, then ω > 0 and φ* = Φ
1
*
−(1−δ)Φ
0
> 0.
Proposition 4 implies that if Φ0 is small enough it may not be optimal to invest in the risky assets. Despite this fact, as noted by Lusardi and Mitchell (Reference Lusardi and Mitchell2014), it might still be socially optimal to raise financial knowledge early in life, for instance teaching financial education in schools, because raising Φ0 allows consumers to attain higher returns on their portfolios. From an empirical point of view, a further implication of Proposition 4 is that in a cross-section of households Φ1 and Φ0 are positively correlated (Model I has the same implication).Footnote 12
As in Model I, we introduce a social security system assuming that consumers pay a contribution in period 0 and receive a pension b in period 1. The budget constraint is:
 $${c_0} + \displaystyle{{{c_1}} \over R} - p{\Phi _1} + p(1 - \delta ){\Phi _0} - \displaystyle{{\Phi _1^{ - \gamma}} \over \gamma} 1\left\{ {\omega \gt 0} \right\} = y + \displaystyle{b \over R}.$$
Appendix A.1 shows that the first-order conditions of the model are unchanged, and that Propositions 3 and 4 still hold. In addition, one can show that,
 ${\bar \Phi _0}$
, the level of financial literacy that triggers participation to the stock market, is an increasing function of b. Moreover, stock-market participation and investment in financial literacy are negatively correlated with the generosity of the social security system as measured by the replacement rate.
3.3 Empirical implications
In our model, consumers choose how much to invest in financial literacy, how much to save, and how much to invest in risky assets. Therefore, the endogenous variables are financial literacy, wealth, and the share of risky assets, and each depends on the model's parameters and the initial endowments of resources and literacy. In a related paper, we highlight two important determinants of financial literacy and wealth accumulation (Jappelli and Padula, Reference Jappelli and Padula2013). First, improving mathematical skills early in life eventually will raise households’ financial literacy and wealth accumulation. Second, a generous social security system reduces the incentive to invest in financial literacy, leading also to lower financial literacy and wealth later in life.
The present paper focuses on wealth composition, and attempts also to distinguish between two channels through which financial literacy can affect portfolio choice. Model I focuses on the effect of literacy on the distribution of asset returns, and posits that higher (and safer) returns are associated with higher financial literacy. Model II assumes that higher financial literacy reduces the cost of stock-market participation. Both models predict a positive effect of literacy earlier in life (Φ0), on the trajectory of financial literacy (Φ1) but differ along important dimensions. Model I implies that in a heterogeneous population, where people are identical except for their initial stock of literacy: (a) everyone participates in the stock market, and (b) the share of risky assets is positively related to financial literacy. Model II implies that (a) participation depends on literacy but (b) the asset share, conditional on participation, does not. Therefore, to compare the validity of the two models we need to study the correlation between shares of risky assets, stockholding, and financial literacy. A positive correlation between literacy and asset shares, and no correlation between literacy and participation, would support Model I. Alternatively, a positive correlation between literacy and stockholding and no correlation between literacy and the share of risky assets would support Model II.
In our empirical study, we verify some other important implications of the two models. In particular, we focus on the role of social security for the incentives to accumulate financial literacy, exploiting cross-country variation in replacement rates. We include in our regressions the replacement rate and its interaction with Φ0, and test three empirical predictions: (a) financial literacy is a decreasing function of the replacement rate; (b) stock-market participation is negatively related to the replacement rate; and (c) a higher Φ0 attenuates the effect of the replacement rate on Φ1, stockholding, and the share of risky assets.
To make our tests operational, we estimate the linear projections of financial literacy, the share of risky assets, and stock-market participation, on the initial level of literacy and the social security replacement rate; the projections can be seen as linear approximations of the reduced form equations of the model. To account for the role of other potential effects on stockholding and the share of risky assets, we control for other exogenous variables, which are held constant in the theoretical model. Denoting households by i, countries by c, and survey year by t, we estimate the following regression:
 $${y_{i,c,t}} = {d_c} + {\xi _1}{\Phi _{i,0}} + {\xi _2}{\Phi _{i,0}} \times {\rho _{ic}} + {\xi _3}{\rho _{ic}} + {\xi _4}{x_{it}} + {\varepsilon _{it}};$$
where d c is a country effect, ρ ic the replacement rate, x i,t a vector of additional variables affecting portfolio choice, ε i,t an error term, and y i,c,t either the current stock of financial literacy (Φ i,t ), stock-market participation or the share of wealth invested in risky assets (ω i,t ).
Suppose first that y i,c,t is financial literacy. Both Models I and II imply a positive correlation between Φ i,t and Φ i,0, i.e., ξ 1 > 0; see Propositions 1 and 3. Furthermore, in both models a higher replacement rate reduces Φ i,t as well as the effect of Φ i,0 on Φ i,t , implying ξ 2 < 0 and ξ 3 < 0. If y i,c,t is the decision to invest in stock, Model I predicts that everyone should invest in stocks, so that ξ 1 = ξ 2 = ξ 3 = 0, while in Model II ξ 1 > 0, ξ 2 < 0, and ξ 3 < 0. If y i,c,t denotes the share of risky assets, then Model I predicts ξ 1 > 0, ξ 2 < 0 and ξ 3 < 0, since the share of risky assets is an increasing function of financial literacy and a decreasing function of the replacement rate. Instead, in Model II ξ 1 = ξ 2 = ξ 3 = 0, because conditional on stock-market participation, the share of risky assets does not depend on financial literacy.
The list of the x-variables is potentially large, but three variables are prominent in our specification. A first important variable is age which, in principle, may affect both portfolio decisions and financial literacy accumulation. The relation between age and financial literacy is likely to be negative in the 50+ sample since cognitive abilities tend to decline with age. However, our data do not allow us to distinguish between age and cohort effects, and therefore identification of a pure age effect is impossible in our empirical estimates. Previous studies report that the relation between age and the decision to invest in risky assets tends to be negative for the elderly, while there is a weaker relation for the share invested in risky assets. However, once more, cohort effects might cloud the identification of age effects. A second important element is that financial literacy and wealth are likely to be correlated with education, and therefore it is important to control explicitly for this variable. Third, households’ resources (real estate, financial wealth, and income) are likely to affect the incentives to acquire financial literacy, stock-market participation, and the share of risky assets. As we explain in the next section, we estimate the model using cross-country microeconomic data with information on wealth composition, current financial literacy, and financial literacy early in the life-cycle.
4 Data
We test the theoretical predictions of Models I and II using data from SHARE, a representative sample of those aged 50+ in 11 European countries. This dataset has several advantages: (a) it provides proxies for financial literacy Φ t , based on responses to specific questions; (b) it includes data on mathematical and language skills before entry to the labor market (at school age), providing an indicator of Φ0; (c) it has consistent and comparable information on household portfolios (transaction accounts, bonds, stocks, mutual funds, and retirement accounts) allowing us to measure direct stockholding, indirect stockholding through mutual funds, and the corresponding asset shares; (d) its cross-country dimension allows us to study portfolio decisions and their interactions with financial literacy, comparing countries with different pension regimes.
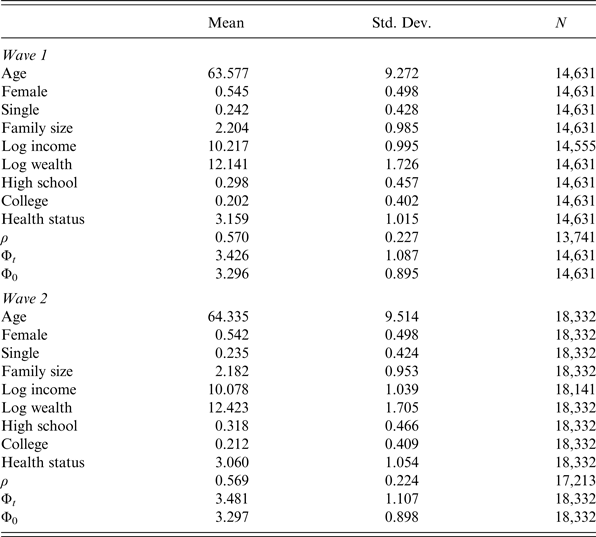
SHARE covers many aspects of well-being in elderly populations, ranging from socio-economic, to physical and mental health conditions.Footnote 13 Wave 1 was collected in 2004 and covers 11 European countries (Austria, Belgium, Denmark, France, Greece, Germany, Italy, the Netherlands, Spain, Sweden, and Switzerland). Wave 2 was collected in 2006/2007 and includes these 11 countries plus the Czech Republic, Poland, and Ireland.Footnote 14 Wave 3 (which excludes Ireland) is known as SHARELIFE, and records individual life-histories for Wave 1 and 2 respondents, based on the so-called life-history calendar method of questioning, which is designed to achieve more accurate recall of past events by respondents. The sample includes 14,631 observations obtained by merging Wave 1 and SHARELIFE, and 18,332 observations by merging Wave 2 and SHARELIFE. Selected sample statistics are reported in Table 1, separately for Waves 1 and 2. With the exception of for income which is gross of taxes in Wave 1 and net of taxes in Wave 2, the variables have the same definitions in both waves. Therefore, we report separate estimates for the two samples.
Summary statistics

Note: The table reports sample statistics for selected variables in SHARE Wave 1 (top panel) and Wave 2 (bottom panel). In Wave 1, income is gross of taxes, in Wave 2 it is net of taxes. Wave 1 was collected in 2004 and Wave 2 in 2006/2007.
In both Waves 1 and 2, the average age of the household head is 64 years, the fraction of females is just above 50%, and singles account for 24% of the sample. The proportion of high-school and college graduates is also stable in the two waves, with high-school graduates accounting for 30% of the sample, and college graduates for another 20%. These figures hide considerable cross-country heterogeneity. Nordic countries feature a much higher share of college graduates than Italy, Spain, and Greece. The fraction of couples ranges from 53% in Austria to 67% in Belgium. Household financial wealth also varies considerably, with Switzerland clearly the leader, followed by Sweden, whereas households in Italy, Spain, and Greece report much lower gross financial assets. The ranking between Scandinavian and Mediterranean countries is reversed for real assets, with median values of around 157,000€ in Belgium, 139,000€ in Italy, and 65,000€ in Sweden.
4.1 Financial literacy
SHARE includes four questions referring to simple financial decisions, which allow us to construct a measure of financial literacy. The first question is aimed at understanding whether respondents know how to compute a percentage. The second and third questions ask respondents to compute the price of a good offered at a 50% discount, and the price of a second-hand car that sells at two-thirds of its cost when new. The fourth question is about understanding interest rate compounding in a saving account, and is commonly considered a good proxy for financial literacy; see Lusardi and Mitchell (Reference Lusardi and Mitchell2008), Lusardi et al. (Reference Lusardi, Mitchell and Curto2010), Hastings et al. (Reference Hastings, Madrian and Skimmyhorn2013), and Lusardi and Mitchell (Reference Lusardi and Mitchell2014).
The first three questions reflect the ability to apply a minimal level of mathematical literacy, and the fourth is a question typically included in almost all financial literacy assessment studies.Footnote 15 Following Dewey and Prince (Reference Dewey, Prince, Börsch-Supan, Brugiavini, Jürges, Mackenbach, Siegrist and Weber2005), we combine the responses to the four questions into a summary indicator of the current stock of literacy Φ it . Details on the wording of the questions and the construction of the indicator are given in Appendix C and discussed further in Christelis et al. (Reference Christelis, Jappelli and Padula2010).
Our approach recognizes that a certain level of mathematical competence is a necessary condition for financial skills; in fact, any financial literacy assessment invariably includes questions that require some amount of mathematical literacy. For instance, a minimum level of mathematical literacy is required to compute a percentage, to understand the meaning of interest compounding and uncertainty, and to evaluate asset returns. Therefore, in our empirical application, we are confident that our SHARE indicator of financial literacy is closely correlated to a broader concept of financial literacy, such as that provided by the OECD which defines financial literacy as: ‘Knowledge and understanding of financial concepts, and the skills, motivation and confidence to apply such knowledge and understanding in order to make effective decisions across a range of financial contexts, to improve the financial well-being of individuals and society, and to enable participation in economic life.’
In the model in Section 3, Φ i0 is the financial literacy endowment before entering the labor market. SHARE retrospective data (SHARELIFE) provide a plausible measure of this endowment. Survey participants report their mathematical ability at age 10 in response to the question: ‘How did you perform in Maths compared to other children in your class? Did you perform much better, better, about the same, worse or much worse than the average?’Footnote 16 Although mathematical skills do not span exactly the same domain as financial literacy, ongoing research shows that there is a close correlation between the two concepts. Indeed, preliminary results from the most recent PISA survey show that financial literacy among the young is strongly correlated with mathematical literacy, and these financially sophisticated respondents are also likely to be relatively skilled in terms of mathematical competence.Footnote 17
The indicator of current financial literacy (Φ it ) ranges from 1 to 5, with a sample mean of 3.43 for Wave 1 and 3.48 for Wave 2 (Table 1). In both waves, the indicator exhibits considerable sample variability, with a coefficient of variation of 0.32. Our measure of initial literacy (Φ i0) also ranges from 1 to 5, with similar means and coefficients of variation. Our measures of Φ it and Φ i0 are imperfect proxies for financial literacy, and can therefore be seen as error-ridden measures of financial literacy. To the extent that both variables are affected by measurement error, the sample correlation between Φ it and Φ i0 (0.28) actually underestimates the true correlation.
4.2 Replacement rate
The old-age pension replacement rate measures how effectively a pension system provides a retirement income to replace earnings. We adopt the OECD definition of gross replacement rates (OECD, 2009), i.e., individual gross pension entitlement divided by gross pre-retirement earnings, taking account of both public and private mandatory pension schemes. Pension benefits are expressed as a share of individual lifetime average earnings (re-valued in line with economy-wide earnings growth). Under the baseline assumptions, workers earn the same percentage of economy-wide average earnings throughout their careers. The OECD reports gross replacement rates for all countries in our sample at average earnings and at 0.5 and 1.5 times average earnings levels. These replacement rates are generally lower for higher levels of income, and are imputed to our sample using the earnings distribution. Although the replacement rate varies across countries and individuals, it exhibits little variability in our data. Considering that we introduce country dummies, there are only three different values of the replacement rate in each country. For this reason, the coefficient of the replacement rate is likely to be imprecisely estimated.
4.3 Stockholding and risky asset share
SHARE provides detailed information on financial and real assets. Financial assets include bank and other transaction accounts, government and corporate bonds, stocks, mutual funds, individual retirement accounts, contractual savings for housing, and life insurance policies. The questions on real assets refer to the value of the house of residence, other real estate, business wealth, and vehicles (see Christelis et al. Reference Christelis, Jappelli and Padula2010).
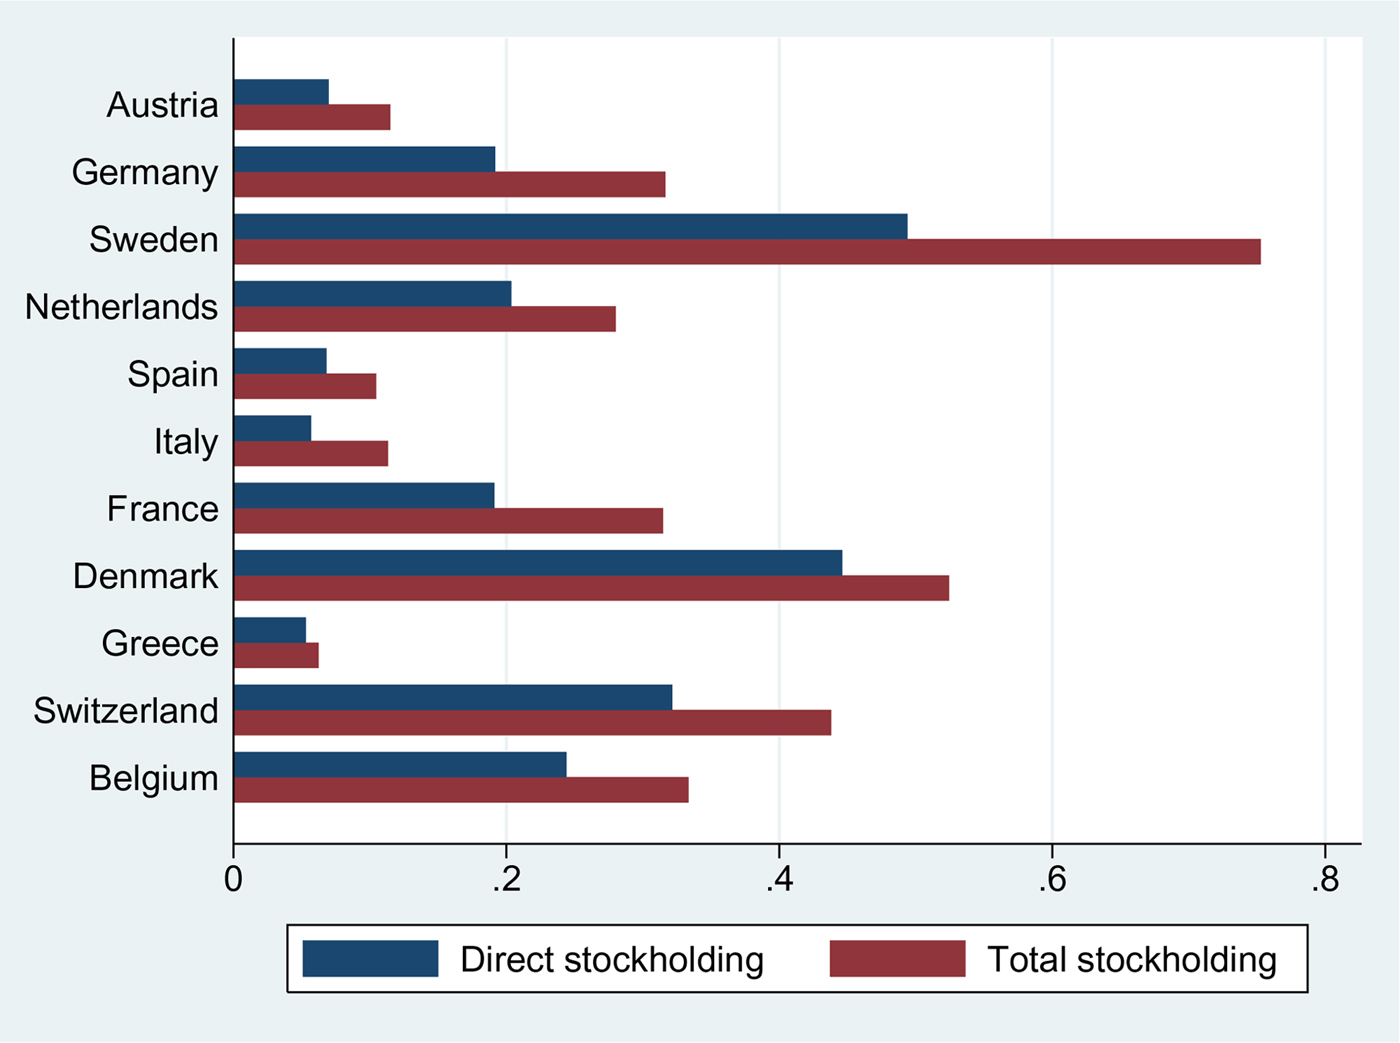
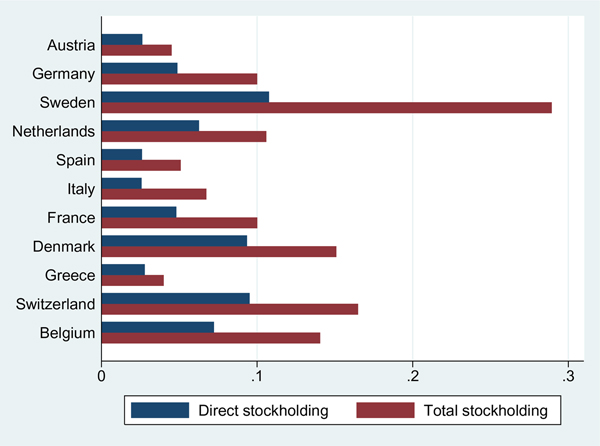
We adopt two definitions of stockholding: direct stockholding and total stockholding, defined as stocks held directly plus stocks held through mutual funds and investment accounts (assuming that whoever holds mutual funds and retirement accounts has some stocks in them).Footnote 18 Figure 3 reports participation in direct and total stockholding in the 11 countries in our sample. The prevalence of direct stockholding ranges from less than 6% in Greece and Italy, to 49% in Sweden. Total stockholding goes from about 10% in Austria, Spain, and Italy to 75% in Sweden.Footnote 19
Stock-ownership, by country

Broadly speaking, stockholding increases, from Southern to Northern Europe, with a group of intermediate countries (France, Germany, Belgium, the Netherlands, and Switzerland). Sweden and Denmark have by far the highest direct and total stockholdings, whereas Austria, Spain, Greece and Italy are at the other end of the spectrum. The graph suggests that country effects are potentially quite important for explaining the stockholding decisions of European investors. Thus, our regression framework introduces country fixed effects in each of the specifications.
In contrast, Figure 4 shows that cross-country differences in conditional asset shares (excluding households with zero stockholding) are much less pronounced. The share of wealth held directly in stocks ranges from 20% in Denmark and Sweden, to 35% in Austria and Italy. Therefore, the relatively small number of stockholders in Italy and Greece invest in stocks more than the average European household. Northern countries feature intermediate values for the share of risky assets, with the notable exception of Sweden, where the share of wealth invested directly and indirectly in risky assets represents almost 40% of financial wealth.
(colour online) Asset shares, by country

5 Empirical results
5.1 Financial literacy
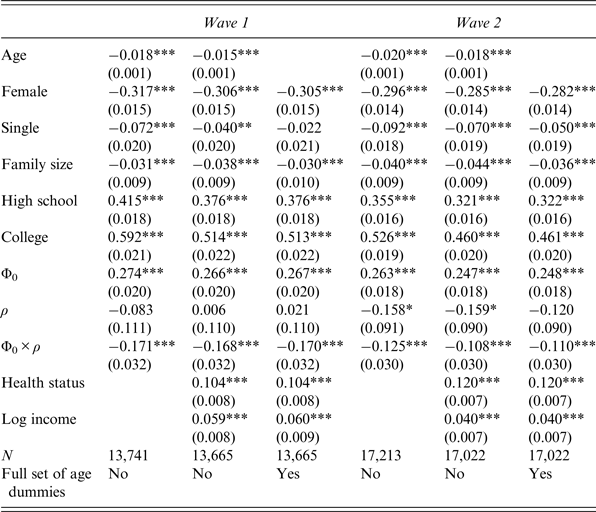
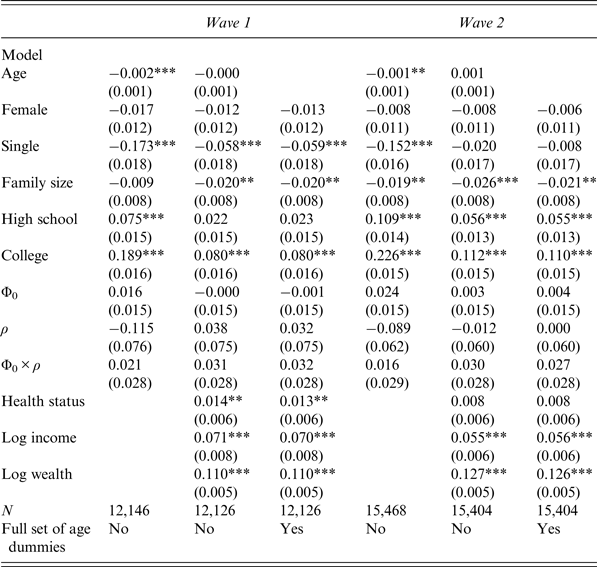
Table 2 presents the OLS regressions for financial literacy, separately for Waves 1 and 2. Each regression also includes a full set of country dummies; for reasons of space, these coefficients are not reported here.Footnote 20 In the baseline specification in column 1 we find that Φ i0 is a strong predictor of Φ it . The coefficient of Φ i0 is large (0.27) and quite precisely estimated (the standard error is 0.02). This finding is consistent not only with our model's prediction but also with other evidence on the long-term impact of early-life conditions (see, for instance, Herd et al. Reference Herd, Holden and Su2012). The age coefficient is negative (−0.018), and shows that in this sample of older individuals, the stock of literacy falls by about 0.5% per year, suggesting that households incentives to invest in financial literacy decline with age, when wealth tends also to fall.
Financial literacy

Note: All regressions include a full set of country dummies. Wave 1 was collected in 2004 and Wave 2 in 2006/2007. *p < 0.1, **p < 0.05, ***p < 0.01 (standard errors in parentheses).
The coefficient of the female dummy is negative. Women have lower levels of financial literacy than men which are in line with the results from other studies (see Lusardi and Mitchell, Reference Lusardi and Mitchell2008). Our model also predicts a negative effect because women generally have less wealth than men, and therefore fewer incentives to invest in financial literacy. Education is strongly correlated with literacy (a coefficient of 0.41 for high-school and 0.59 for college graduates). The positive correlation is also consistent with our model, because higher human capital and lifetime income are associated with a higher stock of financial literacy. The negative signs of the coefficient of the dummy for singles and family size are likely to depend on the fact that these variables are negatively correlated with wealth. The coefficient of the interaction term between the replacement rate and Φ i0 is negative, indicating that more generous social security systems attenuate the effect of Φ i0 on later financial literacy, as predicted by Models I and II.
The coefficient of the replacement rate is negative as expected, although not precisely estimated. The coefficient of the interaction term (Φ i0 × ρ ic ) is negative and statistically different from zero at the 1% level. It implies that a 1% increase in the replacement rate reduces the effect of Φ i0 on Φ it by 0.17%. The effect of Φ i0 on Φ it is larger in countries with relatively low replacement rates such as Germany (a 1 standard deviation increase in Φ0 leads to an increase in Φ it of 0.20) than in countries with higher replacement rates (0.16 in Italy).
Column 2 in Table 2 includes health status and log disposable income to rule out that the effect of Φ i0 on Φ it is due simply to the correlation between Φ i0 and these variables. The coefficients of health status and log income are positive and statistically different from zero, whereas the other coefficients are not affected. In the next regression (column 3), we check the stability of the results replacing the age variable with a full set of age dummies. The pattern of the estimated coefficients of the age dummies (not reported for brevity) indicates that the stock of financial literacy falls during retirement, while the coefficients of the other variables are unaffected. Of course, in cross-sectional data we cannot distinguish between age and cohort effects, and therefore an interpretation of the age dummies in terms of cohort effects (literacy is higher for younger generations) would be equally possible. The other three regressions in Table 2 repeat the estimation using data from Wave 2. The size and significance of the coefficients is very similar to Wave 1. In particular, the coefficient of Φ i0 ranges between 0.25 and 0.27 and is precisely estimated, whereas the coefficient of the interaction between Φ i0 and ρ c is negative, confirming the model's prediction that a more generous social security system attenuates the effect of Φ i0.Footnote 21
5.2 Stockholding
Models I and II predict that the decision to invest in stocks and financial literacy are positively correlated. We study direct and total stockholding separately; the latter includes stocks owned through managed investment accounts and mutual funds. We use the same specification as for financial literacy, relating stock-market participation to demographic variables, education, indicators of household resources and – most importantly for the present study – the initial stock of literacy Φ i0.
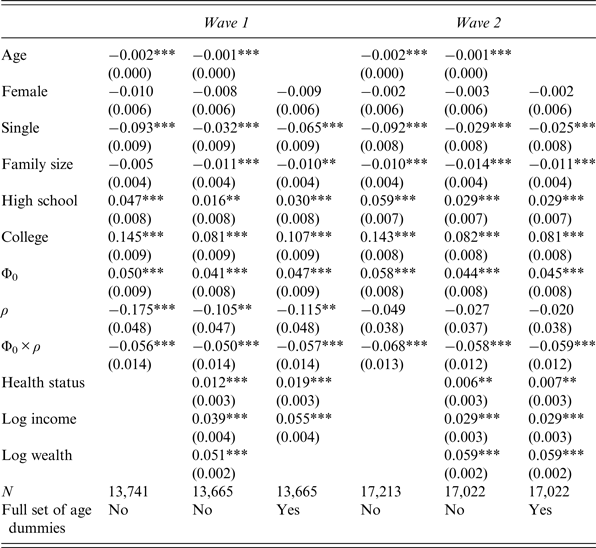
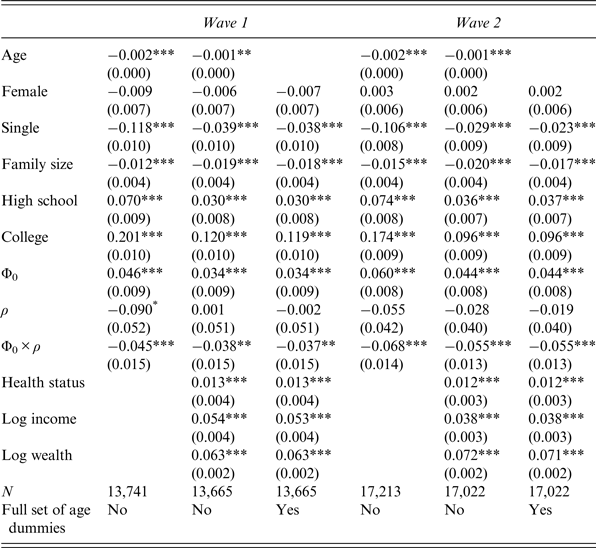
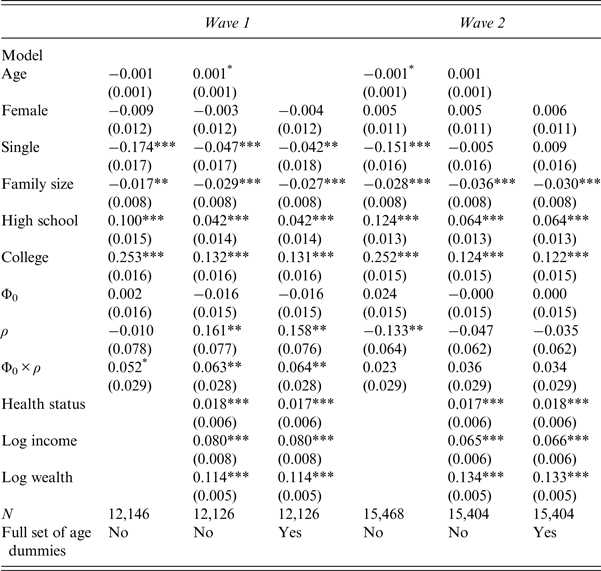
The results for direct and total stockholding are reported in Tables 3 and 4, respectively. Each of the two tables reports separate results for Waves 1 and 2. The regressions indicate that both direct and total stockholding fall with age, a result consistent with many other studies (see the survey by Guiso and Sodini, Reference Guiso, Sodini, Constantinides, Harris and Stulz2013). The results are similar for direct and total stockholding and for the two waves of SHARE, and imply that every 10 years stockholding falls by about 2%.Footnote 22 Introducing age as a linear variable does not affect any of our results, as shown in Tables 3 and 4 columns 3 and 6 where a set of age dummies replaces the linear age term. The coefficient of the female dummy is negative but imprecisely estimated, possibly because financial literacy captures part of the gender gap in stockholding, as argued in a recent paper by Almenberg and Dreber (Reference Almenberg and Dreber2011).
Direct stock−market participation

Note: All regressions include a full set of country dummies. Wave 1 was collected in 2004 and Wave 2 in 2006/2007. *p < 0.1, **p < 0.05, ***p < 0.01 (standard errors in parentheses).
Direct and indirect stock-market participation

Note: All regressions include a full set of country dummies. Wave 1 was collected in 2004 and Wave 2 in 2006/2007. *p < 0.1, **p < 0.05, ***p < 0.01 (standard errors in parentheses).
Singles are 9% less likely to invest in stocks than couples (the omitted category). But being single is correlated with household resources. In fact, controlling for income and wealth reduces the effect by a factor of roughly 3. High-school and college graduates are, respectively, 4.7 and 14.5 percentage points more likely than high-school drop-outs to hold stocks directly. The coefficient of initial literacy (Φ i0) is positive and statistically different from zero: an increase of one standard deviation of Φ i0 is associated with an increase in stockholding of about 5 percentage points, and the result is quite stable across specifications. Results for total stockholding (Table 4) are similar. These results are consistent with Model II which predicts that financial literacy triggers participation by reducing entry costs.
The coefficient of the replacement rate is negative in all regressions for direct stockholding, and in all but one regressions for total stockholding. In most specifications, however, the coefficient is not statistically different from zero. The coefficient of the interaction term (Φ i0 × ρ ic ) is negative and significant (ξ 2 < 0), showing that a higher replacement rate attenuates the effect of Φ i0 on stockholding, consistent again with Model II. The effect is similar across specifications and definitions of stockholding (direct or total), meaning that a 1% increase in the replacement rate reduces the effect of Φ i0 on stock-ownership by about 0.06 percentage points.
The effect of Φ i0 on direct stockownership varies with the replacement rate, and countries with relatively low replacement rates display stronger effects. For instance, in Germany a one standard deviation increase in Φ i0 increases participation by 3 percentage points, whereas for Italy the increase is only 1.5 points.
5.3 Risky asset share
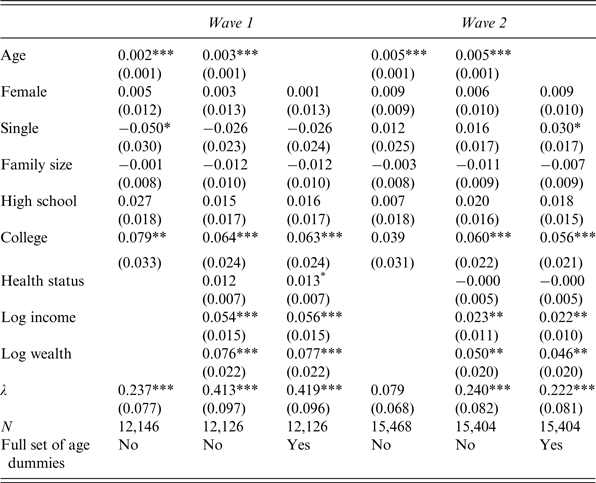
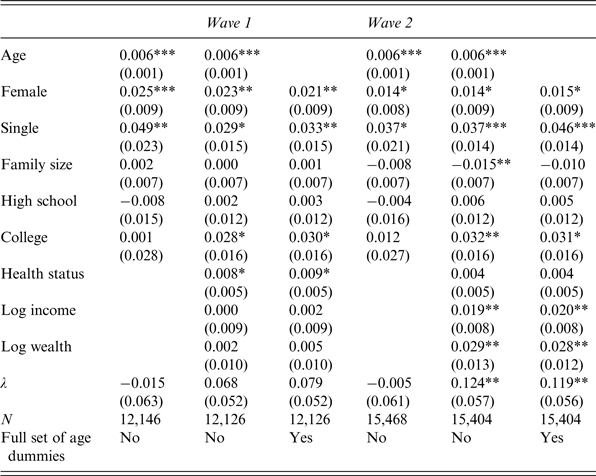
Our final set of results refers to the share of assets invested in stocks. In this case, we also use two definitions of stockholding (direct and total). Model I shows that financial literacy might affect not only stock-market participation but also the share of risky assets, allowing people to invest in assets with higher returns, whereas Model II predicts no relation. We estimate a Tobit model for the financial asset share invested in stocks and find no effect of financial literacy on the risky asset share (at conventional significance levels), regardless of the definition of the share (direct stockholding as in Table 5, or total stockholding as in Table 6). Combined with the evidence on stock-market participation, the results lend support to models (such as Model II) where literacy affects the decision to own stocks but not the asset share invested.
Asset shares – direct stockholding

Note: All regressions include a full set of country dummies. Wave 1 was collected in 2004 and Wave 2 in 2006/2007. *p < 0.1, **p < 0.05, ***p < 0.01 (standard errors in parentheses).
Asset shares – direct and indirect stockholding

Note: All regressions include a full set of country dummies. Wave 1 was collected in 2004 and Wave 2 in 2006/2007. *p < 0.1, **p < 0.05, ***p < 0.01 (standard errors in parentheses).
Note that, compared to stock-market participation, asset shares are more volatile and more difficult to predict. Most of the estimated coefficients, while reasonably signed, are not precisely estimated, with the notable exception of the high-school and college dummies, which suggests a positive relation between education and the share of risky assets.
According to standard portfolio theory with CRRA, the share of assets invested in risky assets should be independent of wealth. Our results instead reveal a positive relation between household resources and share of risky assets, suggesting that exposure to stock-market risk tends to be higher for the wealthy. The dummy for singles is negative and statistically different from zero but the effect is much reduced if we control for household resources (income and wealth). Better health status is also positively associated with a higher share of risky assets, consistent with the argument that people exposed to background risks (such as health) tend to limit exposure to risks that can be avoided.
The regressions in Tables 5 and 6 also indicate that the coefficient of Φ i0 is never statistically different from zero. We therefore use Φ i0 as the identifying variable in a selectivity-model of the share of risky assets, assuming that Φ i0 affects the participation decision but not the asset share. The main advantage of the selectivity model with respect to the Tobit model is that we can focus on the conditional asset share, i.e., restrict attention to the sample of actual stockholders. The model also allows us to distinguish between the extensive and intensive margins (respectively the decision to invest in stocks and the amount invested). The results are reported in Tables 7 and 8.
Conditional asset shares – direct stockholding

Note: All regressions include a full set of country dummies. Wave 1 was collected in 2004 and Wave 2 in 2006/2007. λ is the inverse Mills ratio. *p < 0.1, **p < 0.05, ***p < 0.01 (standard errors in parentheses).
Conditional asset shares – direct and stockholding

Note: All regressions include a full set of country dummies. Wave 1 was collected in 2004 and Wave 2 in 2006/2007. λ is the inverse Mills ratio. *p < 0.1, **p < 0.05, ***p < 0.01 (standard errors in parentheses).
The selectivity model confirms many of the results of the Tobit regressions, in particular that household resources affect conditional asset shares, the positive effect of age, gender, and being single. The pattern of the coefficients of the age dummies (not reported in columns 3 and 6 for brevity) suggest that the age profile of the conditional asset share is hump-shaped. The selectivity model is also consistent with non-random selection since in most specifications, the coefficient of the inverse Mills ratio is statistically different from zero for both direct and total stockholding.
6 Conclusions
Identifying the channels through which financial literacy affects household saving behavior is a challenge for empirical research. Previous findings of a positive correlation between measures of financial literacy and portfolio outcomes do not necessarily mean that financial literacy improves portfolio diversification, or that it causes higher stockholding and higher saving. To understand the causal relation between literacy and portfolio choice it is necessary to identify the explicit channel through which literacy affects portfolio decisions, and to address the endogeneity of literacy with respect to portfolio choice.
In this paper, we focused on lack of financial sophistication as a potential explanation for limited financial market participation. We build on the recent human capital approach to financial literacy reviewed by Lusardi and Mitchell (Reference Lusardi and Mitchell2014), and posit that, like other forms of human capital, financial knowledge can be accumulated. Accordingly, we study the joint determination of financial knowledge, saving, and portfolio decisions, both theoretically and empirically. We assume that financial literacy can be acquired at a cost, but allows individuals to access better financial investment opportunities. In particular, we propose two channels through which financial literacy might affect saving behavior, by raising the returns on risky assets and by reducing the transaction costs of entering the stock market.
We test some of the implications of the model using household data drawn from the SHARE. We find that the link between financial literacy and portfolio choice is likely due to the fact that financial knowledge reduces participation costs. The empirical results show also that financial literacy acquired early in life affects later financial literacy. Therefore, policies aimed at improving the level of financial education early in the life-cycle are likely to have long-run consequences for portfolio allocations.
We exploited the cross-country dimension of the data to test an important implication of our model, namely the role of social security in shaping the decision to accumulate financial literacy. The results indicate that the generosity of the social security systems reduces the incentives to invest in stocks, and attenuates the effect of initial literacy on the stockholding decision.
Appendix A Models’ solution
Appendix A.1 Iso-elastic Utility
Model I: Financial literacy and asset returns
Consumers live for two periods, earn income y in period 0 and retire in period 1, are endowed with a stock of financial literacy, Φ0, and choose saving (s), financial literacy (Φ1) and the risky asset share (ω) to maximize the following:
 $$\mathop {\left( {1 - \displaystyle{1 \over \sigma}}\right)}\nolimits^{ - 1} \left( {c_0^{1 - {\textstyle{1 \over \sigma}}}+ \beta {E_0}c_1^{1 - {\textstyle{1 \over \sigma}}}} \right)$$
subject to c 0 = y−pφ−s, c 1 = R(Φ1αζω)s and Φ1 = φ + (1−δ) Φ0, where 0 < β < 1 is the discount factor, 0 < δ < 1 the rate at which financial literacy is lost, E 0(·) is the expected value of consumption in period 1, and the gross portfolio return (paid at the beginning of period 1), R(Φ1 αζω), is:
 $$R({\Phi _1},\alpha, \zeta, \omega ) = \left\{ {\matrix{ {{\theta _1}({\Phi _1},\alpha, \zeta, \omega )} & {{\rm with}\;{\rm probability}} & {\eta ({\Phi _1}),} \cr {{\theta _2}({\Phi _1},\alpha, \zeta, \omega )} & {{\rm with}\;{\rm probability}} & {1 - \eta ({\Phi _1}),} }} \right.$$
where θ 1(Φ 1 ,α,ζ,ω) = Φ 1 α (1+ωζ) and θ 2(Φ 1 ,α,ζ,ω) = Φ 1 α (1−ωζ), α∈(0, 1), ζ > 0 and η′(·) > 0 and η″(·) < 0.
The first-order conditions with respect to s, Φ1, and ω are:
 $${s^{{\textstyle{1 \over \sigma}}}}= \beta c_0^{{\textstyle{1 \over \sigma}}}{E_0}R{({\Phi _1},\alpha, \zeta, \omega )^{1 - {\textstyle{1 \over \sigma}}}},$$
 $$\displaystyle{p \over s} - \displaystyle{\alpha \over {{\Phi _1}}}= \displaystyle{{\sigma \eta '({\Phi _1})\left[ {{\theta _1}{{({\Phi _1},\alpha, \zeta, \omega )}^{1 - {\textstyle{1 \over \sigma}}}}- {\theta _2}{{({\Phi _1},\alpha, \zeta, \omega )}^{1 - {\textstyle{1 \over \sigma}}}}}\right]} \over {(\sigma - 1){E_0}R{{({\Phi _1},\alpha, \zeta, \omega )}^{1 - {\textstyle{1 \over \sigma}}}}}},$$
 $${\theta _1}({\Phi _1},\alpha, \zeta, \omega )= \mathop {\left[ {\displaystyle{{\eta ({\Phi _1})} \over {1 - \eta ({\Phi _1})}}} \right]}\nolimits^\sigma {\theta _2}({\Phi _1},\alpha, \zeta, \omega ).$$
From (A.3), we obtain an expression for the share of wealth invested in the risky asset:
 $$\omega = \displaystyle{{\eta {{({\Phi _1})}^\sigma}- \mathop {\left[ {1 - \eta ({\Phi _1})} \right]}\nolimits^\sigma}\over {\zeta \left\{ {\eta {{({\Phi _1})}^\sigma}+ \mathop {\left[ {1 - \eta ({\Phi _1})} \right]}\nolimits^\sigma}\right\}}}.$$
Using the budget constraint (A.1) and (A.4), it can be shown that:
 $$s = \displaystyle{{\kappa \lpar {\Phi_1}, \alpha, \beta, \sigma \rpar } \over {1 + \kappa \lpar{\Phi_1},\alpha, \beta, \sigma \rpar }}{\lpar y - p \varphi \rpar },$$
where
 $\kappa ({\Phi _1},\alpha, \beta, \sigma ) = {(2\Phi _1^{\alpha} )^{\sigma - 1}}{\beta ^\sigma} \left\{ {{\eta ^\sigma} ({\Phi _1}) + {{[1 - \eta ({\Phi _1})]}^\sigma}} \right\}$
. Note that κ (Φ1, α, β, σ) = β, if σ = 1.
From equations (A.2), (A.4), and (A.5) the optimal level of investment in literacy is implicitly defined by:
 $$p = \displaystyle{{\kappa ({\Phi _1},\alpha, \beta, \sigma )} \over {1 + \kappa ({\Phi _1},\alpha, \beta, \sigma )}}\left[ {\displaystyle{\alpha \over {{\Phi _1}}} + \lambda ({\Phi _1},\sigma )} \right]\left( {y - p\varphi}\right),$$
where
 $$\lambda ({\Phi _1},\sigma ) = \displaystyle{{\sigma \eta '({\Phi _1})} \over {\sigma - 1}}\left\{ {\displaystyle{{\eta {{({\Phi _1})}^{\sigma - 1}} - \mathop {\left[ {1 - \eta ({\Phi _1})} \right]}\nolimits^{\sigma - 1}}\over {\eta {{({\Phi _1})}^\sigma}+ \mathop {\left[ {1 - \eta ({\Phi _1})} \right]}\nolimits^\sigma}}}\right\}.$$
The right-hand side (RHS) of equation (A.6) is the marginal return from financial literacy investment. The return has two components. The first component depends on α/Φ1; this component is positive and captures the effect of literacy on the expected return to saving, and is also present in the model without uncertainty (Jappelli and Padula, Reference Jappelli and Padula2013). The second component depends on λ(Φ1 σ), and is also positive, capturing the effect of literacy on the distribution of the risky asset return. The first component is an increasing function of α; the second component is an increasing function of η′(Φ1), i.e., of how much literacy raises the risky asset return.Footnote 23
In Appendix B, we show under which conditions the RHS of (A.6) is a decreasing function of Φ1, i.e., under which conditions the marginal return of financial literacy is a decreasing function of Φ1.
Straightforward application of the Dini theorem for implicit functions delivers Proposition 1 in the main text, which we report below:
Proposition A.1
If marginal return of financial literacy is a decreasing function of Φ 1 , the optimal level of financial literacy is an increasing function of α, β, Φ0, and y and a decreasing function of p and δ, i.e.:
 $$\displaystyle{{\partial \Phi _1^{\ast}}\over {\partial \alpha}}\gt 0,\quad \displaystyle{{\partial \Phi _1^{\ast}}\over {\partial \beta}}\gt 0,\quad \displaystyle{{\partial \Phi _1^{\ast}}\over {\partial {\Phi _0}}} \gt 0,\quad \displaystyle{{\partial \Phi _1^{\ast}}\over {\partial y}} \gt 0,\quad \displaystyle{{\partial \Phi _1^{\ast}}\over {\partial p}} \lt 0,\quad \displaystyle{{\partial \Phi _1^{\ast}}\over {\partial \delta}}\lt 0.$$
In addition, Appendix B shows that
 ${\rm lim}_{\sigma \to \infty} \Phi _1^{\ast} \gt {\rm lim}_{\sigma \to 0} \Phi _1^{\ast} $
.
One can solve equation (A.6) with respect to Φ1 and find the optimal value of financial literacy, which in turn determines saving through (A.5) and the share of wealth invested in the risky assets through (A.4). From equation (A.4) it is easy to verify that the share is positively associated with financial literacy, which leads to Proposition 2 in the main text, reported here for convenience:
Proposition A.2
If the marginal return of financial literacy is a decreasing function of Φ 1 , the optimal share of risky assets is an increasing function of α, β, Φ0, and y and a decreasing function of p and δ, i.e.:
 $$\displaystyle{{\partial {\omega ^ {\ast}}}\over {\partial \alpha}}\gt 0,\quad \displaystyle{{\partial {\omega ^{\ast}}}\over {\partial \beta}}\gt 0,\quad \displaystyle{{\partial {\omega ^{\ast}}}\over {\partial {\Phi _0}}} \gt 0,\quad \displaystyle{{\partial {\omega ^{\ast}}}\over {\partial y}} \gt 0,\quad \displaystyle{{\partial {\omega ^{\ast}}}\over {\partial p}} \lt 0,\quad \displaystyle{{\partial {\omega ^{\ast}}}\over {\partial \delta}}\lt 0.$$
In addition,
 ${\rm lim}_{\sigma \to \infty} {\omega ^{\ast}} = {\textstyle{1 \over \zeta}} \gt {\rm lim}_{\sigma \to 0}{\omega ^{\ast}} = 0.$
Next, we add social security to the baseline model. In period 0 consumers earn income y, net of social security contributions, in period 1 they receive benefits equal to b.
The first-order conditions with respect to s, Φ1, and ω are:
 $${s^{{\textstyle{1 \over \sigma}}}}= \beta c_0^{{\textstyle{1 \over \sigma}}}{E_0}\left\{ {R({\Phi _1},\alpha, \zeta, \omega )\mathop {\left[ {R({\Phi _1},\alpha, \zeta, \omega ) + \displaystyle{b \over s}} \right]}\nolimits^{ - {\textstyle{1 \over \sigma}}}} \right\},$$
 $$\displaystyle{p \over s} - \displaystyle{\alpha \over {{\Phi _1}}}= \displaystyle{{\sigma \eta ^{\prime}({\Phi _1})\left\{ {\mathop {\left[ {{\theta _1}({\Phi _1},\alpha, \zeta, \omega ) + {\textstyle{b \over {s\Phi _1^\alpha}}}}\right]}\nolimits^{1 - {\textstyle{1 \over \sigma}}}- \mathop {\left[ {{\theta _2}({\Phi _1},\alpha, \zeta, \omega ) + {\textstyle{b \over {s\Phi _1^\alpha}}}}\right]}\nolimits^{1 - {\textstyle{1 \over \sigma}}}} \right\}} \over {(\sigma - 1){E_0}\left\{ {R({\Phi _1},\alpha, \zeta, \omega )\mathop {\left[ {R({\Phi _1},\alpha, \zeta, \omega ) + {\textstyle{b \over s}}} \right]}\nolimits^{ - {\textstyle{1 \over \sigma}}}} \right\}}},$$
 $${\theta _1}({\Phi _1},\alpha, \zeta, \omega ) + \displaystyle{b \over {s\Phi _1^{\alpha}}} = \mathop {\left[ {\displaystyle{{\eta ({\Phi _1})} \over {1 - \eta ({\Phi _1})}}} \right]}\nolimits^\sigma \left[ {{\theta _2}({\Phi _1},\alpha, \zeta, \omega ) + \displaystyle{b \over {s\Phi _1^\alpha}}}\right].$$
From (A.9), the share of wealth invested in the risky asset is:
 $$\omega = \displaystyle{{\eta {{({\Phi _1})}^\sigma}- \mathop {\left[ {1 - \eta ({\Phi _1})} \right]}\nolimits^\sigma}\over {\zeta \left\{ {\eta {{({\Phi _1})}^\sigma}+ \mathop {\left[ {1 - \eta ({\Phi _1})} \right]}\nolimits^\sigma}\right\}}}\left( {1 + \displaystyle{b \over {s\Phi _1^\alpha}}}\right).$$
Using the budget constraint, (A.7) and (A.10) we can show that:
 $$s = \displaystyle{{\kappa ({\Phi _1},\alpha, \beta, \sigma )} \over {1 + \kappa ({\Phi _1},\alpha, \beta, \sigma )}}\left[ {y - p\varphi - \displaystyle{b \over {\kappa ({\Phi _1},\alpha, \beta, \sigma )\Phi _1^\alpha}}}\right].$$
The optimal level of financial literacy is implicitly defined by:
 $$p = \displaystyle{{\kappa ({\Phi _1},\alpha, \beta, \sigma )} \over {1 + \kappa ({\Phi _1},\alpha, \beta, \sigma )}}\left[ {\displaystyle{\alpha \over {{\Phi _1}}} + \lambda ({\Phi _1},\sigma )} \right]\left[ {y - p\varphi - \displaystyle{b \over {\kappa ({\Phi _1},\alpha, \beta, \sigma )\Phi _1^\alpha}}}\right] + \lambda ({\Phi _1},\sigma )\displaystyle{b \over {\Phi _1^\alpha}}.$$
Equation (A.12) indicates that b has a negative and a positive effect on the marginal return to financial literacy. The negative effect is due to the offsetting of social security with private wealth. If b increases, social security wealth increases, and therefore s and Φ1 fall. A standard background risk argument explains the positive effect. Since, social security wealth is free of risk, when b increases, consumers are more willing to invest in the risky assets, which in turn raises the incentives to invest in financial literacy. If α is large enough, the former effect prevails, and the optimal level of financial literacy is a decreasing function of b.Footnote 24 This result is summarized in the following.
Proposition A.3
If the RHS of (A.12) is a decreasing function of Φ 1 , then for large enough α the optimal level of financial literacy is a decreasing function of b, i.e.:
 $$\displaystyle{{\partial \Phi _1^ *}\over {\partial b}} \lt 0.$$
Equation (A.12) implies that Φ0 also affects the link between b and financial literacy. Depending on the model's parameters, a higher Φ0 can attenuate the effect of b on Φ1. Defining the RHS of (A.12) as Ξ (α,β,δ,Φ0,Φ1,σ,y, p, b), we can immediately verify the following proposition.
Proposition A.4
A higher Φ 0 attenuates the effect of b on the optimal level of financial literacy if:
 $$\displaystyle{{\partial \Xi \left( {\alpha, \beta, \delta, {\Phi _0},{\Phi _1},\sigma, y,p,b} \right)} \over {\partial {\Phi _1}\partial b}} \lt 0.$$
Proposition A.4 implies that the sign of
 $(\partial \Phi _1^ * /\partial {\Phi _0}\partial b)$
is the same as the sign of ∂Ξ (α,β,δ,Φ0,Φ1,σ,y, p,b)/∂Φ1∂b.
Model II: Financial literacy and transaction costs
We assume here that acquiring financial literacy reduces the transaction cost of entering the stock market. The budget constraint becomes:
 $${c_0} + \displaystyle{{{c_1}} \over R} - p{\Phi _1} + p(1 - \delta ){\Phi _0} - \displaystyle{{\Phi _1^{ - \gamma}} \over \gamma} 1\{ \omega \gt 0\} = y,$$
where the transaction cost is given by (Φ 1 −γ/γ), γ > 0, 1{·} is an indicator function, and the gross interest factor R is:
 $$R = \left\{ {\matrix{ {1 + \omega \zeta}& {{\rm with}\;{\rm probability}} & {\eta,}\cr {1 - \omega \zeta}& {{\rm with}\;{\rm probability}} & {1 - \eta,}}} \right.$$
where η > 1/2.
To compute the indirect utility from investing in the risky asset, let us assume also that ω > 0. The first-order conditions with respect to s, Φ1, and ω are:
 $$\eqalign{{s^{{\textstyle{1 \over \sigma}}}} =\beta c_0^{{\textstyle{1 \over \sigma}}}{E_0}{R^{1{ - ^{{\textstyle{1 \over \sigma}}}}}},\,\quad\quad\quad\cr p \, = \,\Phi _1^{ - (1 + \gamma )} \quad\quad\quad\quad\quad\cr 1 + \omega \zeta \, = \, \mathop {\left( {\displaystyle{\eta \over {1 - \eta}}}\right)}\nolimits^\sigma (1 - \omega \zeta ),} $$
The first-order condition with respect to s delivers the standard Euler equation for consumption. The first-order condition with respect to Φ1 implies that:
 $${\Phi _1} = \mathop {\left( {\displaystyle{1 \over p}} \right)}\nolimits^{{\textstyle{1 \over {1 + \gamma}}}}.$$
Note that equation (A.13) is not a reduced form, because it is obtained assuming ω > 0, a condition that holds only if the utility from investing in the risky asset is greater than that from not investing. From the first-order condition with respect to ω, the share of wealth invested in the risky asset is:
 $$\omega = \displaystyle{{{\eta ^\sigma}- {{(1 - \eta )}^\sigma}}\over {\zeta [{\eta ^\sigma}+ {{(1 - \eta )}^\sigma} ]}}.$$
Equation (A.14) implies that the conditional risky assets share does not depend on financial literacy. Using the Euler equation for consumption, (A.13) and (A.14) and the budget constraint, we obtain:
 $$c_0^I = \displaystyle{{\widetilde{y}} \over {1 + \widetilde{\beta}}}$$
and
 $$c_1^I = \mathop {\left( {2\beta}\right)}\nolimits^\sigma c_0^I \times \left\{ {\matrix{ {{\eta ^\sigma}}& {{\rm with}\;{\rm probability}} & {\eta,}\cr {{{(1 - \eta )}^\sigma}}& {{\rm with}\;{\rm probability}} & {1 - \eta,}}} \right.$$
where
 $\widetilde{\beta} \equiv {2^{\sigma - 1}}{\beta ^\sigma} \left[ {{\eta ^\sigma} + {{(1 - \eta )}^\sigma}} \right]$
and
 $\widetilde{y} \equiv y - {p^{{\textstyle{\gamma \over {1 + \gamma}}}}} \left( {1 + {\textstyle{1 \over \gamma}}} \right) + p{\Phi _0}(1 - \delta ).$
The indirect utility of investing in the risky asset (VI ) is computed using (A.15) and (A.16) and can be written as:
 $${V^I} = \mathop {\left( {1 - \displaystyle{1 \over \sigma}}\right)}\nolimits^{ \!\!- 1} \left[ {\mathop {\left( {1 + \widetilde{\beta}}\right)}\nolimits^{{\displaystyle{1 \over \sigma}}}\mathop {\widetilde{y}}\nolimits^{1 - {\displaystyle{1 \over \sigma}}}- \left( {1 + \beta}\right)} \right].$$
If the consumer does not invest in the risky asset, c 0 NI = (y/1 + βσ ) and c 1 NI = βσc 0 NI . Therefore, the indirect utility of not investing in the risky asset is:
 $${V^{NI}} = \mathop {\left( {1 - \displaystyle{1 \over \sigma}}\right)}\nolimits^{ - 1} \left[ {\mathop {\left( {1 + {\beta ^\sigma}}\right)}\nolimits^{{\textstyle{1 \over \sigma}}}{y^{1 - {\textstyle{1 \over \sigma}}}}- \left( {1 + \beta}\right)} \right].$$
Since
 $\widetilde{y}$
is an increasing function of Φ0, the utility of investing of investing in the risky asset is an increasing function of Φ0. The utility of not investing in risky assets is not affected by Φ0. Therefore, the utility gain from stockholding is a monotonically increasing function of Φ0, which leads to verify the following proposition:
Proposition A.5
The utility gain from investing in the risky asset, VI −VNI, is an increasing function of Φ 0 .
Proposition A.5 corresponds to Proposition 3 in the main text.
Note that if Φ0 = 0, the utility of investing in the risky asset is negative, i.e., VI < VNI when the following condition holds:
 $$p \gt \mathop {\left[ {\displaystyle{\gamma \over {1 + \gamma}} y\left( {1 - \widetilde{\Psi}}\right)} \right]}\nolimits^{{\textstyle{{1 + \gamma}\over \gamma}}},$$
where
 $\widetilde{\Psi} \equiv \mathop {\left( {{\textstyle{{1 + {\beta ^\sigma}} \over {1 + \widetilde{\beta}}}}} \right)}\nolimits^{{\textstyle{1 \over {\sigma - 1}}}} $
.Footnote
25
Condition (A.18) implies that if the price of financial literacy is sufficiently large, it is not optimal to invest in the risky asset if Φ0 = 0. Moreover,
 ${\rm lim}_{\Phi_0 \to + \infty} V^I - V^{NI} = + \infty $
, which, together with condition (A.18), implies that one can find a value for Φ0, say
 ${\bar \Phi _0}$
, such that ω > 0 if
 ${\Phi _0} \gt {\bar \Phi _0}$
. Since it is optimal to invest in financial literacy only if ω > 0, this implies that Φ0 has to be high enough to trigger investment in financial literacy. The argument is summarized in the following proposition, which restates and qualifies Proposition 4 in the main text.
Proposition A.6
If condition (A.18) is satisfied, there exists a value for Φ0,
 ${\bar \Phi _0}$
, such that VI
=VNI
, i.e.:
 $${\bar \Phi _0} = \displaystyle{1 \over {\,p(1 - \delta )}}\left[ {\left( {\displaystyle{{1 + \gamma}\over {\gamma \widetilde{\Psi}}}}\right){\,p^{{\textstyle{\gamma \over {1 + \gamma}}}}}+ \displaystyle{y \over {\widetilde{\Psi}}} \left( {\widetilde{\Psi}- 1} \right)} \right].$$
Moreover, if
 ${\Phi _0} \ge {\bar \Phi _0}$
, then ω > 0 and φ
* = Φ1
* − (1−δ)Φ0 > 0.
We next turn to examine the role of the social security system. We assume that income net of social security contributions is earned in period 0 and social security benefits b are paid in period 1. The budget constraint is:
 $${c_0} + \displaystyle{{{c_1}} \over R} - p{\Phi _1} + p(1 - \delta ){\Phi _0} - \displaystyle{{\Phi _1^{ - \gamma}} \over \gamma} 1\{ \omega \gt 0\} = y + \displaystyle{b \over R}$$
and the first-order conditions with respect to s, Φ1, and ω are unaffected.
The indirect utility of investing in the risky asset is:
 $${V^I} = \mathop {\left( {1 - \displaystyle{1 \over \sigma}}\right)}\nolimits^{ - 1} \left[ {\mathop {\left( {1 + \widetilde{\beta}}\right)}\nolimits^{{\textstyle{1 \over \sigma}}}\mathop {\left( {\widetilde{y} - t + \displaystyle{b \over R}} \right)}\nolimits^{1 - {\textstyle{1 \over \sigma}}}- \left( {1 + \beta}\right)} \right]$$
and that of not investing:
 $${V^{NI}} = \mathop {\left( {1 - \displaystyle{1 \over \sigma}}\right)}\nolimits^{ - 1} \left[ {\mathop {\left( {1 + {\beta ^\sigma}}\right)}\nolimits^{{\textstyle{1 \over \sigma}}}\mathop {\left( {y + \displaystyle{b \over R}} \right)}\nolimits^{1 - {\textstyle{1 \over \sigma}}}- \left( {1 + \beta}\right)} \right].$$
By comparing VI and VNI we can show that the analog of condition (A.18) is:
 $$p \gt \mathop {\left[ {\displaystyle{\gamma \over {1 + \gamma}} \left( {y + \displaystyle{b \over R}} \right)\left( {1 - \widetilde{\Psi}}\right)} \right]}\nolimits^{{\textstyle{{1 + \gamma}\over \gamma}}}.$$
If condition (A.19) holds, we can show that for Φ0 equal to zero, VNI > VI , leading to the following proposition.
Proposition A.7
If condition (A.19) is satisfied, there exists a value for Φ
0
,
 ${\bar \Phi _0}$
, such that VI = VNI, i.e.:
 $${\bar \Phi _0} = \displaystyle{1 \over {\,p(1 - \delta )}}\left[ {\left( {\displaystyle{{1 + \gamma}\over {\gamma \widetilde{\Psi}}}}\right){\,p^{{\textstyle{\gamma \over {1 + \gamma}}}}}+ \left( {\displaystyle{{y + {\textstyle{b \over R}}} \over {\widetilde{\Psi}}}}\right)\left( {\widetilde{\Psi}- 1} \right)} \right].$$
Moreover, if
 ${\Phi _0} \ge {\bar \Phi _0}$
, then ω > 0 and φ
* = Φ1
* − (1−δ)Φ0 > 0.
There are two implications of Proposition A.7. First, if p is large enough, the utility gain from investing in the risky assets becomes positive for sufficiently high values of Φ0. Second,
 ${\bar \Phi _0}$
is an increasing function of b. This implies that the higher is b, the higher is the initial level of financial literacy that triggers stock-market participation and investment in financial literacy.
To appreciate the effect of the generosity of the social security system on stockholding, note that both VI
and VNI
are increasing functions of b. From Proposition A.6, if
 ${\Phi _0} \gt \mathop {\overline \Phi } \nolimits_0 $
and b = 0, VI
> VNI
. Furthermore, as b increases, VI
approaches VNI
from below. If σ ⩾ 1, then VI
and VNI
diverge, but VI
does so at a slower rate than VNI
. If σ < 1,
 ${\rm lim}_{b \to \infty} {V^I} - V^{NI} = {0^-} $
. This leads to the result discussed in the main text, which we formally state below as:
Proposition A.8
There is a value for b, say
 $\overline b $
, such that VI
= VNI. Moreover, if
 $b \ge \overline b $
, then ω = 0 and φ
* = Φ1
* − (1−δ)Φ0 = 0.
Appendix A.2 Logarithmic utility
Model I: Financial literacy and asset returns
We assume here that consumers choose saving (s), investment in financial literacy (Φ1) and ω to maximize:
 $${\rm ln}\,{c_0} + \beta {E_0}\,{\rm ln}{c_1}$$
subject to c 0 = y − pφ − s and c 1 = R(Φ1 αζω)s, where 0 < β < 1 is the discount factor and E 0(·) is the expected value given what is known in period 0. The first-order conditions with respect to s, Φ1, and ω are, respectively:
 $$s = \beta {c_0},$$
 $$\displaystyle{p \over s} = \displaystyle{\alpha \over {{\Phi _1}}} + \eta ({\Phi _1}){\rm ln}\left( {\displaystyle{{1 + \omega \zeta}\over {1 - \omega \zeta}}}\right),$$
 $$1 + \omega \zeta= \left[ {\displaystyle{{\eta ({\Phi _1})} \over {1 - \eta ({\Phi _1})}}} \right](1 - \omega \zeta ).$$
From (A.22), the share of wealth invested in the risky asset is:
 $$\omega = \displaystyle{{\eta ({\Phi _1}) - \left[ {1 - \eta ({\Phi _1})} \right]} \over {\zeta \left\{ {\eta ({\Phi _1}) + \left[ {1 - \eta ({\Phi _1})} \right]} \right\}}} = \displaystyle{{2\eta ({\Phi _1}) - 1} \over \zeta}.$$
To give further insights on the solution, note that equation (A.23) can also be written as the risk-free return multiplied by the ratio of the first to the second moments of the excess return distribution:
 $$\omega = \Phi _1^\alpha \displaystyle{{[2\eta ({\Phi _1}) -\! 1]\Phi _1^\alpha \zeta}\over {{\zeta ^2}\Phi _1^{2\alpha}}}.$$
When the risk-free rate is constant and the distribution of the excess return does not depend on financial literacy, equation (A.24) reduces to the standard portfolio rule, which states that the optimal share of risky assets is proportional to the risk-adjusted excess return.
Using the first-period budget constraint and (A.20), one can show that:
 $$s = \displaystyle{\beta \over {1 + \beta}} (y - p\varphi ).$$
Equation (A.25) is not a reduced form, but an equilibrium condition, implying that investment in financial literacy and first-period saving are negatively correlated.
Equations (A.21) and (A.25) can be used to show that the optimal level of financial literacy investment is implicitly defined by:
 $$p = \displaystyle{\beta \over {1 + \beta}} \left\{ {\displaystyle{\alpha \over {{\Phi _1}}} + \eta '({\Phi _1})\,{\rm ln}\left[ {\displaystyle{{\eta ({\Phi _1})} \over {1 - \eta ({\Phi _1})}}} \right]} \right\}(y - p\varphi ). $$
The left-hand side of (A.26) does not depend on Φ1. Instead, Φ1 affects the RHS of (A.26) in three ways. If Φ1 increases the ratio α/Φ1 decreases, η′(Φ1) decreases due to the concavity of η (Φ1), while the odds-ratio, i.e., the ratio between η (Φ1) and 1 − η (Φ1) increases. The overall effect of an increase of Φ1 on the RHS of (A.26) is therefore negative if the following condition applies:
 $$ - \displaystyle{\alpha\over {\Phi _1^2 }} + \eta ''({\Phi _1})\ln \left[ {\displaystyle{{\eta ({\Phi _1})} \over {1 - \eta ({\Phi _1})}}} \right] + \displaystyle{{{{[\eta '({\Phi _1})]}^2}} \over {\eta ({\Phi _1})[1 - \eta ({\Phi _1})]}} \le 0.$$
Equation (A.27) is satisfied for large enough values of α if
 $\eta ({\Phi _1}) = {(1 + {e^{ - {\Phi _1}}})^{ - 1}}$
(see Appendix B for details).
Using the Dini theorem for implicit functions, one can show that the optimal stock of financial literacy and the share of wealth invested in the risky assets, Φ1 *, are increasing functions of α, β, Φ0, and y and decreasing functions of p and δ if equation (A.27) is satisfied, confirming Propositions A.1 and A.2 for the logarithmic case.
Model II: Financial literacy and transaction costs
We compute the indirect utility when ω > 0 and compare it with the indirect utility when ω = 0. If ω > 0, the first-order conditions with respect to s, Φ1, and ω are:
 $$\eqalign{s&= \beta {c_0}, \cr p \, &= \, \Phi _1^{ - (1 + \gamma )},\cr 1\, + \,\omega \zeta \, &= \, \left[ {\displaystyle{\eta \over {1 - \eta}}}\right]\,(1\, - \,\omega \zeta ).} $$
The first-order condition with respect to ω implies that the share of assets is:
 $$\omega = \displaystyle{{2\eta - 1} \over \zeta}.$$
Equation (A.28) implies that the risky asset share does not depend on financial literacy. The first-order condition with respect to Φ1 implies that:
 $${\Phi _1} = \mathop {\left( {\displaystyle{1 \over p}} \right)}\nolimits^{{\textstyle{1 \over {1 + \gamma}}}}.$$
From the budget constraint and the first-order conditions with respect to s and Φ1, one obtains consumption at time 0:
 $$c_0^I = \displaystyle{{\widetilde{y}} \over {1 + \beta}},$$
where
 $\widetilde{y} \equiv y - {p^{{\textstyle{\gamma \over {1 + \gamma}}}}} \left( {1 + {\textstyle{1 \over \gamma}}} \right) + p{\Phi _0}(1 - \delta )$
. Equation (A.30) defines the optimal level of consumption at time 0 if ω > 0. To compute the indirect utility of investing in the risky assets, we compute optimal consumption in period 1 using the first-order condition with respect to s and ω:
 $$c_1^I = \displaystyle{{2\beta}\over {\theta + 1}}c_0^I \times \left\{ {\matrix{ \theta & {{\rm with}\;{\rm probability}} & {\eta,}\cr 1 & {{\rm with}\;{\rm probability}} & {1 - \eta.}}} \right.$$
Plugging (A.30) and (A.31) in the utility function, we obtain the indirect utility function of investing in the risky asset:
 $$\matrix{ {{V^I} = (1 + \beta )\,{\rm ln}\displaystyle{{\widetilde{y}} \over {1 + \beta}}+ \beta {\rm ln}\beta + \beta \left[ {{\rm ln}2 + \eta {\rm ln}\eta + (1 - \eta ){\rm ln}(1 - \eta )} \right]} }.$$
Note that if η > 1/2, the term in square bracket is positive.
If the consumer does not invest in the risky asset, the return on saving is 1, and it is easy to verify that c 0 = y/1 + β and c1 NI = β c0 NI . The indirect utility of not investing in the risky asset is thus:
 $${V^{NI}} = (1 + \beta )\,{\rm ln}\displaystyle{y \over {1 + \beta}}+ \beta {\rm ln}\beta.$$
The model implies that those who do not participate in the stock market have no incentives to invest in financial literacy. If VI < VNI , it is not optimal to participate in the stock market. This happens if Φ0 is equal to zero and the following condition on the price of financial literacy holds:
 $$p \gt \mathop {\left[ {\displaystyle{\gamma \over {1 + \gamma}} y\left( {1 - \widetilde{\Psi}}\right)} \right]}\nolimits^{{\textstyle{{1 + \gamma}\over \gamma}}},$$
where
 $\widetilde{\Psi} \equiv {e^{ - (\beta /(1 + \beta ))\left[ {{\rm ln}2 + \eta {\rm ln}\eta + (1 - \eta ){\rm ln}(1 - \eta )} \right]}}$
.Footnote
26
The indirect utility of investing in the risky asset increases with Φ0, while that of not investing is not affected. Therefore, Propositions 3 and 4 also hold in the logarithmic utility case.
Appendix B Comparative statics
Appendix B.1 The RHS of (A.6) is a decreasing function of Φ1
We provide here the conditions under which the RHS of the equation:
 $$p = \displaystyle{{\kappa ({\Phi _1},\alpha, \beta, \sigma )} \over {1 + \kappa ({\Phi _1},\alpha, \beta, \sigma )}}\left[ {\displaystyle{\alpha \over {{\Phi _1}}} + \lambda ({\Phi _1},\sigma )} \right]\left( {y - p\varphi}\right)$$
is a decreasing function of Φ1.
The last term, y − pφ, decreases if Φ1 increases, and the first term, κ(Φ1
αβσ)/(1 + κ(Φ1
αβσ)) decreases if Φ1 increases provided that
 $\eta ({\Phi _1}) = {(1 + {e^{ - {\Phi _1}}})^{ - 1}}$
and σ < 1. Therefore, if the second term:
 $$\displaystyle{\alpha \over {{\Phi _1}}} + \lambda ({\Phi _1},\sigma )$$
is decreasing, the RHS of (A.6) is also decreasing function of Φ1.
Assuming that
 $\eta ({\Phi _1}) = {(1 + {e^{ - {\Phi _1}}})^{ - 1}}$
and differentiating (A.36) with respect to Φ1 gives:
 $$ - \left\{ {\displaystyle{\alpha\over {\Phi _1^2 }} + \displaystyle{{{e^{ - {\Phi _1}}}} \over {\mathop {\left( {1 + {e^{ - {\Phi _1}}}} \right)}\nolimits^2 }}\left[ {\displaystyle{{{\sigma ^2}{e^{ - (\sigma- 1){\Phi _1}}}{{(1 + {e^{ - {\Phi _1}}})}^2}} \over {\left( {1 - \sigma } \right)\mathop {\left( {1 + {e^{ - \sigma {\Phi _1}}}} \right)}\nolimits^2 }} - \displaystyle{\sigma\over {1 - \sigma }}} \right]} \right\}.$$
Therefore if:
 $$\displaystyle{\alpha \over {\Phi _1^2}}+ \displaystyle{{{e^{ - {\Phi _1}}}} \over {\mathop {\left( {1 + {e^{ - {\Phi _1}}}} \right)}\nolimits^2}} \left[ {\displaystyle{{{\sigma ^2}{e^{ - (\sigma - 1){\Phi _1}}}{{(1 + {e^{ - {\Phi _1}}})}^2}} \over {\left( {1 - \sigma}\right)\mathop {\left( {1 + {e^{ - \sigma {\Phi _1}}}} \right)}\nolimits^2}}- \displaystyle{\sigma \over {1 - \sigma}}}\right]$$
is positive, (A.36) is a decreasing function of Φ1.
It is immediate to verify that:
 $$\mathop {\lim} \limits_{\sigma \to 0} \left[ {\displaystyle{{{\sigma ^2}{e^{ - (\sigma - 1){\Phi _1}}}{{(1 + {e^{ - {\Phi _1}}})}^2}} \over {\left( {1 - \sigma}\right){{\left( {1 + {e^{ - \sigma {\Phi _1}}}} \right)}^2}}} - \displaystyle{\sigma \over {1 - \sigma}}}\right] = 0.$$
Therefore, for small σ (A.38) converges to α/Φ1 2 and (A.6) is a decreasing function of Φ1. For larger σ, (A.38) can be positive or negative.
Figure A.1 plots the loci where (A.38) is equal to zero in the (Φ1, α) plane, for various values of σ. Above each of the curves, the function (A.38) takes positive values, below it takes negative values. The figure shows that the maximum in curve for σ = 1 lies above the maxima for the other curves (and in fact for any other value of σ smaller than 1). Therefore, if α > 0.1058 (A.38) is positive and (A.36) is a decreasing function of Φ1.
 ${\textstyle{\alpha \over {\Phi _1^2}}} + {\textstyle{{{e^{ - {\Phi _1}}}} \over {\mathop {\left( {1 + {e^{ - {\Phi _1}}}} \right)}\nolimits^2}}} \left[ {{\textstyle{{{\sigma ^2}{e^{ - (\sigma - 1){\Phi _1}}}{{(1 + {e^{ - {\Phi _1}}})}^2}} \over {\left( {1 - \sigma} \right)\mathop {\left( {1 + {e^{ - \sigma {\Phi _1}}}} \right)}\nolimits^2}}} - {\textstyle{\sigma \over {1 - \sigma}}}} \right] = 0.$

Appendix B.2 The RHS of (A.26) is a decreasing function of Φ1
We show here under what conditions the RHS of the equation:
 $$p = \displaystyle{\beta \over {1 + \beta}} \left\{ {\displaystyle{\alpha \over {{\Phi _1}}} + \eta '({\Phi _1}){\rm ln}\left[ {\displaystyle{{\eta ({\Phi _1})} \over {1 - \eta ({\Phi _1})}}} \right]} \right\}(y - p\varphi )$$
is a decreasing function of financial literacy.
Assuming that
 $\eta ({\Phi _1}) = {(1 + {e^{ - {\Phi _1}}})^{ - 1}}$
and differentiating the RHS of (A.39) with respect to Φ1 gives:
 $$ - \displaystyle{\beta\over {1 + \beta }}\left\{ {\left[ {\displaystyle{\alpha\over {\Phi _1^2 }} + \displaystyle{{{e^{ - {\Phi _1}}}} \over {\mathop {\left( {1 + {e^{ - {\Phi _1}}}} \right)}\nolimits^2 }}\left( {\displaystyle{{1 - {e^{ - {\Phi _1}}}} \over {1 + {e^{ - {\Phi _1}}}}}{\Phi _1} - 1} \right)} \right](y - p\varphi ) + p\left[ {\displaystyle{\alpha\over {{\Phi _1}}} + \displaystyle{{{e^{ - {\Phi _1}}}} \over {\mathop {\left( {1 + {e^{ - {\Phi _1}}}} \right)}\nolimits^2 }}{\Phi _1}} \right]} \right\}.$$
Since the second term in square brackets is positive for Φ1 > 0, a sufficient condition for (A.40) to be negative is that:
 $$\left[ {\displaystyle{\alpha \over {\Phi _1^2}}+ \displaystyle{{{e^{ - {\Phi _1}}}} \over {\mathop {\left( {1 + {e^{ - {\Phi _1}}}} \right)}\nolimits^2}} \left( {\displaystyle{{1 - {e^{ - {\Phi _1}}}} \over {1 + {e^{ - {\Phi _1}}}}}{\Phi _1} - 1} \right)} \right] $$
is also positive.
Figure A.2 plots the locus where (A.41) is equal to zero in the (Φ1, α) plane.Footnote 27 Above the locus, the function (A.41) takes positive values, below negative. The figure shows that the locus has a maximum at about Φ1 = 0.996, where α is 0.1058. Therefore, α > 0.1058 is a sufficient condition for (A.41) being positive and (A.40) a decreasing function of Φ1.
 $\left[ {{\textstyle{\alpha \over {\Phi _1^2}}} + {\textstyle{{{e^{ - {\Phi _1}}}} \over {\mathop {\left( {1 + {e^{ - {\Phi _1}}}} \right)}\nolimits^2}}} \left( {{\textstyle{{1 - {e^{ - {\Phi _1}}}} \over {1 + {e^{ - {\Phi _1}}}}}}{\Phi _1} - 1} \right)} \right] = 0.$

Appendix B.3
 $\lim_{\sigma \rightarrow \infty} \Phi_1^{\ast} \gt \lim_{\sigma \rightarrow 0} \Phi_1^{\ast} $

This section provides the conditions under which the optimal level of financial literacy obtained as σ goes to infinity is larger than the optimal level of financial literacy obtained as σ goes to zero.
Recall that the optimal level of financial literacy is implicitly defined by:
 $$p = \displaystyle{{\kappa ({\Phi _1},\alpha, \beta, \sigma )} \over {1 + \kappa ({\Phi _1},\alpha, \beta, \sigma )}}\left[ {\displaystyle{\alpha \over {{\Phi _1}}} + \lambda ({\Phi _1},\sigma )} \right]\left( {y - p\varphi}\right).$$
Assume that
 $\eta ({\Phi _1}) = {(1 + {e^{ - {\Phi _1}}})^{ - 1}}$
. For σ equal to zero, the RHS of (A.42) reduces to:
 $$\displaystyle{{\alpha \,\Phi _1^{ - \alpha}} \over {{\Phi _1} + \Phi _1^{1 - \alpha}}}\left( {y - p\varphi}\right).$$
To evaluate the limit of the RHS of (A.42) for σ going to infinity, notice that:
 $$\mathop {\rm lim}\limits_{\sigma \to \infty}\lambda ({\Phi _1},\sigma ) = 1 - \eta ({\Phi _1}).$$
Moreover,
 $$\mathop {\rm lim} \limits_{\sigma \to \infty} \displaystyle{{\kappa ({\Phi _1},\alpha, \beta, \sigma )} \over {1 + \kappa ({\Phi _1},\alpha, \beta, \sigma )}} = \left\{ {\matrix{ 0 & {{\rm if}} & {{\rm lim_{\sigma \to \infty}} \kappa ({\Phi _1},\alpha, \beta, \sigma ) = 0,} \cr 1 & {{\rm if}} & {\,{\rm lim}_{\sigma \to \infty}} \kappa ({\Phi _1},\alpha, \beta, \sigma ) = \infty.}} \right.$$
For Φ1 to be implicitly defined by (A.42), it must happen that κ (Φ1 αβσ) diverges if σ goes to infinity. The limit of κ (Φ1 αβσ) for σ going to infinity is:
 $$\matrix{ {{\rm lim_{\sigma \to \infty}} \kappa ({\Phi _1},\alpha, \beta, \sigma ) = {{(2\Phi _1^\alpha )}^{ - 1}}{\rm lim_{\sigma \to \infty}} {{(2\beta \,\Phi _1^\alpha )}^\sigma} \left\{ {\eta {{({\Phi _1})}^\sigma}+ {{[1 - \eta ({\Phi _1})]}^\sigma}}\right\},} \cr { \ge {{(2\Phi _1^\alpha )}^{ - 1}}\,{\rm lim_{\sigma \to \infty}} {{(2\beta \,\Phi _1^\alpha )}^\sigma} [{{0.5}^\sigma}+ {{0.5}^\sigma} ] = {{(\Phi _1^\alpha )}^{ - 1}}{\rm lim_{\sigma \to \infty}} {{(\beta \,\Phi _1^\alpha )}^\sigma} \, = \,\infty}}$$
if β [Φ0(1 − δ)]α > 1. Therefore:
 $${\rm lim}_{\sigma \to \infty} \displaystyle{{\kappa ({\Phi _1},\alpha, \beta, \sigma )} \over {1 + \kappa ({\Phi _1},\alpha, \beta, \sigma )}}\left[ {\displaystyle{\alpha \over {{\Phi _1}}} + \lambda ({\Phi _1},\sigma )} \right]\left( {y - p\varphi}\right) = \left[ {\displaystyle{\alpha \over {{\Phi _1}}} + 1 - \eta ({\Phi _1})} \right]\left( {y - p\varphi}\right).$$
This shows that if β[Φ0(1 − δ)]α > 1, (A.44) lies above (A.43) since:
 $$\left[ {\displaystyle{\alpha \over {{\Phi _1}}} + 1 - \eta ({\Phi _1})} \right] \gt \displaystyle{{\alpha \Phi _1^{ - \alpha}} \over {{\Phi _1} + \Phi _1^{1 - \alpha}}}$$
and the optimal level of financial literacy is larger when σ goes to infinity than when σ is equal to zero.
Appendix C SHARE data
Appendix C.1 Imputation of wealth data in SHARE
Wealth is the sum of real and financial assets and is imputed if one or more items are missing. The questions on financial assets are about whether the respondent owns the asset and, if yes, in what amount. If the respondent declines to answer about the amount, or claims not to know, she is referred to an unfolding brackets sequence that includes three threshold values which differ by the country and asset item. The respondent is randomly assigned to one of the three thresholds and is asked whether she owns more or less than that threshold. Depending on the answer, the next question refers to the next higher or lower threshold, and so on. The thresholds impose barriers on the range of acceptable values for each asset, which are taken into account during the imputation process.
The imputation procedure involves the construction of a system of equations that include economic and demographic variables, and where each variable is imputed sequentially through many iterations, conditional on the values of the other variables in the system from the same or previous iterations (for a fuller description of the process see Christelis, (Reference Christelis, Börsch-Supan, Brugiavini, Jürges, Mackenbach, Siegrist and Weber2008) and Christelis (Reference Christelis2011)). This chained imputation procedure is analogous to the one implemented in the US Survey of Consumer Finances; see Kennickel (Reference Kennickell1991).Footnote 28 Additional details on the construction of the wealth variables can be found in the SHARE Release Guide 2.6.0 Waves 1 & 2 (2013).Footnote 29 All values are adjusted for differences in the purchasing power of money across countries using OECD purchasing power parity data.
Appendix C.2 Financial literacy in SHARE
The questions used to construct the financial literacy indicator are set out below. Possible answers are shown on cards displayed by the interviewer who is instructed not to read them out to respondents:
-
1. If the chance of getting a disease is 10%, how many people out of 1,000 can be expected to get the disease? The possible answers are 100, 10, 90, 900, or some other answer.
-
2. In a sale, a shop is selling all items at half-price. Before the sale a sofa costs 300€. How much will it cost in the sale? The possible answers are 150, 600, or some other answer.
-
3. A secondhand car dealer is selling a car for 6,000€. This is two-thirds of what it costs new. How much did the car cost new? The possible answers are 9,000, 4,000, 8,000, 12,000, 18,000, or some other answer.
-
4. Let us say you have 2,000 €in a savings account. The account earns 10% interest each year. How much would you have in the account at the end of the second year? The possible answers are 2,420, 2,020, 2,040, 2,100, 2,200, 2,400.
As in Dewey and Prince (Reference Dewey, Prince, Börsch-Supan, Brugiavini, Jürges, Mackenbach, Siegrist and Weber2005), if a person answers (1) correctly she is then asked (3) and if she again answers correctly she is asked (4). Answering (1) correctly results in a score of 3, answering (3) but not (4) correctly, results in a score of 4, while answering (4) correctly results in a score of 5. On the other hand, if she answers (1) incorrectly she is directed to (2). If she answers (2) correctly she gets a score of 2, while if she answers (2) incorrectly she gets a score of 1.
Appendix C.3 Mathematical ability in SHARELIFE
SHARELIFE has a module on childhood that asks about living conditions, accommodation, and family structure. Additionally, the module asks questions about mathematical ability at age 10. The exact wording of the question is: ‘Now I would like you to think back to your time in school when you were 10 years old. How did you perform in Maths compared to other children in your class? Did you perform much better, better, about the same, worse or much worse than the average?’
The module asks a similar question about language skills: ‘And how did you perform in [country's Language] compared to other children in your class? Did you perform much better, better, about the same, worse or much worse than the average?’