INTRODUCTION
Diagnostic efficiency statistics are central to evaluating the clinical usefulness of a test in terms of whether a specific cut-score on that test accurately identifies individuals who are likely to fall within a particular diagnostic group (Ivnik et al., Reference Ivnik, Smith, Verhan, Boeve, Tangalos and Petersen2001). Diagnostic efficiency statistics include sensitivity, specificity, classification hit rates, positive and negative predictive values, odds ratios, and likelihood ratios (Ivnik et al., Reference Ivnik, Smith, Verhan, Boeve, Tangalos and Petersen2001). Performances of many clinical groups including traumatic brain injury (TBI) show significant reduction on specific Wechsler Adult Intelligence Scale-III (WAIS-III, Wechsler, Reference Wechsler1997a) and Wechsler Memory Scale-III (WMS-III, Wechsler, Reference Wechsler1997b) indices (Donders, Tulsky, & Zhu, Reference Donders, Tulsky and Zhu2001; Fisher, Ledbetter, Cohen, Marmor, & Tulsky, Reference Fisher, Ledbetter, Cohen, Marmor and Tulsky2000; Langeluddecke & Lucas, Reference Langeluddecke and Lucas2003, Reference Langeluddecke and Lucas2005; Martin, Donders, & Thompson, Reference Martin, Donders and Thompson2000). However, diagnostic statistics are often not reported; therefore, the clinical significance of those reductions for rehabilitation management and planning as well as medico legal implications may be unclear. This may be particularly important where the individual’s particular demographic characteristics are markedly different from those of normative data (Heaton, Taylor, & Manly, Reference Heaton, Taylor, Manly, Tulsky, Saklofske, Chelune, Heaton, Ivnik, Bornstein, Prifitera and Ledbetter2003).
In healthy controls, educational level is positively correlated with neuropsychological test performances (e.g., Matarazzo, Reference Matarazzo1972; Matarazzo & Herman, Reference Matarazzo and Herman1984; Shores & Carstairs, Reference Shores and Carstairs2000). WAIS-III and WMS-III indices were generally significantly correlated with education in the standardization sample (Heaton et al., Reference Heaton, Taylor, Manly, Tulsky, Saklofske, Chelune, Heaton, Ivnik, Bornstein, Prifitera and Ledbetter2003). In recognition of educational effects, a computerized scoring program has been developed to provide corrections for education, some cultures, and sex (The Psychological Corporation, 2001a), and education-stratified base-rate information on WAIS-III and WMS-III discrepancy scores is available (Dori & Chelune, Reference Dori and Chelune2004). In standardization sample controls with less than 12 years of education, application of a cut-score of one standard deviation below the mean misclassified 25–40% as impaired on specific indices, whereas use of demographic corrections reduced misclassification rates to approximately 15% (Heaton et al., Reference Heaton, Taylor, Manly, Tulsky, Saklofske, Chelune, Heaton, Ivnik, Bornstein, Prifitera and Ledbetter2003).
In clinical groups, education effects have been demonstrated on a range of neuropsychological tests (e.g., Finlayson et al., Reference Finlayson, Johnson and Reitan1977; Sherrill-Pattison, Donders, & Thompson, Reference Sherrill-Pattison, Donders and Thompson2000; Vanderploeg, Axelrod, Sherer, Scott, & Adams, Reference Vanderploeg, Axelrod, Sherer, Scott and Adams1997). WAIS-III/WMS-III data were collected on clinical groups as part of its standardization, including TBI (n = 22) (The Psychological Corporation, 1997). Analysis of TBI and control data, using demographically corrected WAIS-III Processing Speed Index and the cut-score of one standard deviation below the mean, produced sensitivity of 90.5% and specificity of 85% (Taylor & Heaton, Reference Taylor and Heaton2001), those statistics for age adjusted scores were not available. Two studies examined diagnostic efficiency statistics of demographically corrected compared with age corrected WAIS-III measures in TBI versus control groups (Blake, Fichtenberg, & Abeare, Reference Blake, Fichtenberg and Abeare2009; Strong, Donders, & Van Dyke, Reference Strong, Donders and Van Dyke2005). WAIS-III indices of control (n = 45) and moderate to severe TBI (n = 47) groups returned similar diagnostic efficiency statistics for demographically corrected and age corrected indices with approximately 70% correctly classified (Strong et al., Reference Strong, Donders and Van Dyke2005). A recent study analyzed WAIS-III subtest scores for mild to severe TBI (n = 57) and matched control (n = 61) groups, with no difference in the areas under the receiving operating curve between demographically corrected and age corrected scores (Blake et al., Reference Blake, Fichtenberg and Abeare2009). Thus, despite the strong relationship between education and test scores and the inherent logic in correcting for demographic factors and particularly education, the validity of demographically corrected scores in improving diagnostic efficiency in TBI has not been established. However, there were several limitations of the above studies. The average level of education was 12–13 years with only a small proportion of individuals with low or high levels of education. Given that the extremes of the education range are the groups in whom the effects of demographic corrections for education are likely to be most marked (Heaton et al., Reference Heaton, Taylor, Manly, Tulsky, Saklofske, Chelune, Heaton, Ivnik, Bornstein, Prifitera and Ledbetter2003), this limits the generalisability of the findings when applied to low or high education groups. WMS-III indices were not included in either study, which may have reduced demographic effects and WAIS-III subtests rather than factor scales were examined in the study by Blake et al. (Reference Blake, Fichtenberg and Abeare2009). Mild TBI participants were combined with the moderate to severe group in one study (Blake et al., Reference Blake, Fichtenberg and Abeare2009), possibly increasing heterogeneity and group variance and limiting statistical power. While both studies provided some key information about the diagnostic capacity of WAIS-III measures, this could have been extended to encompass all relevant statistics including multiple likelihood ratios for different cut-scores, given their importance in evaluating the clinical usefulness of tests in diagnosis (Grimes & Schulz, Reference Grimes and Schulz2005; Strauss, Richardson, Glasziou, & Haynes, Reference Strauss, Richardson, Glasziou and Haynes2005).
The purpose of the current study was to address the issues described above in an evaluation of the diagnostic capabilities of demographically corrected and age corrected WAIS-III and WMS-III indices in moderate to severe TBI in individuals with lower levels of education. The TBI group (n = 100) were referrals to an outpatient rehabilitation service and were compared with matched controls drawn from the WAIS-III/WMS-III standardization sample. Educational level was expected to be significantly correlated with WAIS-III/WMS-III index scores. It was hypothesized that the application of demographically corrected WAIS-III/WMS-III index scores would be associated with higher diagnostic efficiency statistics than that obtained with age corrected indices.
METHOD
Research Participants
Approval to access archival data was granted by Institutional Ethics Committees.
TBI group
For the clinical group, neuropsychological assessment data were extracted and analyzed for consecutive referrals following TBI to a tertiary outpatient rehabilitation service. A total of 457 individuals were referred, of whom 100 participants met inclusion and exclusion criteria (see Figure 1). Inclusion criteria were as follows: (1) evidence that a TBI was incurred as indicated by documented loss of consciousness, loss of memory for events immediately before or after the incident, alteration in mental state, or focal neurological deficits (Malec et al., Reference Malec, Brown, Leibson, Flaada, Mandrekar and Diehl2007); (2) moderate to severe TBI defined as posttraumatic amnesia (PTA) of 1 day or more measured prospectively using the Westmead PTA scale (Shores, Marosszeky, Sandanam, & Batchelor, Reference Shores, Marosszeky, Sandanam and Batchelor1986) and initial Glasgow Coma Scale (GCS; Teasdale & Jennett, Reference Teasdale and Jennett1974) of 12 or less on hospital admission and/or neuroradiological evidence of trauma-related intracranial abnormalities (Malec et al., Reference Malec, Brown, Leibson, Flaada, Mandrekar and Diehl2007)—those with PTA of more than 1 day who did not meet this second criterion were excluded given the possible confounding effects on mental state and PTA scores of trauma associated factors, for example, effects of analgesia for fractures, or systemic or psychological shock (Malec et al., Reference Malec, Brown, Leibson, Flaada, Mandrekar and Diehl2007); (3) aged between 16 and 75 years; (4) neuropsychological assessment obtained after emergence from PTA and 6 weeks to 2 years posttrauma; 2 years was chosen as a cut-point postinjury to increase group homogeneity; (5) education of 7 to 12 yearsFootnote 1; (6) English-speaking background; (7) estimated premorbid intellectual function 70 or above, based on Wechsler Test of Adult Reading (The Psychological Corporation, 2001b) and no reports of special schooling.
Participants referred for neuropsychological assessment post TBI. 1. Unclear severity of TBI due to lack of available medical documentation; 2. Prior TBI with loss of consciousness of more than 5 min; 3. Comorbid psychiatric conditions such as schizophrenia, psychosis, delusions, severe depression, anxiety; 4. Significant drug and alcohol use requiring treatment and/or impairing occupational or social function; 5. Neurological condition such as history of stroke, TIAs, cerebrovascular disease; 6. Missing subtests on WAIS-III or WMS-III such that index scores unable to be calculated; 7. Dysphasia resulting in severe impairment of expressive or receptive language; 8. Visual impairment such as blindness; 9. LD, learning difficulty with special classes reported or estimated IQ < 70 on Wechsler Test of Adult Reading; 10. TOMM, Test of Memory Malingering score on trial 2 or delay of less than 45; 11. Digit Span, WAIS-III Scaled Score of 5 or less and/or Vocabulary minus Digit Span Scaled Score of 6 or more.

Exclusion criteria were as follows: (1) previous neuropsychological examination; (2) history of prior moderate to severe head trauma or other neurological condition (e.g., preinjury epilepsy, stroke, cerebrovascular disease, hypoxia); (3) evidence of current significant psychiatric conditions such as severe depression, anxiety, psychosis or delusions, or chronic psychiatric treatment resulting in impaired occupational or social function; (4) current hazardous levels of alcohol use as defined by Alcohol Use Disorders Identification Test score of 10 or more (Babor, Higgins-Biddle, Saunders, & Monteira, Reference Babor, Higgins-Biddle, Saunders and Monteira2001); (5) sensory and motor impairment such as impaired vision, expressive language deficits in terms of inability to formulate responses, inadequate upper extremity use to manipulate pen and test materials; (6) evidence of inadequate levels of cooperation and motivation on the Test of Memory Malingering (Tombaugh, Reference Tombaugh1996) and/or Vocabulary minus Digit Span index of 6 or more (Miller, Ryan, Carruthers, & Cluff, Reference Miller, Ryan, Carruthers and Cluff2004; Mittenberg et al., Reference Mittenberg, Theroux, Aguila-Puentes, Bianchini, Greve and Rayls2001) and/or Digit Span Scaled Score of 5 or less (Iverson & Tulsky, Reference Iverson and Tulsky2003).
The neuropsychological test scores of 86% of the final group were included in an earlier analysis of the effects of cultural background on test performances (submitted for publication); participants were not re-tested.
Control group
The control group (n = 100) was extracted from the WAIS-III and WMS-III standardization data. A subset of individuals for whom all eight WAIS-III and WMS-III index scores were available and who had 12 years or less education (n = 733) was obtained with permission from NCS Pearson, Inc.Footnote 2 The following criteria were used for selecting cases to form the control group (1) white ethnic background, given that other U.S. ethnic groups (African-American and Hispanic) did not match those of the TBI group (n = 557), (2) 7 to 12 years education (n = 555) and (3) aged between 16 and 75 years (n = 412). From this group, controls were selected to match TBI participants by years of education, sex, and age; matching for years of education and sex was prioritized over age, given that education was the demographic variable of most interest and all scores were age adjusted.
Procedure
Clinical participants completed a detailed interview and neuropsychological assessment with a Clinical Neuropsychologist (A.W.) between 2001 and 2007, as part of their rehabilitation postinjury. Information about medical, educational, and occupational history; drug and alcohol use; psychiatric and psychological state; and compensation status was obtained from participants and a family member. Relevant injury-related information was extracted from medical records as part of this assessment, including injury mechanism, weeks postinjury, duration of PTA based on Westmead PTA scale scores (Shores et al., Reference Shores, Marosszeky, Sandanam and Batchelor1986), admission GCS (Teasdale & Jennett, Reference Teasdale and Jennett1974) and reported presence of abnormality on CT brain scan.
Administration and scoring procedures were standardized. The following measures were administered as part of a comprehensive neuropsychological assessment:
All subtests of the Wechsler Adult Intelligence Scale-Third edition, Australian adaptation, WAIS-III (Wechsler, Reference Wechsler1997a) required to calculate: (1) Verbal Comprehension Index (VCI; Vocabulary, Similarities, Information); (2) Perceptual Organization Index (POI; Picture Completion, Block Design, Matrix Reasoning); (3) Working Memory Index (WMI; Arithmetic, Digit Span, Letter Number Sequencing); (4) Processing Speed Index (PSI; Digit Symbol, Symbol Search); all subtests of the Wechsler Memory Scale-Third edition, WMS-III (Wechsler, Reference Wechsler1997b) required to calculate: (1) Auditory Immediate Memory (Logical Memory I, Verbal Paired Associates I); (2) Auditory Delayed Memory (Logical Memory II, Verbal Paired Associates II); (3) Visual Immediate Memory (Faces I, Family Pictures I); (4) Visual Delayed Memory (Faces II, Family Pictures II).
The computer-based Wechsler scoring program (The Psychological Corporation, 2001a) was used to obtain standard scores and demographically corrected T-scores for each of the eight indices. With respect to ethnic background, 88% were of white English-speaking background and 12% were born and educated in Australia of diverse cultural backgrounds, specifically, European (n = 5), Middle East (n = 2), Asia/Pacific (n = 4), and Africa (n = 1). These ethnic backgrounds did not match the nonwhite groups within the standardization sample (African-American and Hispanic); therefore, demographic norms were generated using the standardization data for “Whites.” Demographically corrected T-scores for each index were converted to standard scores to allow comparability with age corrected index scores.
WAIS-III and WMS-III index scores for the control group were provided with permission by NCS Pearson, Inc., who also provided algorithms that were used to calculate the demographically corrected scores. The accuracy of this process was checked by entering raw scores for a random selection of 10% of cases on the computer scoring program.
Data Analysis
Results were analyzed using the Statistical Package for the Social Sciences, version 14. The following analyses were planned a priori: (1) Comparison of group demographic variables with one way analysis of variance for interval level variables (age, education) and χ2 values for categorical variables (sex). (2) Normality of distribution of dependent variables was examined by calculating kurtosis, skewness, and Shapiro-Wilks test values and inspecting histograms, normal Q-Q plot and box plots. While not all criteria were met for every variable, the distribution of each dependent variable was approximately normal within each group (Peat & Barton, Reference Peat and Barton2005). (3) The presence of significant relationships between index scores and age and education was investigated by the inspection of scatter plots and the calculation of Pearson correlation coefficients. (4) Group differences were examined by subjecting neuropsychological index score data to univariate analysis of variance with one between-subjects independent variable, group with two levels. To minimize the probability of Type 1 error over 16 comparison tests, the Bonferroni correction was applied and p < .003 required for significance. (5) The diagnostic efficiency of demographically corrected indices compared with age corrected indices was examined by conducting logistic regression analyses for each of the two sets of indices. The dependent variable was group membership (TBI vs. control); all eight indices were the predictor variables tested for inclusion in the model. Backward stepwise conditional model building was chosen to minimize the possibility of spurious findings (Babyak, Reference Babyak2004; Steyerberg, Eijkemans, Harrell, & Habbema, Reference Steyerberg, Eijkemans, Harrell and Habbema2001). For both age corrected and demographically corrected index models, diagnostic efficiency statistics including overall classification accuracy, sensitivity, specificity, and odds ratio were calculated and the area under the receiver operating curve (AUC) was calculated using MedCalc, version 9.6 (MedCalc Software, Mariakerke, Belgium), statistical difference between AUC values was examined.
The following analyses were conducted post hoc: (1) Given that Processing Speed was the most significant index for both age and demographically corrected logistic regression models, diagnostic efficiency statistics were calculated for that index alone with the application of cut-scores on PSI of one, one-and-a-half, and two standard deviations below the mean for controls. These statistics included multiple likelihood ratios at different cut-points (Strauss et al., Reference Strauss, Richardson, Glasziou and Haynes2005). (2) Diagnostic efficiency statistics for both sets of indices were further examined by conducting a second set of logistic regression analyses using backward stepwise conditional model building of the same TBI group against a larger and unmatched control group. For these analyses, the control group (n = 557) comprised all individuals from the WAIS-III and WMS-III standardization sample who were of white ethnic background with 12 or less years education and for whom all eight indices were available. (3) Two additional logistic regression analyses were conducted as a test of the relative significance of demographic variables, where group was the dependent variable and the following independent variables were tested for inclusion in the model: Processing Speed raw score composite (Digit Symbol raw score + Symbol Search raw score), age, sex, and education. This analysis was run on both matched and unmatched samples. (4) Education- and age-stratified means for age and demographically corrected indices were calculated for the TBI group, to examine the variability in the demographic effects according to distribution on these factors.
RESULTS
Group Characteristics and Relationships Between Index Scores and Demographic Variables
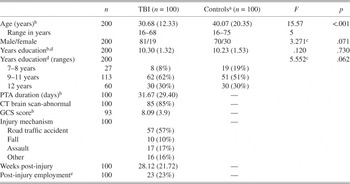
Comparison of group demographic variables indicated that there were no significant group differences for years of education or sex; this was expected given that controls were selected to match TBI cases (see Table 1). Controls with lower levels of education had an average age of 40 years, which was significantly older than the TBI group (average 31 years). Within the control group only, there was a significant negative correlation between age and years of education (r = −.389; p < .001).
Group demographic characteristics and TBI injury characteristics

Note
TBI = traumatic brain injury; PTA = posttraumatic amnesia; CT = computed tomography; GCS = Glasgow Coma Scale.
a Subset of standardization data from the Wechsler Adult Intelligence Scale-Third Edition. Copyright © 1997 by NCS Pearson, Inc. and the Wechsler Memory Scale-Third Edition. Copyright © 1997 by NCS Pearson, Inc. Used with permission. All rights reserved.
b Mean (SD).
c χ2.
d For individuals aged 16–19, education based on parents’ education in accord with standardization sample.
e Full-time (n = 11), part-time/casual work (n = 5), student (n = 6), return to work program (n = 1).
In the TBI group, duration of PTA was an average of 32 days (range, 2–120 days) and GCS score was an average of 8.1 (range, 3–15). Trauma-related neuroimaging changes on CT or MRI brain scan were evident in 85% of the group. TBI participants were assessed an average of 28 weeks after injury and less than one-quarter had returned to full or part-time employment at that time.
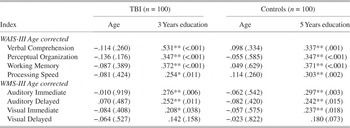
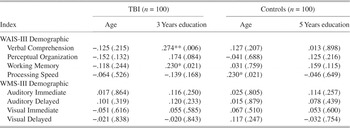
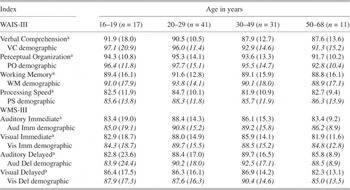
The relationships between age corrected and demographically corrected index scores and the demographic variables age and education are depicted in Tables 2 and 3, with education showing significant and positive correlations with most age corrected indices.
Pearson correlation coefficients (p) between demographic characteristics and index scores: age corrected

Note
WAIS-III = Wechsler Adult Intelligence Scale-III; WMS-III = Wechsler Memory Scale-III.
** p < .01.
* p < .05.
Pearson correlation coefficients (p) between demographic characteristics and index scores: demographically corrected

Note
TBI = traumatic brain injury; WAIS-III = Wechsler Adult Intelligence Scale-III; WMS-III = Wechsler Memory Scale-III.
** p < .01.
* p < .05.
Group Comparison of Index Scores
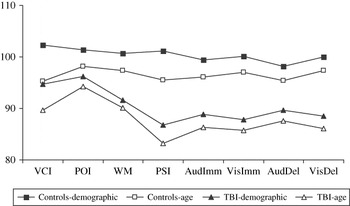
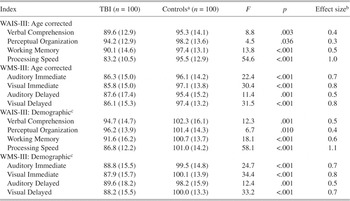
Index score profiles for TBI and control groups are depicted in Figure 2. Univariate analysis of variance with group as the between-subjects independent variable and p < .003 required for significance showed that with the exception of Perceptual Organization, all age and demographically corrected indices showed a significant main effect for group as shown in Table 4. Effect sizes were similar across age and demographically corrected indices with greatest effect sizes for Processing Speed Index, followed by Verbal and Visual Immediate Memory and Visual Delayed Memory indices.
WAIS-III and WMS-III age and demographically corrected index scores for TBI (n = 100) and controls (n = 100). Controls comprise a subset of the standardization data from the Wechsler Adult Intelligence Scale-Third Edition. Copyright © 1997 by NCS Pearson, Inc. and the Wechsler Memory Scale-Third Edition. Copyright © 1997 by NCS Pearson, Inc. Used with permission. All rights reserved. VCI = WAIS-III Verbal Comprehension Index, POI = WAIS-III Processing Speed Index, WM = WAIS-III Working Memory Index, PSI = WAIS-III Processing Speed Index, AudImm = WMS-III Auditory Immediate Memory, VisImm = WMS-III Visual Immediate Memory, AudDel = WMS-III Auditory Delay Memory, VisDel = WMS-III Visual Delay Memory, Controls-demographic = control group, demographically corrected scores, Controls-age = control group, age corrected scores, TBI-demographic = TBI, demographically corrected scores, TBI-age = TBI, age corrected scores.

TBI and control group means (SD) and effect sizes for age corrected and demographically corrected WAIS-III and WMS-III indices

Note:
Analysis of variance, one between-groups factor with two levels, df (1,198), p < .003 required for significance. TBI = traumatic brain injury; WAIS-III = Wechsler Adult Intelligence Scale-III; WMS-III = Wechsler Memory Scale-III.
a Subset of standardization data from the Wechsler Adult Intelligence Scale-Third Edition. Copyright © 1997 by NCS Pearson, Inc. and the Wechsler Memory Scale-Third Edition. Copyright © 1997 by NCS Pearson, Inc. Used with permission. All rights reserved.
b Effect size calculated using Cohen’s d (Cohen, Reference Cohen1988).
c Demographic corrected index scores, T-scores converted to standard scores for comparability.
Diagnostic Efficiency Statistics
Diagnostic efficiency was examined using logistic regression analyses for each of the two sets of eight indices. The age corrected indices correctly classified 77% (154/200) of all participants, with sensitivity of 82%, specificity of 72%, and odds ratio of 11.57. The demographically corrected indices correctly classified 74% (148/200) of participants, with sensitivity of 76%, specificity of 72%, and odds ratio of 8.14. AUC was 0.824 for age corrected indices and 0.833 for demographically corrected indices; the difference was not statistically significant (z = 0.55; p = .58).Footnote 3
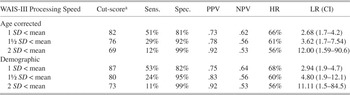
Processing Speed Index (PSI) was the most significant variable for both logistic regression analyses; therefore, the analyses were repeated using this as the sole predictor variable. PSI (age corrected) correctly classified 70% (140/200) of participants, with sensitivity of 68% and specificity of 72%. PSI with demographic corrections correctly classified 70.5% (141/200) of participants, with sensitivity of 76% and specificity of 65%. AUC was 0.767 for both age corrected and demographically corrected PSI. Pair wise comparisons indicated that there were no differences between AUC values produced by combined indices from logistic regression analysis and those of PSI. Diagnostic efficiency statistics including positive and negative predictive value, odds ratios and likelihood ratios are presented in Table 5. Given that in clinical practice, impairment is usually defined using cut-scores such as one, one-and-a-half, or two standard deviations below the mean for controls, diagnostic efficiency statistics were also calculated for these particular values for age corrected and demographically corrected PSI, as shown in Table 6.
Diagnostic efficiency statistics for age corrected and demographically corrected WAIS-III Processing Speed Index and logistic regression generated prediction equations, given base rate of 50% for TBI

Note
Sens. = sensitivity; Spec. = specificity; PPV = positive predictive value; NPV = negative predictive value; HR = hit rate or total proportion correctly classified; AUC= area under receiver operating curve; OR = odds ratio; LR (CI) = likelihood ratio and 95% confidence interval; Log reg equation = logistic regression equation.
a Cut-score for each measure selected to maximize overall hit rate.
b Logistic regression prediction equation based on age corrected indices (−.107*PSI − .085*Auditory Immediate − .050*Visual Delayed + .057*POI + .069*Auditory Delayed + 10.101).
c Logistic regression prediction equation based on demographically corrected indices (−.135 * PSI − .130*Auditory Immediate − .071*Visual Immediate + 0.98*Auditory Delayed + .053*POI + 8.35).
Diagnostic efficiency statistics for WAIS-III Processing Speed Index using cut-scores of one, one-and-a-half, and two standard deviations below the mean (base rate 50%)

Note
WAIS-III = Wechsler Adult Intelligence Scale-III; Sens. = sensitivity; Spec. = specificity; PPV = positive predictive value; NPV = negative predictive value; HR = hit rate or total proportion correctly classified; LR (CI) = likelihood ratio and 95% confidence interval.
a Cut-score calculated on standard deviations below the mean for controls.
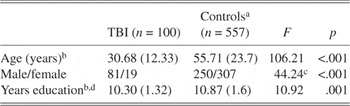
Given the finding of no difference in the diagnostic efficiency statistics of age corrected and demographically corrected indices, a second set of logistic regression analyses was conducted using the same TBI group against a larger and unmatched control group (n = 557), comprising all individuals from the WAIS-III and WMS-III standardization sample who were of white ethnic background with 12 or less years education and for whom all eight indices were available. The demographic characteristics of this group did not match that of the TBI group; controls were significantly more educated, tended to be female, and were considerably older, as shown in Table 7. Logistic regression analyses indicated that the age corrected indices correctly classified 86% (566/657) of all participants, with sensitivity of 25% and specificity of 97%; the demographically corrected indices also correctly classified 86% (563/657) of participants, with sensitivity of 19% and specificity of 98%.Footnote 4 AUC was 0.869 for age corrected indices and 0.816 for demographically corrected indices, the difference was not significant. Diagnostic efficiency statistics for these analyses are presented in Table 8.
Group demographics of TBI (n = 100) and larger unmatched control group (n = 557)

Note
TBI = traumatic brain injury.
a Subset of standardization data from the Wechsler Adult Intelligence Scale-Third Edition. Copyright © 1997 by NCS Pearson, Inc. and the Wechsler Memory Scale-Third Edition. Copyright © 1997 by NCS Pearson, Inc. Used with permission. All rights reserved.
b Mean (SD).
c χ2.
d For individuals aged 16–19, education based on parents’ education in accord with standardization sample.
Diagnostic efficiency statistics for age corrected and demographically corrected indices with larger unmatched control group (n = 557), given base rate of 15.2% for TBI

Note
Sens. = sensitivity; Spec. = specificity; PPV = positive predictive value; NPV = negative predictive value; HR = hit rate or total proportion correctly classified; AUC = area under receiver operating curve; LR (CI) = likelihood ratio and 95% confidence interval; Log reg equation = logistic regression equation.
To further examine the relative significance of demographic variables to the prediction of group membership, additional logistic regression analyses were conducted on matched and unmatched samples. Group was the dependent variable and the following independent variables were tested for inclusion in the model: Processing Speed raw score composite (Digit Symbol raw score + Symbol Search raw score), age, sex, and education. As shown in Table 9, for matched samples (n = 200), significant predictors were age and Processing Speed raw composite. For unmatched samples (n = 657), significant predictors were sex, age, Processing Speed raw score composite and education, as shown in Table 10. Although education was a statistically significant predictor of group membership in this analysis, when it was removed from the model, the overall correct classification rate changed little—from 87.4% to 86.1%. Within the TBI group the reduction was from 42% to 36% and in controls from 95.5% to 95.2%.
Logistic regression analysis results for predicting TBI and control group membership from Processing Speed composite raw score and demographic variables, matched groups (n = 200)

Note
TBI = traumatic brain injury.
Logistic regression analysis results for predicting TBI and control group membership from Processing Speed composite raw score and demographic variables, unmatched groups (n = 657)

Note
TBI = traumatic brain injury.
Effects of Demographic Corrections by Education and Age
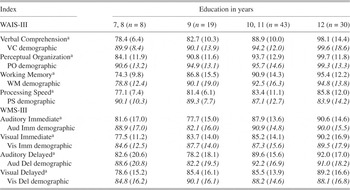
The effects of demographic corrections may be expected to be relatively greater for individuals within the lower extremes of the education range (as well as the higher extremes had these been these been represented). Inspection of age corrected and demographically corrected index scores for the TBI group by education suggested that the effects were greater for lower education levels, while little difference was evident for those with 12 years education (see Table 11). The magnitude of the demographic correction did not appear to vary according to age (see Table 12).
Education-stratified TBI group means (SD) for age corrected and demographically corrected indices

Note
TBI = traumatic brain injury; WAIS-III = Wechsler Adult Intelligence Scale-III; WMS-III = Wechsler Memory Scale-III.
a Age corrected index.
Age-stratified TBI group means (SD) for age corrected and demographically corrected indices

Note
TBI = traumatic brain injury; WAIS-III = Wechsler Adult Intelligence Scale-III; WMS-III = Wechsler Memory Scale-III.
a Age corrected index.
DISCUSSION
The results of this study indicated that in individuals with 7 to 12 years of education, the application of demographic corrections for WAIS-III and WMS-III indices did not improve diagnostic efficiency in a clinical moderate to severe TBI sample compared with that produced by age corrected indices. Overall classification rates were 77% for age corrected and 74% for demographically corrected WAIS-III and WMS-III prediction equations. The single index that best classified the groups was the Processing Speed Index (PSI). Classification rates for PSI were slightly lower but not significantly different from that of prediction equations modeled on all indices; those rates were 70% for age corrected PSI and 70.5% for demographically corrected PSI. These statistics were calculated on a base rate of 50% for TBI in comparison to matched standardization data controls. Analysis of the TBI group data against a larger and unmatched control group confirmed the finding that the application of the demographically corrected indices did not improve diagnostic efficiency.
Application of impairment cut-scores of one, one-and-a-half, and two standard deviations below the mean were associated with increasingly higher levels of specificity and lower sensitivity. The cut-score of one standard deviation below the mean maximized sensitivity with little cost to specificity and this was consistent with findings for the WAIS-III and WMS-III indices reported by Heaton et al. (Reference Heaton, Taylor, Manly, Tulsky, Saklofske, Chelune, Heaton, Ivnik, Bornstein, Prifitera and Ledbetter2003). In clinical practice, knowledge of the diagnostic efficiency statistics for various score ranges as provided in Table 6 allows increased confidence about the presence of impairment for an individual with a lower score. Multiple likelihood ratios, as provided in this table, are of particular benefit as they summarise all other diagnostic efficiency statistics and indicate the extent to which the probability of impairment is increased for specific score ranges (Grimes & Schulz, Reference Grimes and Schulz2005; Strauss et al., Reference Strauss, Richardson, Glasziou and Haynes2005).
Although the classification rates for demographically corrected and age corrected indices were not significantly different, this research supports the importance of taking educational background into account when analyzing WAIS-III and WMS-III performances in moderate to severe TBI. Without the demographic corrections, all WAIS-III and most WMS-III index scores were significantly correlated with education, despite the restricted range of 7 to 12 years education. In addition, classification rates were maximized with a cut-score of 87 for age corrected PSI as opposed to a cut-score of 95 for demographically corrected PSI, a difference of approximately half of one standard deviation. This difference was also reflected in the cut-scores based on standard deviations below the mean, for example, one standard deviation below the mean was 82 for age corrected PSI and 87 for demographically corrected PSI. The effects of correcting for demographic factors were greatest for those with the lowest levels of education, that is, 7 or 8 years of schooling, particularly for WAIS-III Verbal Comprehension and Processing Speed. For those with 12 years education—the average for the standardization sample, the demographically corrected scores were little different from age corrected scores. This underlines the issue that in clinical or medico legal practice, where scores are not corrected for education, those individuals with lower levels of education are more likely to be falsely classified as impaired (Heaton et al., Reference Heaton, Taylor, Manly, Tulsky, Saklofske, Chelune, Heaton, Ivnik, Bornstein, Prifitera and Ledbetter2003).
The current findings were consistent with the results of previous research (Blake et al., Reference Blake, Fichtenberg and Abeare2009; Strong et al., Reference Strong, Donders and Van Dyke2005) in indicating that demographically corrected indices do not increase diagnostic efficiency in TBI relative to age corrected indices. While earlier studies examined only WAIS-III measures and comprised individuals with higher levels of education, the current study extended those findings with a larger sample with limited levels of education and with the addition of WMS-III indices. The diagnostic efficiency statistics for combined WAIS-III and WMS-III indices in the current study were consistent with those of earlier research in TBI in terms of classification rates for WAIS-III indices (Strong et al., Reference Strong, Donders and Van Dyke2005) and areas under the receiver operating curve (Blake et al., Reference Blake, Fichtenberg and Abeare2009). Group classification rates were lower than those obtained for the TBI group that was included as part of the development of the WAIS-III and WMS-III, where sensitivity was 90.5% and specificity 85% (Taylor & Heaton, Reference Taylor and Heaton2001). However, the generalizability of that finding may be limited given small numbers (n = 21) and possibly an unrepresentatively severe TBI sample. With respect to the latter issue, PSI scores for that group averaged 73.4 (Fisher et al., Reference Fisher, Ledbetter, Cohen, Marmor and Tulsky2000), compared with 83.2 in the current study and in other research, 80.1 for an extremely severe TBI group with PTA of more than 28 days (Langeluddecke & Lucas, Reference Langeluddecke and Lucas2003).
TBI participants performed significantly lower on all WAIS-III and WMS-III indices with the exception of Perceptual Organization; effect sizes were large particularly for PSI and Visual Memory indices and broadly consistent with those previously reported in a litigant sample (Langeluddecke & Lucas, Reference Langeluddecke and Lucas2003, Reference Langeluddecke and Lucas2005). Given that the diagnostic capabilities of the WAIS-III and WMS-III indices were somewhat modest despite the considerable group differences, these findings highlight the importance of reporting diagnostic efficiency statistics, as noted by Ivnik et al. (Reference Ivnik, Smith, Verhan, Boeve, Tangalos and Petersen2001), to enable evaluation of the test’s diagnostic usefulness.
This study has several limitations. The restricted range of 7 to 12 years education in this study may have reduced the effect of the demographic corrections; this was a product of the group available most of whom did not have tertiary education. Furthermore, there were few TBI individuals with 7 or 8 years of schooling, therefore, the lowest ranges of education were poorly represented and almost one-third of individuals had an average level of education. A second limitation is that the different ethnic compositions of U.S. and Australian populations precluded use of ethnicity as a demographic variable and for 12 individuals who were of diverse ethnic background, demographic norms were generated using the standardization data for “Whites.” In view of the considerable impact of cultural background on Wechsler scores (e.g., Carstairs, Myors, Shores, & Fogarty, Reference Carstairs, Myors, Shores and Fogarty2006; Heaton et al., Reference Heaton, Taylor, Manly, Tulsky, Saklofske, Chelune, Heaton, Ivnik, Bornstein, Prifitera and Ledbetter2003), the magnitude of the effects of demographic corrections may have increased if we had been able to include ethnicity. Yet the procedure that was followed reflects the application of demographic corrections outside North America in countries such as Australia and, therefore, parallels clinical practice. With respect to the comparability of TBI and control groups, there was no difference in years of education or sex, although the groups were not well matched on either variable, with the control group comprising more women and more individuals with the lowest levels of education. Moreover, the control group was significantly older. This age difference occurred because, in the standardization sample, those with less education tend to be older (Heaton et al., Reference Heaton, Taylor, Manly, Tulsky, Saklofske, Chelune, Heaton, Ivnik, Bornstein, Prifitera and Ledbetter2003), whereas our TBI participants with lower levels of education were younger adults. We prioritized matching by years of education and then sex over age, given that education was the demographic variable of most interest and all scores were adjusted for age. We would argue that the group difference in age did not compromise the validity of our results given that all scores were corrected for age and there was no association between age and index scores, with the exception of a positive correlation with demographically corrected PSI in controls only. Finally, it may be suggested that the demographically corrected indices did not improve group classification because between-group variance on demographic factors was reduced by matching the groups as much as possible on education, sex, and ethnicity. However, when the TBI group were compared with an unmatched control group, there was no difference in diagnostic efficiency statistics and education added little to the prediction of group membership compared with PSI, age, and sex; demonstrating that the failure to find an advantage for the demographically corrected indices was not an artifact of comparing matched groups.
These results suggest that, for mostly younger white individuals with lower levels of education, the demographic corrections for the WAIS-III and WMS-III do not provide an advantage in the classification of moderate to severe TBI over and above age corrected indices. However, when assessing individuals with lower levels of education, the criterion for impairment on age corrected indices would require adjustment downward whereas this is not necessary with the demographically corrected indices. With respect to overall classification accuracy, these findings indicate that the WAIS-III and WMS-III indices provide only modest diagnostic accuracy for moderate to severe TBI, with Processing Speed demonstrating higher sensitivity to TBI than other indices. Future research in this area aimed at improving the diagnostic efficiency of neuropsychological tests should include higher as well as lower education levels, control and clinical groups of diverse ethnic background and other measures, particularly tests of reasoning and problem solving, which are often affected in moderate to severe TBI (Bennett, Ong, & Ponsford, Reference Bennett, Ong and Ponsford2005; Busch, McBride, Curtiss, & Vanderploeg, Reference Busch, McBride, Curtiss and Vanderploeg2005; Fork et al., Reference Fork, Bartels, Ebert, Grubich, Synowitz and Wallesch2005). Finally, given the variability in level of recovery after moderate to severe TBI and the apparently intact neuropsychological performances of some individuals, future research should examine the diagnostic accuracy of neuropsychological tests with respect to good versus poor recovery post-TBI, where recovery is measured by objective functional outcome measures such as return to previous level of work or capacity to manage finances (Griffin, Reference Griffin2002).
ACKNOWLEDGMENTS
The information contained in this manuscript forms part of a doctoral thesis prepared by the first author. Preliminary data contained in this manuscript were presented as a poster at the Seventh World Congress on Brain Injury of the International Brain Injury Association, Lisbon, Portugal in April 2008. There are no financial or other potential conflicts of interest that pertain to this manuscript. This research was not associated with any sources of financial support.