

I. INTRODUCTION
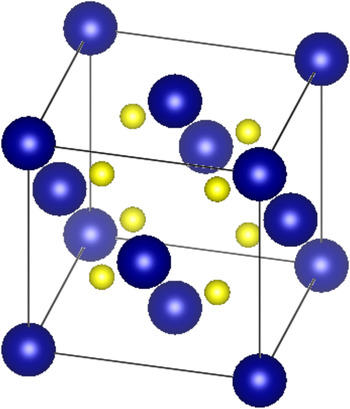
Uranium dioxide (UO2) is the most widely used fuel material for nuclear power reactors; its atomic structure is shown in Fig. 1. Upon exposure to neutrons, the uranium nuclei can fission resulting in the release of over 200 MeV of energy and the deposition of 170 MeV of energy directly in the fuel. Clearly, the fission process and its immediate consequences (including the creation of energetic heavy fission fragments) can be very disruptive of the fuel's atomic lattice and eventually will have significant ramifications on its integrity. Reference Matzke, Sickafus, Kotomin and Uberuaga1–Reference Wiss, Matzke, Trautman, Toulemonde and Klaummünzer9 However, in UO2, it has been observed that the disruptive consequences of fission are greatly mitigated especially when compared to other nuclear fuels such as uranium carbide (UC) and uranium nitride (UN). Reference Matzke, Sickafus, Kotomin and Uberuaga1–Reference Matsui, Horiki and Kirihara5
Uranium dioxide crystallizes into a fluorite structure (space group Fm-3m). Uranium atoms are blue (dark) and oxygen atoms are yellow (light). The atomic coordinates are (0,0,0) for uranium and (1/4,1/4,1/4) for oxygen, and the lattice parameter is 0.547 nm. Reference Ruello, Becker, Ullrich, Desgranges, Petot and Petot-Ervas10,Reference Momin, Mirz and Mathews11

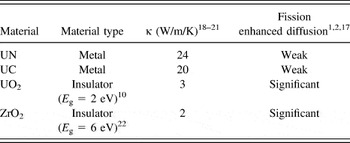
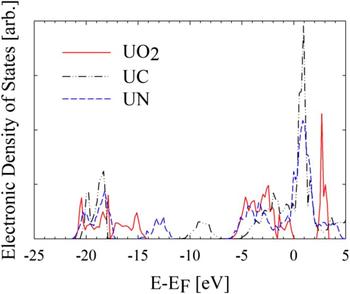
In this material, several experiments have revealed the possibility of inducing the mobility of the uranium atoms upon exposure to radiation. Reference Höh and Matzke12–Reference Dienst15 In particular, a diffusion-like behavior is observed upon the occurrence of fission in UO2. By contrast, the occurrence of fission in other uranium based fuel materials such as UN or UC is not observed to produce diffusional behavior of a similar magnitude. Reference Matzke, Sickafus, Kotomin and Uberuaga1,Reference Matzke2,Reference Höh and Matzke12–Reference Matzke16 This enhancement of uranium diffusion (upon fission) in UO2 can be linked to its electronic structure, which represents that of an insulator as opposed to the largely metallic character of UC and UN. Evidence of this link to electronic structure may be inferred from the correlation between fission enhanced diffusion and thermal conductivity for these materials, where thermal conductivity is also a property that has dependence on electronic structure. In fact, fission enhanced diffusion inferred from diffusion couple and creep measurements in a fission environment was found to become more pronounced in materials with lower thermal conductivities. Reference Matzke, Sickafus, Kotomin and Uberuaga1,Reference Matzke2,Reference Höh and Matzke12–Reference Dienst15 Table I illustrates the correlation between electronic structure, thermal conductivity, and fission enhanced diffusion coefficient of uranium for UN, UC, and UO2. In addition, data are listed for ZrO2, which represents another insulating material. Reference Béred, Chevarier, Moncoffre, Sainsot, Faust and Catalette17 By examination of the table, a trend emerges indicating greater diffusion enhancement during exposure to swift heavy ions (e.g., as a consequence of fission) in the case of the insulating materials in contrast to the metallic materials. The details of the electronic structure for UN, UC, and UO2 are illustrated in Fig. 2 using the electronic density of states.
Correlation of electronic structure to thermal conductivity and fission enhanced diffusion of uranium. For UO2 and ZrO2, the size of the band gap (E g) is given. The values of the thermal conductivities are listed for a temperature of 1000 °C.

Electronic structure of several nuclear fuel materials (UN, UC, and UO2) as obtained in this work through DFT calculations using the VASP code with the Perdew–Burke–Ernzerhof pseudopotentials, a generalized-gradient approximation for the exchange correlation, and the addition of a Hubbard model for UO2. Reference Blochl23–Reference Perdew, Burke and Ernzerhof28 The energy is referenced to the Fermi level, E F, the highest occupied energy level at zero kelvin. For UC and UN, the availability of states is continuous across the Fermi level, where as in UO2 a 2 eV band gap is observed.

In this work, the impact of electronic structure on fission enhanced diffusion in UO2 is examined using classical molecular dynamics (MD) simulations and by invoking the two temperature model (TTM) to describe the interaction between the electronic structure and the lattice.
II. MODELING AND SIMULATION APPROACH
Fission represents the initiating and driving event for the phenomenon examined in this work, i.e., the enhanced mobility of uranium in UO2. The fission process results in the production of two fission fragments with a total kinetic energy of approximately 170 MeV. Reference Nishio, Yamamoto, Kanno, Kimura and Nakagomeb29 High temperature fission spikes are caused by the deposition of fission fragment energy within the fuel matrix. Reference Matzke, Sickafus, Kotomin and Uberuaga1,Reference Matzke2,Reference Rochi and Wiss7–Reference Wiss, Matzke, Trautman, Toulemonde and Klaummünzer9,Reference Höh and Matzke12,Reference Matzke13 The initial deposition of energy in a material by fission fragments or other swift heavy ions (ions with energies > 1 MeV/amu) can be expressed by the stopping power,
 $${\left( { - {\mathop{\rm d}\nolimits} E/{\mathop{\rm d}\nolimits} x} \right)_{\rm{t}}} = {\left( { - {\mathop{\rm d}\nolimits} E/{\mathop{\rm d}\nolimits} x} \right)_{\rm{e}}} + {\left( { - {\mathop{\rm d}\nolimits} E/{\mathop{\rm d}\nolimits} x} \right)_{\rm{n}}} + {\left( { - {\mathop{\rm d}\nolimits} E/{\mathop{\rm d}\nolimits} x} \right)_{\rm{r}}}\quad {\rm{,}}$$
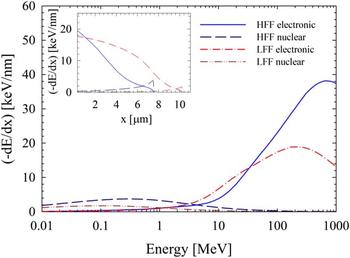
where (−dE/dx)t is the total energy loss per unit path length, (−dE/dx)e is the loss due to interactions between the fission fragment and electronic structure, (−dE/dx)n is the loss due to collisions with atomic nuclei, and (−dE/dx)r is the radiative loss. Radiative losses are a relativistic effect and are negligible for fission fragments. Typical fission fragments have stopping powers of 18 keV/nm (100 MeV) and 22 keV/nm (70 MeV) for light fission fragments (LFF) and heavy fission fragments (HFF), respectively. The relative contributions of the electronic and collisional components of stopping power for such typical LFF and HFF were determined using SRIM code calculations. Reference Ziegler, Ziegler and Biersack30 As it can be seen in Fig. 3, the electronic stopping power is the dominant mechanism of energy loss at high energies and is also dominant along most of the fission fragment path. As a result of the fission event and the energy deposition by the LFF and HFF, temperature and pressure spikes develop in the atomic lattice resulting in what is known as the “fission spike”. Reference Matzke, Sickafus, Kotomin and Uberuaga1 The observed dominance of electronic stopping along the path of a fission fragment implies that the primary component of a fission spike originates in the electronic structure. Consequently, simulating the fission spike and observing the evolution of its impact in a UO2 system following a fission event would be a reasonable starting point for the investigation of fission driven phenomena such as enhancement of the mobility of atomic species (e.g., uranium).
Electronic and nuclear stopping power of typical fission fragments calculated with the SRIM code. Reference Ziegler, Ziegler and Biersack30 The electronic stopping power is dominant for ion energies greater than 1–5 MeV. The inset illustrates the change in stopping power for the fission fragments as a function of its path length, x.

A. Fission spikes in UO2
A common model used to describe fission spikes in materials is the TTM. This model attempts to capture the energy exchange between the electronic and lattice systems through electron–phonon (e–p) scattering while explicitly treating energy transport within the electronic system, and may be used to describe the evolution of a fission spike with energy originating in the electronic system. Reference Lifshitz, Kaganov and Taratanov31–Reference Toulemonde, Assmann, Dufour, Meftah, Studer and Trautman41 The classical TTM assumes that the equilibrium concept of temperature applies and that electronic excitations behave with the characteristics of a free electron gas, which does not capture the energy dependence of electron behavior. Reference Lifshitz, Kaganov and Taratanov31–Reference Osmani, Medvedev, Schleberger and Rethfeld34,Reference Duffy, Daraszewicz and Mulroue38–Reference Klaumünzer40 Nonetheless, this model has been demonstrated to be a reasonable predictive tool in exploring the evolution of electronic excitations in atomic systems and will be used in this work as the basis for examining the fission–lattice interaction. Reference Wiss, Matzke, Trautman, Toulemonde and Klaummünzer9,Reference Toulemonde, Paumier and Dufour32,Reference Toulemonde, Dufour, Meftah and Paumier33,Reference Toulemonde, Assmann, Dufour, Meftah, Studer and Trautman41–Reference Huang, Schwen and Averback45 This model is described by the heat equations, Reference Lifshitz, Kaganov and Taratanov31–Reference Toulemonde, Dufour, Meftah and Paumier33
 $${{{\rho _{\rm{e}}}{C_{\rm{e}}}\partial {T_{\rm{e}}}} \mathord{\left/ {\vphantom {{{\rho _{\rm{e}}}{C_{\rm{e}}}\partial {T_{\rm{e}}}} {\partial t}}} \right. \kern-\nulldelimiterspace} {\partial t}} = \nabla \left( {{k_{\rm{e}}}\nabla {T_{\rm{e}}}} \right) - {g_{{\rm{ep}}}}\left( {{T_{\rm{e}}} - {T_{\rm{a}}}} \right) + B({\bf{r}},t) + {g_{\rm{s}}}T{\prime _{\rm{a}}}\quad {\rm{,}}$$
 $${{\rho C\left( {{T_{\rm{a}}}} \right)\partial {T_{\rm{a}}}} \mathord{\left/ {\vphantom {{\rho C\left( {{T_{\rm{a}}}} \right)\partial {T_{\rm{a}}}} {\partial t}}} \right. \kern-\nulldelimiterspace} {\partial t}} = \nabla \left( {k\left( {{T_{\rm{a}}}} \right)\nabla {T_{\rm{a}}}} \right) + {g_{{\rm{ep}}}}\left( {{T_{\rm{e}}} - {T_{\rm{a}}}} \right) - {g_{\rm{s}}}T{\prime _{\rm{a}}}\quad {\rm{,}}$$
where T e, T a, ρ, ρe, C e, C(T a), and k e, k(T a) are the temperature, particle number densities, specific heat, and thermal conductivities of the electronic and lattice system, respectively. The additional terms describe the initial energy injection into the electronic system, B(r,t), and the energy exchange between the electron and lattice systems through e–p coupling, g ep, and electronic stopping, g s.
In the initial stages of a fission spike, atoms may exceed a threshold velocity, corresponding to a temperature of
 $T{\prime _{\rm{a}}}$
, and suffer electronic energy loss described by an electronic stopping coupling factor, g
s. The initial energy injection into the electronic system, B(r,t), which is representative of the delta-ray dose resulting from a fission fragment, or other swift heavy ion, may be represented by an exponential function,
 $$B({\bf{r}},t) = {\left( {{{ - {\mathop{\rm d}\nolimits} E} \mathord{\left/ {\vphantom {{ - {\mathop{\rm d}\nolimits} E} {{\mathop{\rm d}\nolimits} x}}} \right. \kern-\nulldelimiterspace} {{\mathop{\rm d}\nolimits} x}}} \right)_{\rm{e}}}\pi N\exp \left( { - r/R} \right)\exp \left( {{{ - t} \mathord{\left/ {\vphantom {{ - t} {{t_{\rm{f}}}}}} \right. \kern-\nulldelimiterspace} {{t_{\rm{f}}}}}} \right)\quad {\rm{,}}$$
where (−dE/dx)e is the electronic stopping power and N is a normalization constant. The mean radius of delta-ray energy deposition, R, is dependent on the energy (MeV/amu) of an incident ion and may be estimated to be between 1 and 4 nm in UO2 for heavy ions of interest. Reference Toulemonde, Dufour, Meftah and Paumier33,Reference Waligorski, Hamm and Katz46 Delta rays slow down through electron scattering interactions and excite secondary electrons within a mean time of flight, t f, of approximately 5 femtoseconds (fs). Subsequently, these excitations quickly thermalize through e–p inelastic scattering within 10–1000 fs, transferring energy to the atomic lattice. This inelastic scattering process is described by the e–p coupling constant g ep, a parameter related to the e–p scattering cross-section. The energy exchange rate between electronic excitations and the atomic lattice may be described with the cross-section formalism,
 $${g_{{\rm{ep}}}}\Delta T = \left( {4\pi /\hbar } \right)\sum\limits_{k,k\prime } {{E_q}{{\left| {{M_{k,k\prime }}} \right|}^2}} S\left( {k,k\prime } \right)\delta \left( {E - {E_{k\prime }} + {E_q}} \right)\quad {\rm{,}}$$
where ΔT is the temperature difference between electronic excitations and the local atomic lattice, and k and q are the electron and phonon momentum, respectively. Reference Allen47 The scattering matrix M k,k ′ defines the probability of electrons scattering from state k to k′. The scattering of an electron from energy E k to energy E k ′ occurs by the emission or absorption of a phonon of energy E q ; a process described by S(k,k′). Equation (5) shows that the transition rate, the precursor to the scattering cross-section, of e–p interactions is correlated to a characteristic time between scattering events defined by the e–p coupling time, τep. Within the free electron gas approximation, the e–p coupling constant may be estimated in terms of an e–p coupling time as Reference Lifshitz, Kaganov and Taratanov31,Reference Toulemonde, Dufour, Meftah and Paumier33
 $${g_{{\rm{ep}}}} = {{{\rho _{\rm{e}}}{C_{\rm{e}}}} \mathord{\left/ {\vphantom {{{\rho _{\rm{e}}}{C_{\rm{e}}}} {{\tau _{{\rm{ep}}}}\quad {\rm{.}}}}} \right. \kern-\nulldelimiterspace} {{\tau _{{\rm{ep}}}}\quad {\rm{.}}}}$$
A free electron gas has an electronic heat capacity of 3/2k B, where k B is Boltzmann's constant. The specific heat, i.e., the product of density and heat capacity may be assumed to be characteristic of a noble metal with a value of approximately 106 J m−3 K−1. Reference Toulemonde, Dufour, Meftah and Paumier33 The electronic thermal conductivity, a description of energy transport, varies directly with the characteristic time between any electron scattering events. The dynamics of scattering in a nonequilibrium disruption resulting from fission is not well established, so in this work, both the thermal conductivity and e–p coupling time were treated as adjustable parameters. A free electron gas in a metal is estimated to have a thermal conductivity and electron phonon coupling time of approximately 200 W m−1 K−1 and 1000 fs, respectively. Therefore, decreasing e–p coupling times and thermal conductivity are indicators of increasing insulator character. For UO2, a Mott–Hubbard insulator, a thermal conductivity of nearly 20 W m−1 K−1, and an e–p coupling constant within the range of 100–300 fs were used in the simulation of heavy ion spike evolution.
The transfer of energy to the atomic lattice by e–p coupling results in the development of a thermal spike composed of a central melted core surrounded by a heated zone; a phenomenon which is expected to be enhanced in insulators in comparison to metals. Reference Matzke, Sickafus, Kotomin and Uberuaga1,Reference Matzke2,Reference Höh and Matzke12,Reference Avasthi and Metha35 In addition, the thermal spike and its associated pressure spike are expected to enhance atomic mobility in the vicinity of the fission fragment path. Reference Matzke, Sickafus, Kotomin and Uberuaga1,Reference Matzke2,Reference Rochi and Wiss7,Reference Rochi8,Reference Höh and Matzke12,Reference Matzke13 Experimentally, this enhancement has been quantified by measurement of the diffusion coefficient, which was found to be athermal and greater than the thermally activated coefficient. Reference Höh and Matzke12–Reference Matzke16
B. MD model of UO2
Classical MD was used in this work to explore ion track formation and fission enhanced diffusion in UO2. The interactions between atoms were described by a Coulomb–Buckingham interatomic potential,
 $${V_{ij}} = {A_{ij}}\exp \left( {{{ - r} \mathord{\left/ {\vphantom {{ - r} {{\rho _{ij}}}}} \right. \kern-\nulldelimiterspace} {{\rho _{ij}}}}} \right) - {{{C_{ij}}} \mathord{\left/ {\vphantom {{{C_{ij}}} {\mathop {{{\bf{r}}_{ij}}}\nolimits^6 }}} \right. \kern-\nulldelimiterspace} {\mathop {{r_{ij}}}\nolimits^6 }} - \left( {{1 \mathord{\left/ {\vphantom {1 {4\pi {\varepsilon _0}}}} \right. \kern-\nulldelimiterspace} {4\pi {\varepsilon _0}}}} \right)\left( {{{{Z_i}{Z_j}} \mathord{\left/ {\vphantom {{{Z_i}{Z_j}} {{r_{ij}}}}} \right. \kern-\nulldelimiterspace} {{r_{ij}}}}} \right)\quad {\rm{,}}$$
with parameters determined in previous work. Reference Harp48 The potential parameters were tuned to provide reasonable agreement with lattice expansion, bulk modulus, and thermal conductivity. The MD simulations in this work were performed on a GPU cluster using the LAMMPS code, which utilizes the particle–particle particle-mesh (PPPM) method for treating the long-ranged coulomb interactions between atoms. Reference Plimpton49,Reference Plimpton, Pollock and Stevens50 Fission spikes resulting from electronic stopping were modeled in a 10 × 60 × 60 supercell, 432,000 atoms, representing a cross-section perpendicular to the fission fragment trajectory. Prior to the simulation of a fission spike, the supercell was relaxed under an NVE thermostat (i.e., microcanonical ensemble) with a Langevin bath outside of a cylinder with a radius of 28 unit-cell lengths. This bath was also used in simulations of fission spikes and was found to be sufficiently large to capture the thermal spike phenomena.
In the current MD-TTM simulations of fission spikes and ion spikes, the electronic subsystem was treated using the continuum model formulated in Eq. (2), and used a stochastic force to capture the energy exchange between the atomic and electronic subsystems. Reference Caro and Victoria36,Reference Duffy and Rutherford37 The electronic subsystem was composed of 10 × 60 × 60 finite element cells and contained a bath with the same temperature and dimensions as that for the atomic lattice. To capture the changing time scales of the phenomenological development of fission and ion spikes, the time steps were varied from 10 attoseconds (as) at the initial injection of electronic energy to 1 fs during the quenching of the resulting thermal spike, which leads to track formation for swift heavy ions.
The study of fission-enhanced diffusion required a formalism with which to quantify the diffusion coefficient. Within an MD construct, an appropriate fission enhanced diffusion coefficient may be derived from the Einstein relation for the thermally activated self-diffusion,
 $${D_n} = \mathop {\lim }\limits_{t \to \infty } \left( {1/N} \right)\sum\limits_{i \in n} {{{\left\langle {{{\left[ {{{\bf{r}}_i}(t) - {{\bf{r}}_i}(0)} \right]}^2}} \right\rangle } \mathord{\left/ {\vphantom {{\left\langle {{{\left[ {{r_i}(t) - {r_i}(0)} \right]}^2}} \right\rangle } {6t}}} \right. \kern-\nulldelimiterspace} {6t}}\quad {\rm{,}}}$$
where r i is the position of an atom and N is the number of atoms of species n in the volume of interest. Fission energy affects a fixed volume at an average frequency proportional to the fission-rate-density. Following the passage of a fission fragment, a thermal spike permits enhanced mobility of atoms for a finite period, around 10−11 s, which is much less than the period between fission events within the affected volume. Enhanced mobility prompted by a fission spike may therefore be treated as a diffusion process resulting from instantaneous discrete “jumps”, with an effective diffusion coefficient proportional to the mean frequency of fission events. Consequently, the fission enhanced diffusion coefficient for an atomic species n may be expressed as
 $$D_n^ * = A \cdot F\quad {\rm{,}}$$
 $$A = \left( {1/6N} \right)\left( {\sum\limits_{i \in n} {\left\langle {{{\left[ {{{\bf{r}}_i}(t + \tau ) - {{\bf{r}}_i}(t\prime \prime )} \right]}^2}} \right\rangle } - \sum\limits_{i \in n} {\left\langle {{{\left[ {{{\bf{r}}_i}(t + t\prime + \tau ) - {{\bf{r}}_i}(t\prime + \tau )} \right]}^2}} \right\rangle } } \right) \cdot {V_0}\quad {\rm{,}}$$
where A is a linear coefficient, V 0 is any arbitrary volume encompassing the energy deposition of a single fission event, i.e., both LFF and HFF, F is the fission-rate-density, and τ is the duration of the thermal spike. In Eq. (10), the difference in mean squared displacement resulting from fission and thermal motion is calculated. Time averages are over all time t and t′ greater than zero, and over all time origins tʺ less than zero, where time zero is the initiation of a thermal spike. For the purposes of studying the impact of electronic behavior of fission enhanced diffusion in nuclear fuel, the diffusivity of uranium is of interest. The impact of these changes in electronic behavior on fission enhanced diffusion is examined by measuring the linear coefficient A at temperatures between 300 and 1373 K while varying the e–p coupling time.
III. RESULTS AND DISCUSSION
The evolution of atomic mobility during a fission spike may be characterized by three phenomenological phases: Ballistic, quenching, and annealing. Reference Matzke, Sickafus, Kotomin and Uberuaga1 The ballistic phase is characterized by high density cascades. The quenching phase occurs as the electronic and atomic systems approach equilibrium resulting in the formation of high vacancy and interstitial regions. The final, annealing phase, may be identified by the recombination of vacancies and interstitials. The consequence of fission damage following the annealing phase is either the emergence or absence of a latent track. These latent tracks may be defined as stable, disordered regions along the fission fragment trajectory. Fission fragments of stopping powers between 18 and 22 keV/nm are not known to create tracks in bulk UO2; however, swift heavy ions of stopping powers greater than 29 keV/nm have been found to cause latent tracks in UO2. Reference Matzke, Lucuta and Wiss6,Reference Wiss, Matzke, Trautman, Toulemonde and Klaummünzer9
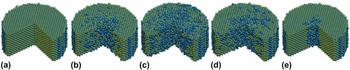
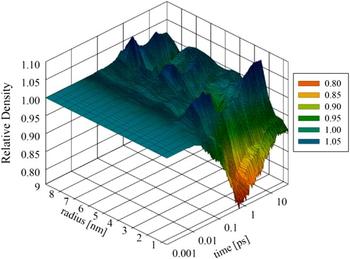
The phenomenological evolution of a fission spike, simulated using MD-TTM, is illustrated in Fig. 4. The corresponding changes in uranium density due to a fission spike are shown in Fig. 5. The density was calculated within 1 nm thick shells around the initial fission spike center. At approximately 20 ps, the fission spike has subsided, and the relative density outside a radius of approximately 3 nm has been restored to the initial level. However, as expected for a track, the vacancy rich zone developed during the quenching phase does not fully anneal, resulting in a vacancy rich core within the track. The high density zone encompassing the vacancy rich zone is the interstitial zone; however, the density increase may be partially explained by residual stress within the track, which will be explained below.
Evolution of 29 keV/nm thermal spike in a simulated insulator-like system with a τep of 150 fs. The fission spike time progression from left to right is (a) original crystal, (b) ballistic phase, (c) quenching phase, (d) annealing phase, and (e) latent track. Uranium atoms are blue (dark) and oxygen atoms are yellow (light).

Evolution of relative uranium density resulting from a 29 keV/nm thermal spike in a simulated insulator-like system with a τep of 150 fs. The relative density is referenced to the initial density within each zone.

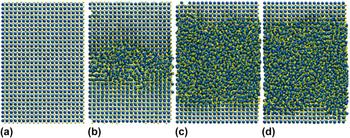
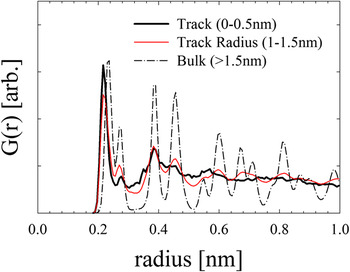
Latent ion tracks are structural disruptions that may be observed visually in MD simulation, as demonstrated in Fig. 6; however, quantitative estimation of an ion track size is also accessible in MD. Pair-correlation functions measure the atomic structure of a system and were used in this work to determine the size of a track. Estimates of the pair-correlations within 0.5 nm thick cylindrical shells centered about simulated fission fragment or heavy ion trajectory demonstrated either disordered or structured character corresponding to track or nontrack behavior, respectively. A transition region exists between the amorphous and structured zones in which some structure has re-emerged but the lattice is not yet completely distinguishable. The track radius was defined to be the mean radius within this transition region. The transition between track and structured regions after the annealing phase of a 29 keV/nm thermal spike in an insulator-like system at 300 K with a 150 fs e–p coupling time and thermal conductivity of 20 W m−1 K−1 is shown in Fig. 7.
(a) Pristine crystal and latent tracks resulting from (b) 29 keV/nm, (c) 56 keV/nm, and (d) 59 keV/nm thermal spike in an insulator-like system with a τep of 150 fs. Uranium atoms are blue (dark) and oxygen atoms are yellow (light).

Pair-correlation function, G(r), for a simulated 29 keV/nm ion track in a system with a τep of 150 fs and k e of 20 W m−1 K−1. The pair correlation functions were measured within 0.5 nm thick cylindrical zones centered about the simulated particle trajectory. The cylindrical zone for each illustrated pair correlation is shown.

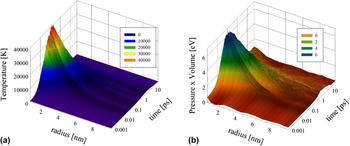
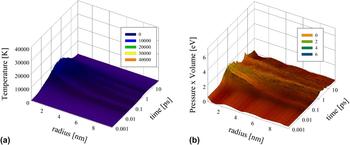
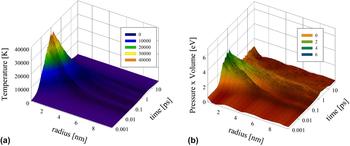
As discussed above, the evolution of a fission spike leading to a track may be characterized by a thermal spike in which the lattice temperature rises promptly due to the rapid deposition of electronic energy to the lattice system and subsequently decays by phonon transport. The sudden expansion of the hot inner core of the fission spike may result in a pressure spike in addition to the temperature spike. The temperature and associated pressure spikes, as demonstrated in Figs. 8–10, are expected to become more pronounced with decreasing e–p coupling time. Increasing metallic behavior, i.e., weaker e–p coupling, and decreasing electronic stopping power are observed to result in a less pronounced thermal spike and associated pressure spike. Latent tracks, as indicated in Fig. 8(b), or oxygen defect clusters in the case of fission fragments are observed to possess residual stress energy which exerts pressure on the surrounding bulk crystal.
(a) Temperature and (b) pressure spikes for a simulated 29 keV/nm ion in an UO2 system with a τep of 150 fs. The temperature distributions illustrate the rapid increase in lattice energy in a thermal spike followed by a slower quenching of heat from a molten zone. The pressure spikes are shown as stress energy, pressure × volume, illustrating the development and decay of a pressure gradient. A stress zone may be observed around the latent track, which has a radius of 1.2 nm.

(a) Temperature and (b) pressure spikes for a simulated 29 keV/nm ion in an UO2 system with a τep of 1000 fs.

(a) Temperature and (b) pressure spikes for a simulated 22 keV/nm fission fragment in an UO2 system with a τep of 150 fs. While no track was observed for fission fragments, a stress zone from oxygen defect clusters may be observed near the simulated fission fragment path.

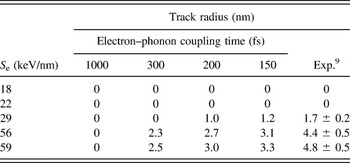
The track radii predicted by MD-TTM for a range of stopping powers and for various e–p coupling times are compared to experiment in Table II. The existence of each track was verified by visual observation of the MD supercell following the simulated irradiation. Although tracks were not observed at energies simulating fission fragments (i.e., 18 and 22 keV/nm), oxygen defect clusters were observed near the fragment path, which is consistent with predictions. Reference Rochi and Wiss7,Reference Pakarinen, He, Gupta, Gan, Nelson, El-Azab and Allen51,Reference He, Pakarinen, Gan, Nelson, Bai, El-Azab and Allen52 The minimum possible track radius was assumed to be one unit cell length as this is the approximate size above which amorphization of a zone may be observed. The transition between disorder and order causes some ambiguity in the track radii such that all track radii predicted using MD-TTM in this work may be bound with an estimated uncertainty of half a UO2 cell length (±0.3 nm). Variation in the e–p coupling time demonstrates that increasing coupling strength results in larger track radius. The track radii predicted ions of the same stopping power have reasonable agreement with experiment within the previously determined range of e–p coupling times. Reference Matzke, Lucuta and Wiss6,Reference Wiss, Matzke, Trautman, Toulemonde and Klaummünzer9 Specifically, a coupling time of 150 fs has reasonable agreement with predicted track radii and is within reasonable proximity to the predicted value of 180 fs for UO2 based on a correlation between coupling and band gap. Reference Toulemonde, Dufour, Meftah and Paumier33
Track radius for various electronic stopping powers and e–p coupling times. The MD-TTM electronic system had a 20 W m−1 K−1 conductivity for all τep. The experimental data are 173 MeV (29 keV/nm) Xe ions, 1300 MeV (56 keV/nm) uranium ions, and 2713 MeV (59 keV/nm) uranium ions in UO2. Fission fragments of stopping powers between 18 and 22 keV/nm have been found to not form tracks in bulk UO2. Reference Wiss, Matzke, Trautman, Toulemonde and Klaummünzer9 MD results have an estimated uncertainty of approximately ±0.3 nm.

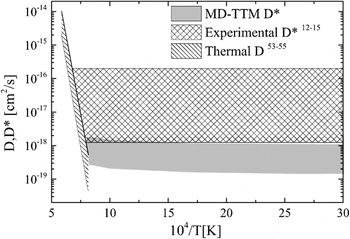
Although fission fragments do not cause tracks in bulk UO2, they do induce atomic mobility, i.e., diffusion. Fission enhanced diffusion of uranium in UO2 resulting from electronic energy deposition over a range of temperatures was calculated using the results of the MD-TTM simulations and Eqs. (9) and (10). The resulting diffusion coefficient (D*) is shown in Fig. 11. Reference Höh and Matzke12–Reference Dienst15 Experimental data are also shown in the figure. The MD-TTM predicted range corresponds to atomic systems with 0–5% porosity and an electronic system with a 150 fs e–p coupling time and a thermal conductivity of 20 W m−1 K−1. However, independent of porosity, the predicted D* is found to exhibit an athermal trend, which is consistent with the anticipated physical behavior and the experimental observations. In addition, it is significantly larger than the “extrapolated” thermal diffusion coefficient (D), which is expected to be smaller by orders of magnitude depending on temperature. Reference Matzke53–Reference Sabioni, Ferraz and Millot55 Moreover, the contribution to D* from nuclear stopping is on the order of 10−20 cm2/s for a fission rate density of 1013 cm−3 s−1, which is much less than the estimated electronic stopping contribution. The contribution to the fission enhanced diffusion coefficient of uranium in UO2 from nuclear stopping is expected to be on the order 10−20 cm2/s for a fission rate density of 1013 cm−3 s−1, which is much less than the estimated electronic stopping contribution. Reference Höh and Matzke12,Reference Matzke13 This further suggests that in UO2 the observed enhancement of uranium mobility is due to the interaction between the excitation of the electronic system and the lattice.
Fission-enhanced diffusion coefficient for a fission rate density of 1013 cm−3 s−1. The MD-TTM range is for a 0–5% porous system with a τep of 150 fs.

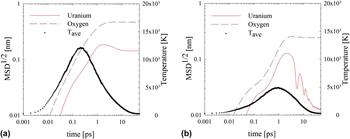
The impact of the e–p coupling strength on fission enhanced mobility was examined in a pristine, nonporous system. Fission enhanced diffusion of uranium in UO2, like track radius, was found to vary with e–p coupling time. The evolution of the diffusion process is illustrated in Fig. 12 for e–p coupling times of 150 and 1000 fs. The mean squared displacement is observed to evolve after the electronic and atomic systems have equilibrated, consistent with the characteristics suggested for the annealing phase in which mobile interstitial atoms recombine with vacancies within the fission spike core. As in thermal diffusion the displacement of oxygen through fission enhanced diffusion is much greater than that of uranium. The displacement of both atom types is more pronounced as e–p coupling strength increases (i.e., τep decreases).
Atomic displacement for uranium and oxygen resulting from a 22 keV/nm fission spike in a UO2 system with a τep of (a) 150 fs and (b) 1000 fs. The atomic displacements and average temperature, T ave, were calculated within a 6 nm radius of the simulated fission fragment path.

This trend of increasing mobility with lower e–p coupling time, i.e., greater coupling strength, may also be observed through the fission enhanced diffusion coefficient, as defined in Eqs. (9) and (10) and shown in the relationships below. Due to the variation in electronic stopping power along the trajectory of fission fragments, a range of possible values was determined for the present work. The upper limit for this range was estimated assuming that the electronic stopping power of a fission fragment is constant for the entire range. The lower limit was determined by assuming that electronic energy deposition results in increased diffusivity of uranium for the 2–3 µm of the fission fragment range in which electronic stopping power is approximately constant.
 $$1.4 \times {10^{ - 32}}{\rm{c}}{{\rm{m}}^5} \cdot F \lt {D^*} \lt 5.2 \times {10^{ - 32}}{\rm{c}}{{\rm{m}}^5} \cdot F{\rm{;}}\;{\tau _{{\rm{ep}}}} = 150{\rm{\ fs}}\quad {\rm{,}}$$
 $$1.1 \times {10^{ - 32}}{\rm{c}}{{\rm{m}}^5} \cdot F \lt {D^*} \lt 4.4 \times {10^{ - 32}}{\rm{c}}{{\rm{m}}^5} \cdot F{\rm{;}}\;{\tau _{{\rm{ep}}}} = 200{\rm{\ fs}}\quad {\rm{,}}$$
 $$7.8 \times {10^{ - 33}}{\rm{c}}{{\rm{m}}^5} \cdot F \lt {D^*} \lt 2.4 \times {10^{ - 32}}{\rm{c}}{{\rm{m}}^5} \cdot F{\rm{;}}\;{\tau _{{\rm{ep}}}} = 300{\rm{\ fs}}\quad {\rm{,}}$$
 $$2.6 \times {10^{ - 34}}{\rm{c}}{{\rm{m}}^5} \cdot F \lt {D^*} \lt 9.8 \times {10^{ - 34}}{\rm{c}}{{\rm{m}}^5} \cdot F{\rm{;}}\;{\tau _{{\rm{ep}}}} = 1000{\rm{\ fs}}\quad {\rm{.}}$$
Consequently, the above relationships show that for an insulator-like system (strong e–p coupling and low electronic thermal conductivity) the uranium diffusivity is enhanced significantly beyond that in a metal-like system (with weak e–p coupling and high electronic thermal conductivity).
IV. CONCLUSIONS
The effect of e–p coupling on fission-enhanced diffusion in UO2 was examined using MD-TTM. Initially, the MD-TTM model of UO2 was utilized to simulate the creation of ion tracks by fission fragments and other heavy ions. Reasonable agreement with experiment was found for the observed track radius as a function of the electronic stopping for an e–p coupling time of 150 fs. Subsequently, the model was used to study fission enhanced diffusion in UO2. In this case, it was found that the diffusion coefficient (D*) is athermal and in reasonable agreement with experimental trends. Furthermore, D* was found to become more pronounced as the electronic system behavior was varied from metal-like to insulator-like. The enhanced diffusivity of uranium in UO2, which promotes greater defect recovery than in other fuel types, Reference Matzke, Sickafus, Kotomin and Uberuaga1 may be attributed to the stronger e–p coupling in this type of fuel.