I. INTRODUCTION
Very high cycle fatigue (VHCF) that is generally recognized as the field of fatigue damage in the life regime larger than 107 cycles has become a subject of growing interest in recent years.Reference Bathias1–Reference Bandara, Siriwardane, Dissanayake and Dissanayake3 This is motivated from both fundamental and practical considerations. First, unexpected fatigue failures in the VHCF regime are continuously reported in metals, such as titanium alloys,Reference McEvily, Nakamura, Oguma, Yamashita, Matsunaga and Endo4,Reference Oguma and Nakamura5 aluminum alloys,Reference Tschegg-Stanzl and Mayer6,Reference Meischel, Tschegg-Stanzl, Arcari, Iyyer, Apetre and Phan7 high strength steels,Reference Mayer, Haydn, Schuller, Issler, Furtner and Bacher-Hochst8,Reference Li, Sakai, Li and Wang9 cast iron,Reference Zhang, Song, Zhang, Lu, Zhang and Cui10 etc., that are assumed to be operating at safe stresses below the traditional fatigue limit corresponding to around 107 cycles. Then, more and more components or parts have to be subjected to cyclic load, and the actual number of loading cycles is much larger than 107 cycles in practical engineering applications.Reference Matsunaga, Sun, Hong and Murakami11,Reference Bacher-Hoechst and Issler12 Thus, these requirements motivate the substantial efforts and thinking, concerning the fundamental fatigue mechanisms of metals in the VHCF regime.
The VHCF of metals is always accompanied by the change of failure mode from the surface failure at higher stress level to the subsurface or interior failure at lower stress level.Reference Bathias1–Reference Oguma and Nakamura5,Reference Mayer, Haydn, Schuller, Issler, Furtner and Bacher-Hochst8–Reference Bacher-Hoechst and Issler12 Just because of the change in the failure mode, metals sometimes can represent peculiar S–N curve characteristics such as “duplex S–N curve characteristics” or “step-wise S–N curve characteristics”Reference Sakai, Takeda, Shiozawa, Ochi, Nakajima and Nakamura13,Reference Shiozawa, Lu and Ishihara14 in the whole life regime involving low cycle, high cycle, and very high cycle. Also, studies have shown that not only face-centered cubic metalsReference Tschegg-Stanzl and Mayer6,Reference Meischel, Tschegg-Stanzl, Arcari, Iyyer, Apetre and Phan7 but also some body-centered cubic metalsReference Oguma and Nakamura5,Reference Mayer, Haydn, Schuller, Issler, Furtner and Bacher-Hochst8,Reference Li, Sakai, Li and Wang9,Reference Sakai, Takeda, Shiozawa, Ochi, Nakajima and Nakamura13,Reference Shiozawa, Lu and Ishihara14 show a decreasing fatigue strength in the VHCF regime. This means that the traditional standards and criteria about body-centered cubic metals often having a fatigue limit after about 107 cycles are inexact. Although the essence of this special S–N curve property in the VHCF regime is not yet well understood, it can conclude that a number of factors such as the size,Reference Makino15 type and distributionReference Pyttel, Brunner, Schwerdt and Berger16 of metallurgical defects or discontinuities, the specimen size,Reference Bach, Höppel, Bitzek and Göken17 the machining condition,Reference Itoga, Tokaji, Nakajima and Ko18 the loading type,Reference Li, Sakai, Li, Lu and Wang19 the environment,Reference Pérez-Mora, Palin-Luc, Bathias and Paris20 etc., can have a great impact on it.
As one of the typical characteristics of VHCF, the interior failure is mainly induced from the interior impurities or defects contained in materials, such as nonmetallic inclusions,Reference Oguma and Nakamura5,Reference Sakai, Takeda, Shiozawa, Ochi, Nakajima and Nakamura13,Reference Shiozawa, Lu and Ishihara14 secondary particles,Reference Shiozawa, Murai, Shimatani and Yoshimoto21 and some microstructural inhomogeneities.Reference Yu, Gu, Bai, Liu and Li22,Reference Xu, Yu, Cui, Bai and Gu23 Differing from alloy steels, the interior crack initiation for titanium alloys mainly results from microstructural inhomogeneities including primary α grains or α–β interfaces, often accompanying with the existence of some facets that are broken in a planer manner.Reference McEvily, Nakamura, Oguma, Yamashita, Matsunaga and Endo4,Reference Oguma and Nakamura5 From the aspect of mechanics, Lutjering et al. believed that the interior crack initiation is resulted from the interior tensile stress caused by the surface residual compressive stress.Reference Lutjering and Gysler24 Nagai et al. stated that the microcrack initiation and growth caused by the stress concentration associated with interior local deformation should be responsible for the interior failure process.Reference Nagai, Umezawa, Yuri and Ishikawa25 Neal et al. proposed that the interior failure is the result of cleavage of an α grain due to the local high stress caused by the dislocation pile-up mechanism at the grain boundary.Reference Neal and Blenkinsop26 Based on the stress–strain relation controlled by the gage element, Hack et al. pointed out that the brittle hydride related to hydrogen diffusion leads to the interior crack initiation.Reference Hack and Leverant27 Indeed at α–β interfaces, higher hydrogen contents are measured for some titanium alloys.Reference Evans, Bache, Froes and Caplan28 According to the different mechanical properties among particles, Bache proposed that the strain disharmony between strong particles and weak particles plays a key role in the interior crack initiation process.Reference Bache29 Furthermore, with respect to the formation of facets, the debate mainly focuses on the cleavage-induced fracture versus the slip-induced fracture. Some researchers conclude that the facets are induced by quasi-cleavage across the basal plane promoted by slip in a neighboring grain, and the plane of the facet is normal to the loading axis.Reference McEvily, Nakamura, Oguma, Yamashita, Matsunaga and Endo4,Reference Neal and Blenkinsop26,Reference Jha and Chandran30 Conversely, some researchers propose that the facets are resulted from the dislocation slip through base plane, and the combined action of shear deformation and normal force is the key factor.Reference Oguma and Nakamura5,Reference Steele and McEvily31–Reference Bridier, Villechaise and Mendez33 In General, the interior failure mechanisms of titanium alloys are not yet well understood, and further study is needed.
In this study, the high cycle fatigue and VHCF properties of a titanium alloy are experimentally investigated under two stress ratios. Based on the analysis of S–N curve properties, the observation of two and three-dimensional fracture morphologies, the discussion of characteristic crack size and the evaluation of driving force at the crack tip, and the crack initiation and early growth mechanisms of the titanium alloy in the VHCF regime were elucidated.
II. EXPERIMENTAL PROCEDURES
A. Materials and specimens
The investigated material in this study is a commercial TC4 titanium alloy, and its chemical composition (mass percentage) is 0.3 Fe, 0.1 C, 0.05 N, 0.015 H, 0.2 O, 6.1 Al, 4.0 V, Bai Ti. From the round bar with a diameter of 16 mm, specimens were first machined into the shape of hourglass with a certain amount of finishing margin, and then grinded in a direction perpendicular to the axis of the specimen by the grades 600–2000 abrasive paper to final shape.Reference Li, Sakai, Li, Lu and Wang19 The minimum diameter and round-notched radius of the specimen are 4 mm and 36 mm, respectively. Based on the stress concentration handbook,Reference Peterson34 the stress concentration factor of the specimen is evaluated to be about 1.02.
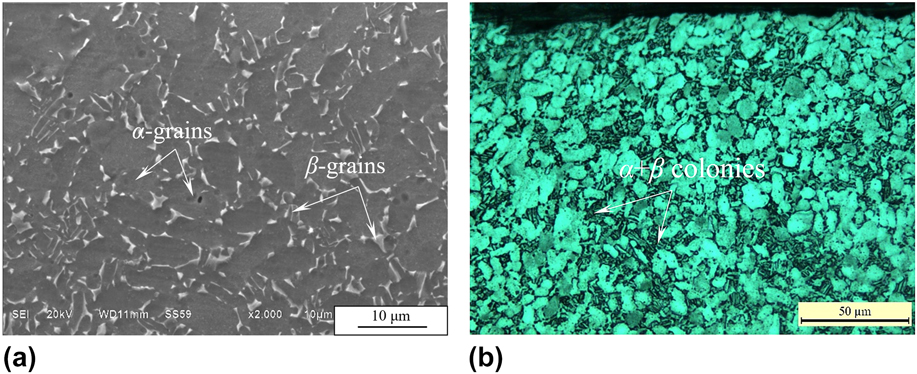
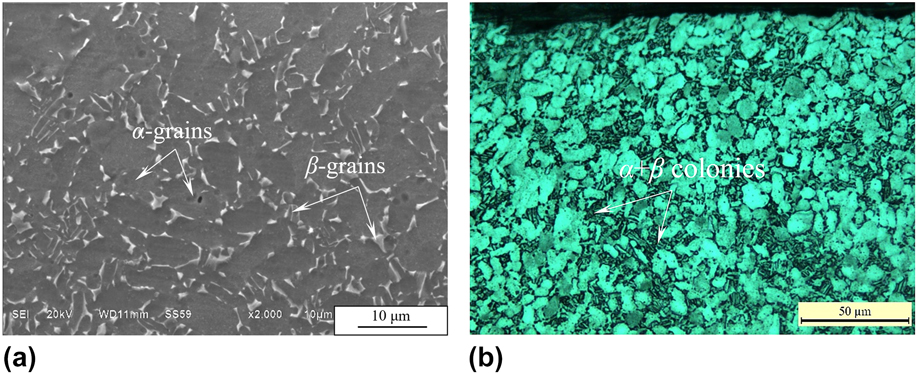
By grinding and polishing, then etching in Kroll solution, the microstructure of the TC4 titanium alloy was observed by using scanning electron microscopy (SEM) and optical microscope (OM), as shown in Figs. 1(a) and 1(b), respectively. From these figures, it can be found that the TC4 titanium alloy has the duplex microstructure consisting of equiaxed primary α-grains and α + β Widmanstatten colonies where fine β-grains are located at α-grain boundaries. Generally, it is known that the α-grain has the hexagonal-close-packed structure and the β-grain has the body-centered-cubic structure. By contrast, the α-grain is relatively soft. Based on the monotonic tensile test, moreover, the measured tensile strength σb, yield strength σs, and Young’s modulus E are 1123, 980, and 110,000 MPa, respectively.
Duplex microstructure of the TC4 alloy: (a) SEM observation of the microstructure and (b) OM observation of the microstructure.
B. Fatigue testing method
The axial loading fatigue tests of the TC4 titanium alloy for the stress ratios R of −1 and 0.1 in the life regime of 104–109 cycles were performed by using an electromagnetic resonant fatigue testing machine with the testing frequency about 100 Hz. Fatigue tests were all carried out in an open environment at room temperature. After experiment, fracture surfaces of the tested specimens were observed by microscopy. First, the failure features concerning the crack nucleation site, crack morphologies for nucleation, and growth regions in a two-dimensional (2D) plane were analyzed by using SEM. Based on this and combining with the further observation of three-dimensional (3D) morphologies of typical crack nucleation and growth regions through the OM and LAMOS imaging analysis software, the crack initiation and early growth mechanisms of the TC4 titanium alloy in the VHCF regime were discussed in detail.
III. RESULTS AND DISCUSSION
A. S–N curve characteristics
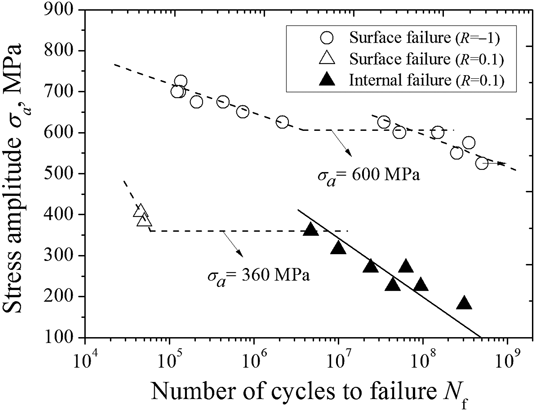
The S–N diagram associated with stress amplitude σa versus fatigue life N f for the TC4 titanium alloy under axial loading with two kinds of stress ratios (R = −1 and 0.1) in the life regime of 104–109 cycles is shown in Fig. 2. Based on the initial SEM observation of the crack initiation site, fatigue failures of specimens under R = 0.1 have two modes: surface failure and interior failure. The surface failure mainly occurs at the high stress region with short life below 105 cycles, whereas the interior failure mainly occurs at the low stress region with long life beyond about 5 × 10⁶ cycles. Obviously, under R = 0.1, the interior failure becomes the dominant failure mode of the TC4 titanium alloy in the VHCF regime. Moreover, it can be seen from the figure that the separation of S–N data corresponding to these two failure modes is very clear. Under this circumstance, it can be considered that the TC4 titanium alloy exhibits the so-called duplex S–N curve characteristics, just like the results of some alloy steels.Reference Li, Sakai, Li and Wang9,Reference Sakai, Takeda, Shiozawa, Ochi, Nakajima and Nakamura13,Reference Shiozawa, Lu and Ishihara14 Thus, herein, two S–N curves are plotted to represent S–N curve characteristics of the TC4 titanium alloy associated with the surface and interior failures under R = 0.1, indicated by dashed and solid lines in Fig. 2, respectively. Among them, for the surface failure, the horizontal part of the dashed line reveals a critical stress below which the surface failure cannot take place. This stress can also be regarded as the transition stress from the surface failure to the interior stress under R = 0.1. Its value is evaluated to be about 360 MPa. Conversely, for the interior failure, a continuously descending S–N curve characteristic is shown in the VHCF regime. Based on the currently available test data, the question of whether the interior fatigue limit exists cannot be answered.
S–N diagram of the TC4 titanium alloy under axial loading.

As distinct from the failure mode under R = 0.1, fatigue failures of specimens under R = −1 only correspond to the surface failure, even in the VHCF regime beyond 107 cycles. Although only one failure mode occurs under R = −1, the S–N data under this stress ratio can also be divided into two parts. One part corresponds to the relatively high stress regions with the short life less than around 2 × 10⁶ cycles and another part corresponds to the relatively low stress regions with the long life more than about 3 × 10⁷ cycles. In view of the fact that the separation of these two parts of S–N data is distinct, to some extent, TC4 titanium alloy also approximately represents the duplex S–N curve characteristics only related to the surface failure under R = −1, indicated by dashed lines in Fig. 2. The transition stress from the short life regime to the long life regime under R = −1 is about 600 MPa.
In contrast, it can be found that in the entire life regime including the VHCF regime, corresponding to a given stress amplitude, fatigue life has a decreasing tendency with the increasing stress ratio and is independent on the failure mode. This is in agreement with the common stress ratio effect on S–N behavior, that is, tensile mean stresses are detrimental and compressive mean stresses are beneficial.
B. Observation of the fracture surface
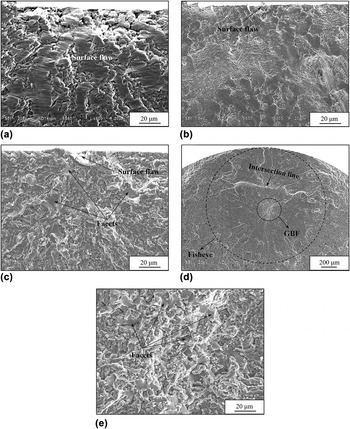
As above-mentioned, the surface failure is one typical failure mode of the TC4 titanium alloy under axial loading, either at R = 0.1 or at R = −1. Based on the SEM observation, the surface failure is mainly caused from the surface grinding flaws or defects, as shown in Figs. 3(a)–3(c). Under remote loading conditions, these flaws or defects can serve as stress concentrators and produce localized stress concentration at the surface. As a result, at these positions around flaws or defects where cyclic plastic deformation is higher than average. Also due to the reduced constraint associated with deformation within the surface layer, fatigue crack is easily nucleated from the surface. At the stress ratio of −1, it can be confirmed that there are few differences between the surface failure behaviors in the short life regime and in the VHCF regime based on the comparison between the fracture fractures shown in Figs. 3(a) and 3(b). Probably, the only difference between them is reflected that the fracture morphology for the surface failure in the VHCF regime is relatively flat due to the lower local cyclic plastic deformation related to the applied low stress level. For the surface failure under R = 0.1, it should be noted that a few small facets with smooth surface scattering at a limited area of crack nucleus can be observable, as shown in Fig. 3(c). But, this failure feature cannot be observed on the fracture surfaces for R = −1.
2D observation of typical fracture surfaces: (a) surface failure without facets (R = −1, σa = 700 MPa, and N f = 131,100 cycles), (b) surface failure without facets (R = −1, σa = 600 MPa, and N f = 150,536,900 cycles), (c) surface failure with facets (R = 0.1, σa = 382.5 MPa, and N f = 50,300 cycles), (d) fisheye failure with GBF (R = 0.1, σa = 270 MPa, and N f = 24,021,800 cycles), and (e) facets within GBF (R = 0.1, σa = 270 MPa, and N f = 24,021,800 cycles).

With respect to the interior failure, it only exists under R = 0.1. On the fracture surface, an approximately circular crack shaped like a fisheye can be observable, as shown in Fig. 3(d). It is worthy of note that even by means of the unaided eye, the fisheye morphology can be perceived or examined in the light of the distinct boundary between the fisheye and the adjacent crack region. This is mainly attributed to the different crack growth rates. Differing from the interior defect induced failure for most of alloy steels, herein, no obvious defects or discontinuities, such as inclusions, porosities, etc., can be found within the fisheye by using the analysis of an energy dispersive X-ray spectrometer. However, it should be noted that at the center position of the fisheye, a peculiar small bright area can be observed under the condition of SEM observation, in which a number of facets are randomly distributed. The relevant high magnification picture is shown in Fig. 3(e). In view of the similar morphology to the granular bright facet (GBF)Reference Shiozawa, Lu and Ishihara35 area commonly observed around the inclusion for alloy steels in the VHCF regime, herein this peculiar area is also called the GBF area. Furthermore, it can be seen from Fig. 3(d) that there is an obvious white line at the top of the GBF area within the fisheye. This phenomenon is often observed in the intersection zone of multiple cracks deriving from more than one crack source. However, on this fracture surface, only one crack source can be observed. In general, the magnitude of stress amplitudes plays a key role in the crack nucleation site. With the decreasing stress amplitude, the fatigue crack site can change from the surface in the life regime below 107 cycles to the interior in the VHCF regime beyond 107 cycles. But this transition is not absolute, which also depends on the other influencing factors such as material, loading type, surface condition, environment, etc. For example, in this study, the interior crack nucleation can be observed for the stress ratio of 0.1, whereas that cannot be observable for the stress ratio of −1. This is attributed to the effect of positive stress ratio which increases the probability of crack nucleation in α grains.
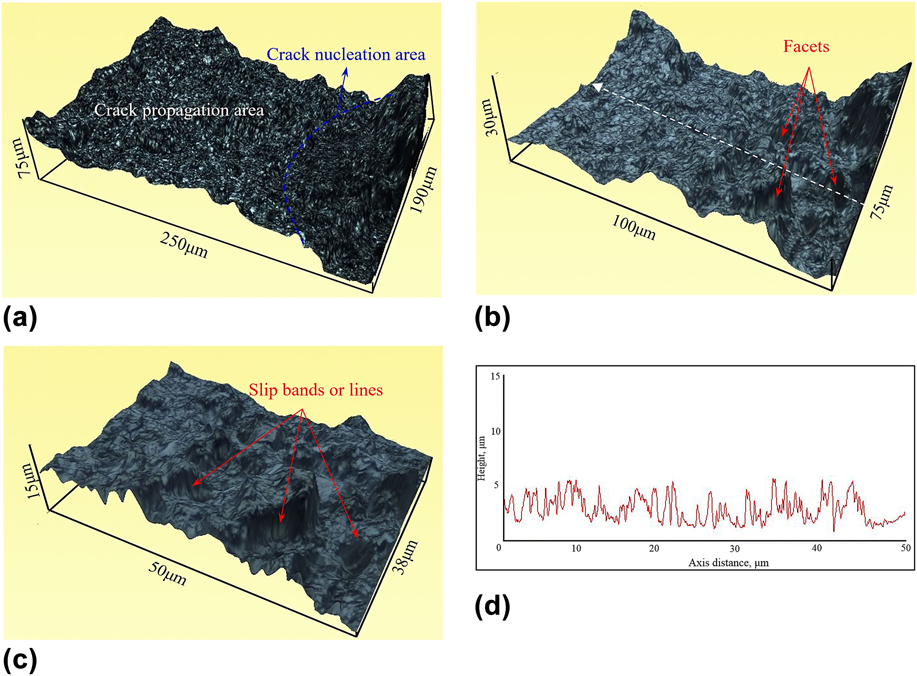
To understand the crack initiation and crack growth behavior better, the three-dimensional (3D) fracture morphologies related to the surface failure with facets and the interior failure with fisheye are observed by using the OM and LAMOS imaging analysis software. First, the 3D surface of the surface failure with facets under R = 0.1 (σa = 382.5 MPa, N f = 50,300 cycles) is shown in Fig. 4(a), in which the plotting scales in three directions are given. In view of the fact that the boundary between the crack initiation region and the crack growth region is relatively distinct, so the approximate crack initiation area (CIA) is indicated by a blue dashed line of arc and the rest of the area corresponds to the crack growth area in Fig. 4(a). On the whole, it can be seen and confirmed that the entire 3D surface is uneven and rough. In contrast, the height difference at the CIA is larger than that at the crack growth area. Within the CIA, some small inclined facets with smooth surface can be found in Fig. 4(b). Specially, it is noted that on these facets, some slip-like patterns or traces can be observable, as shown in Fig. 4(c). Moreover, the height of the CIA was qualitatively measured along the measuring line indicated by a white dashed line with an arrow in Fig. 4(b), and the result of height is shown in Fig. 4(d). It comes out that the average height value of the CIA is only a few microns.
3D observation of the fracture surface with surface failure under R = 0.1 (σa = 382.5 MPa, N f = 50,300 cycles): (a) crack nucleation and propagation areas, (b) facets limited in a roughness area, (c) slip bands or lines on facet, and (d) height of crack nucleation area with facets.

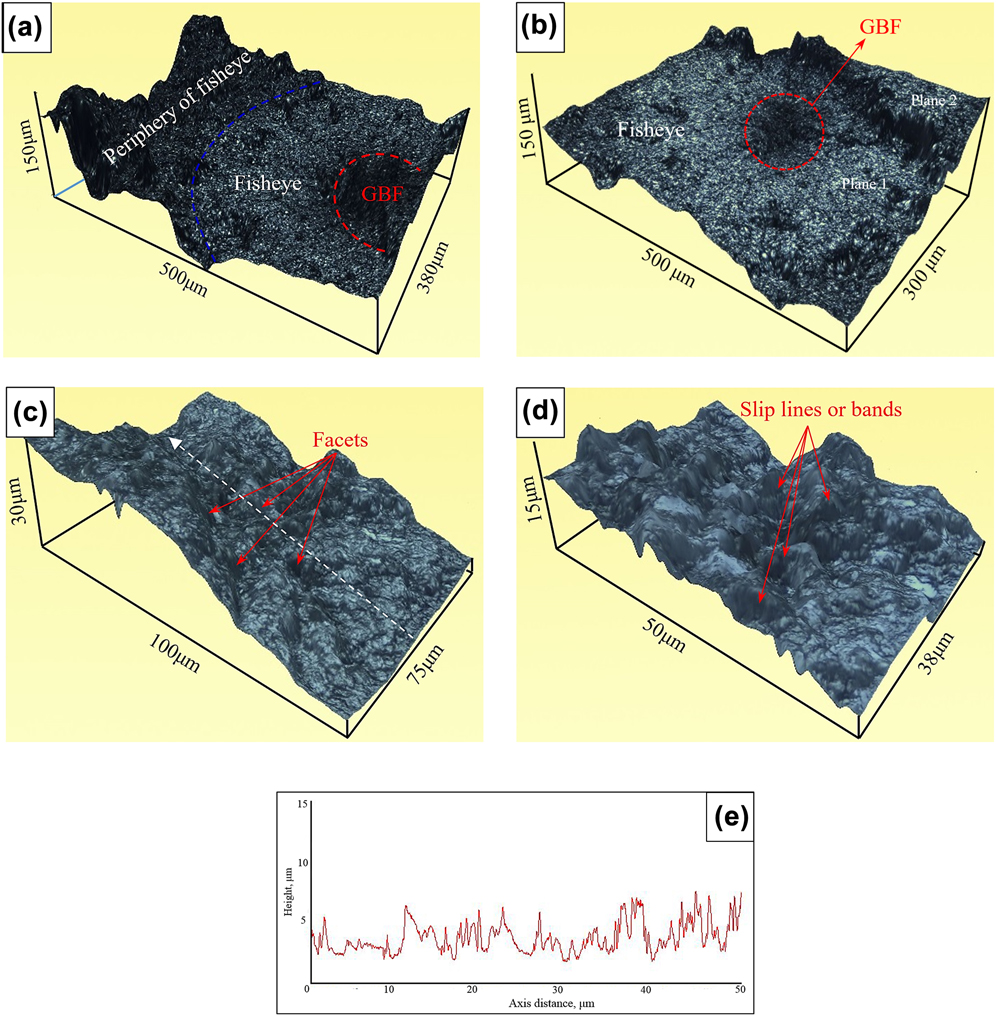
On the other hand, for the interior failure, the 3D morphology involving fisheye and its adjacent region is shown in Fig. 5(a), where the external contours of fisheye and GBF are indicated by a blue dashed line and a red dashed line, respectively. It is worthy of note that due to the difference of the microscopy observation principle or method, the GBF area is black under OM. This is different from the observed morphology of GBF under SEM. By contrast, it can be clearly seen from Fig. 5(a) that the area outside of fisheye relative to the area within fisheye is rougher. This is mainly attributed to the relatively high crack growth rate on the crack area outside of the fisheye. Moreover, Fig. 5(b) shows the 3D crack morphology within the fisheye. It is seen from the figure that the observed region within the fisheye can be divided into two regions including plane 1 and plane 2, but these two regions are not on the same plane. Therefore, it confirms that the observed intersection line in Fig. 3(d) actually corresponds to a transition from plane 1 to plane 2. The height difference between these two planes is about a few dozen micrometers. This transition from one plane to another plane in the progress for crack growth should be greatly associated with the orientation of grains. Meanwhile, this transition is certain to follow the rule, i.e., the crack propagation in a zigzag manner should be essentially perpendicular to and controlled primarily by the maximum tensile stress. Then, the 3D surface mainly concerning the GBF region is shown in Fig. 5(c), in which a few facets can be clearly found. Just like the result of the surface failure with facets, moreover, several slip-like patterns or traces are seen indistinctly on the facets, as shown in Fig. 5(d). Therefore, it can be concluded that the presence of facets, as well as the formation of GBF area, is closely related to the dislocation slip.
3D observation of the fracture surface with interior failure under R = 0.1 (σa = 270 MPa, N f = 24,021,800 cycles): (a) internal and outside areas of fisheye, (b) fisheye with GBF, (c) facets within GBF, (d) slip lines or bands on the facet and (e) height of the GBF area.

In addition, Fig. 5(e) shows the height value of the GBF area qualitatively measured along the measuring line indicated by a white dashed line with arrow in Fig. 5(c). It can be seen from the figure that the roughness value of the GBF area is very small, only scatted in the range of 2.3–6.6 μm. The arithmetic average value of filtered roughness determined from deviation about the center line within the evaluation length is only about 2.3 μm. This value is much lower than the value of the region outside of the GBF area. This means that the extremely low crack growth process occurs in the GBF area. This slow crack growth rate within the GBF area is mainly attributed to the premature contact of the crack faces, i.e., crack closure, resulted from the geometric incompatibilities of the generated crack surfaces, i.e., the fracture surface roughness or crack deflection. Especially under the VHCF process with low stress level, the long-term contact or wear, the crack surface gradually becomes smooth. Next, with the increase of crack length, i.e., the increase of the stress-intensity factor at the crack tip, the damage zone tends to become larger and the initiation area of secondary cracks also increases. Thus, the fracture surface can become rougher and rougher.
C. Crack size characteristics
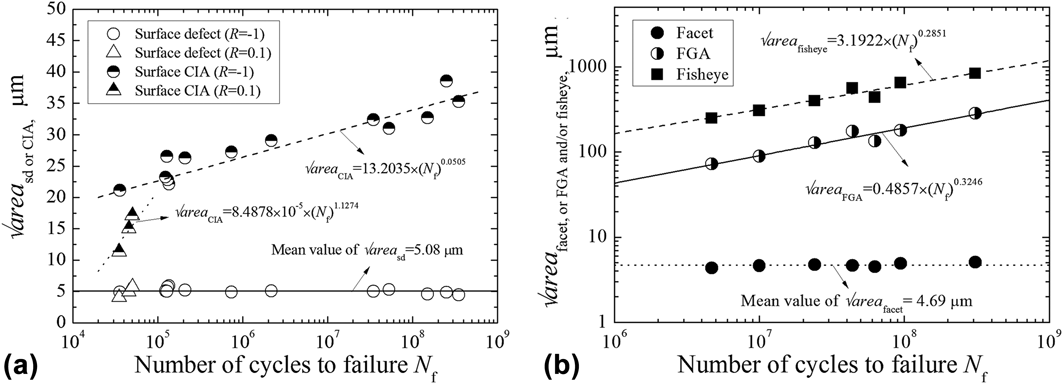
Based on fractography, two crack size parameters in units of μm are defined to discuss the interior and surface failure mechanisms of the TC4 titanium alloy under axial loading. One of them, the parameter d GBF is used to indicate the depth of GBF causing interior failure from its center to the nearest edge of the fracture surface and another parameter  $\sqrt {{\rm{area}}}$ that defined as the square root of the defect or crack area is used to indicate the sizes of facet, GBF, and fisheye for the interior failure, as well as the sizes of surface defect (SD) and CIA for the surface failure.
Based on the image processing software, the values of d GBF are measured, and the relationship between d GBF and N f is discussed. It comes out that the values of d GBF are scattered in the range of 30–1000 μm and independent on the fatigue life. This is mainly attributed to the stress state at axial loading. At the axial loading, the whole stress distribution on the cross-section area of the specimen is uniform from the edge to the center. Under this circumstance, the crack initiation site is mainly dependent on the randomly distributed microstructural inhomogeneities, particularly some grains are oriented such that planes of easy slip or glide (dislocation movement) are in the direction of the maximum applied shear stress.
For the surface failure, Fig. 6(a) shows the relationships between  $\sqrt {{\rm{are}}{{\rm{a}}_{{\rm{SD}}}}}$ and
 $\sqrt {{\rm{are}}{{\rm{a}}_{{\rm{CIA}}}}}$, and N f. For the SD, there are few differences between the values of
 $\sqrt {{\rm{are}}{{\rm{a}}_{{\rm{SD}}}}}$ under two stress ratios. As a whole, the sizes are small, only scattered in the range of 4.45–5.96 μm with an average value of about 5.09 μm. Moreover, it can be seen from the figure that they are also independent of fatigue life. Basically, the sizes of SDs are mainly related to the surface machining or finishing condition of the specimen. For the CIA, the values of
 $\sqrt {{\rm{are}}{{\rm{a}}_{{\rm{CIA}}}}}$ are scattered in the range of 21.11–38.51 μm under R = −1 and in the range of 12.91–16.12 μm under R = 0.1. Obviously, the sizes of CIA under R = −1 is larger than that under R = 0.1, but they all have a gradually increasing trend with the increasing fatigue life, just like the size change of the GBF and fisheye. The relationships can be expressed as
 $${\rm{Under\ }}R = - 1{\rm{:\ }}\sqrt {{\rm{are}}{{\rm{a}}_{{\rm{CIA}}}}} = 13.2035 \times {\left( {{N_{\rm{f}}}} \right)^{0.0505}}\quad .$$
 $${\rm{Under\ }}R = 0.1{\rm{:\ }}\sqrt {{\rm{are}}{{\rm{a}}_{{\rm{CIA}}}}} = 8.4878 \times {10^{ - 5}} \times {\left( {{N_{\rm{f}}}} \right)^{1.1274}}\quad .$$
Relationships between defect or crack sizes and fatigue life: (a) surface failure and (b) interior failure.

For the interior failure, Fig. 6(b) shows the relationships among  $\sqrt {{\rm{are}}{{\rm{a}}_{{\rm{facet}}}}}$,
 $\sqrt {{\rm{are}}{{\rm{a}}_{{\rm{GBF}}}}}$ and
 $\sqrt {{\rm{are}}{{\rm{a}}_{{\rm{fisheye}}}}}$, and N f. First, the values of
 $\sqrt {{\rm{are}}{{\rm{a}}_{{\rm{facet}}}}}$ are scattered in a limited range of 4.35–5.08 μm with an average value of about 4.69 μm, regardless of fatigue life. Almost, the size of the facet is equivalent to the size of α grain. It means that the formation of the facet is greatly related to the fracture of the α grain. Second, the values of GBF and fisheye are scattered in the ranges of 72.17–283.48 μm and 248.96–832.26 μm, respectively. They all tend to increase with the increasing fatigue life, and the corresponding relationships can be described as
 $${\rm{For\ GBF\!\!:\ }}\sqrt {{\rm{are}}{{\rm{a}}_{{\rm{GBF}}}}} = 0.4857 \times {\left( {{N_{\rm{f}}}} \right)^{0.3246}}\quad .$$
 $${\rm{For\ fisheye\!\!:\ }}\sqrt {{\rm{are}}{{\rm{a}}_{{\rm{fisheye}}}}} = 3.1922 \times {\left( {{N_{\rm{f}}}} \right)^{0.2851}}\quad .$$
D. Evaluation of stress-intensity factor
Based on the discussion of crack characteristic size, the SD or CIA, as well as the interior facet or GBF, can be approximately classified to the domain of small crack.Reference Pippan, Tabernig, Gach and Riemelmoser36 From the viewpoint of small crack fracture mechanics, the stress intensity factor (SIF) ranges at the front of them can be evaluated by using the  $\sqrt {{\rm{area}}}$ model proposed by Murakami.Reference Murakami37 First, for the surface failure, the corresponding SIF ranges for SD and CIA, ΔK sd and ΔK CIA, are given byReference Murakami37
 $$\Delta {K_{{\rm{sd\ or\ CIA}}}} = 0.65 \times \Delta \sigma \sqrt {\pi \sqrt {{\rm{are}}{{\rm{a}}_{{\rm{sd\ or\ CIA}}}}} } \quad ,$$
where ∆σ is the stress range. Furthermore, in consideration of the fact that for the crack growth, the tensile stress has a predominant effect, but the compressive stress has no significant effect, so the value of ΔK in Eq. (5) for the stress ratio of −1 can be calculated by using the stress amplitude instead of the stress range, That is, the values of ΔK sd and ΔK CIA under R = −1 can be rewritten asReference Murakami37
 $$\Delta {K_{{\rm{sd\ or\ CIA}}}} = 0.65 \times {\sigma _{\rm{a}}}\sqrt {\pi \sqrt {{\rm{are}}{{\rm{a}}_{{\rm{sd\ or\ CIA}}}}} } \quad .$$
Then, for the interior failure, the corresponding SIF ranges for the interior facet or GBF, ΔK facet and ΔK GBF, are given byReference Murakami37
 $$\Delta {K_{{\rm{facet\ or\ GBF}}}} = 0.5 \times \Delta \sigma \sqrt {\pi \sqrt {{\rm{are}}{{\rm{a}}_{{\rm{facet\ or\ GBF}}}}} } \quad .$$
Furthermore, the propagating crack outside the GBF can be approximately considered to have a circular shape. Therefore, the SIF ranges at the front of the fisheye, ΔK fisheye, can be expressed asReference Murakami37
 $$\Delta {K_{{\rm{fisheye}}}} = {2 \over \pi }\Delta \sigma \sqrt {\pi \sqrt {{{{\rm{are}}{{\rm{a}}_{{\rm{fisheye}}}}} / \pi }} } \quad .$$
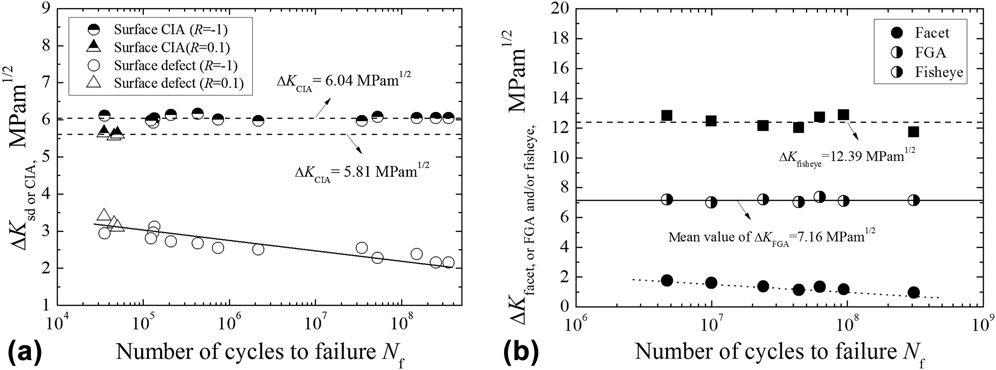
Figure 7(a) shows the relationships between ΔK sd and ΔK CIA, and N f. First, the evaluated values of ΔK sd for the stress ratios of −1 and 0.1 are scattered in the ranges of 2.01–3.13 MPa m1/2 and 3.22–3.43 MPa m1/2, respectively. They all tend to decrease with the increasing fatigue life. Since the results of ΔK sd under these two stress ratios do not have a marked discrepancy in the same life regime, the variation trend of ΔK sd under these two stress ratios is uniformly indicated by a solid line in Fig. 7(a). Otherwise, compared with the threshold SIF for long crack growth of TC4, about 5–6 MPa m1/2, it comes out that the values of ΔK sd are obviously smaller. Especially in the VHCF regime, such as at the fatigue life of 108 cycles, the value of ΔK sd is only about 2 MPa m1/2. In view of the fact that the sizes of SDs are only on the order of grain size, as well as the typical feature of small crack propagating at the values of ΔK that are less than long crack threshold value, it can be concluded that the growth process of microstructurally small fatigue cracks whose length are in comparable with the scale of some microstructural dimensions plays an important role in causing SD-induced failure in the VHCF regime. Second, it can be seen from Fig. 7(a) that under every stress ratio, the values of ∆K CIA approximately keep a constant and are regardless of fatigue life. Corresponding to R = −1 and 0.1, the values of ∆K CIA are evaluated to be 6.04 MPa m1/2 and 5.81 MPa m1/2, respectively. Apparently, the values of ∆K CIA tend to decrease with the increasing stress ratio. It should be noted that the value of ∆K CIA under R = 0.1 is relatively similar to the threshold value for long crack growth of the material. Thus, it can be concluded that ∆K CIA can be approximately considered as the threshold value for controlling stable growth of surface long crack.
Relationships between SIF ranges for defect or crack and fatigue life: (a) surface failure and (b) interior failure.

On the other hand, Fig. 7(b) shows the relationships among ∆K facet, ∆K GBF and ∆K fisheye, and N f under R = 0.1. The values of ∆K facet are scattered in the range of 1.3–1.7 MPa m1/2, which has a descending trend with the increasing fatigue life. This is because the size of the facet almost keeps a constant related to the α grain size. Thus, with the increasing fatigue life, i.e., the decreasing of applied stress amplitude, the values of ∆K facet are bound to decrease. The values of ∆K facet are very small, especially in the VHCF regime. The minimum value of ∆K facet is about 1 MPa m1/2. This means that the effect of microstructurally small crack should play an important role in the interior fatigue processes of facets. Also, it should be noted that the values of ∆K facet are obviously less than the values of ΔK sd corresponding to the same fatigue life and much below than the common threshold value for long crack growth. In view of the fact that the initiation and growth of the interior crack happen in the matrix, so the environment for the interior failure process can be considered to be almost vacuum, which is different from the condition of the surface failure process in air. Studies have shown that the threshold SIF range concerning microstructurally small cracks in vacuum is smaller than that in air.Reference Oguma and Nakamura5 Thus, this is the reason why the interior failure still can occur when the values of ∆K facet are smaller than the values of ΔK sd corresponding to the same fatigue life.
In addition, it can be seen from Fig. 7(b) that the values of ∆K GBF approximately keep a constant of 7.16 MPa m1/2 and regardless of fatigue life. This is the reason why the GBF size tends to increase with the increasing fatigue life. Under this circumstance, it can be assumed that when the crack size reaches the size of GBF, i.e., the GBF is formed, the interior fatigue crack can propagate stably as a penny-shaped crack. This process can be governed by the Paris law. Thus, ∆K GBF can be considered as the threshold value for controlling stable growth of the interior long crack. However, it should be noted that the values of ∆K GBF are larger than those of ∆K CIA under R = 0.1. This is attributed to the detrimental effect of air environment. The surface long crack growth occurs in air, whereas the interior long crack growth occurs in vacuum. To some extent, moisture or humidity in air can lead to a lower threshold SIF range for long crack growth. This result is just contrary to the result of small crack growth. Just like ∆K GBF, furthermore, the values of ∆K fisheye approximately keep a constant of 12.39 MPa m1/2 and independent on fatigue life. This is the reason why the GBF size tends to increase with the increasing fatigue life. In consideration of the comparability between the value of ∆K fisheye and fatigue fracture toughness of TC4, ∆K fisheye can be approximately regarded as the threshold value controlling unstable growth of the interior long crack. This means that after the formation of fisheye, the subsequent fatigue crack growth rates are very high as they approach instability without an increase in load, and the little fatigue crack growth life is involved.
E. Interior failure mechanism in the VHCF regime
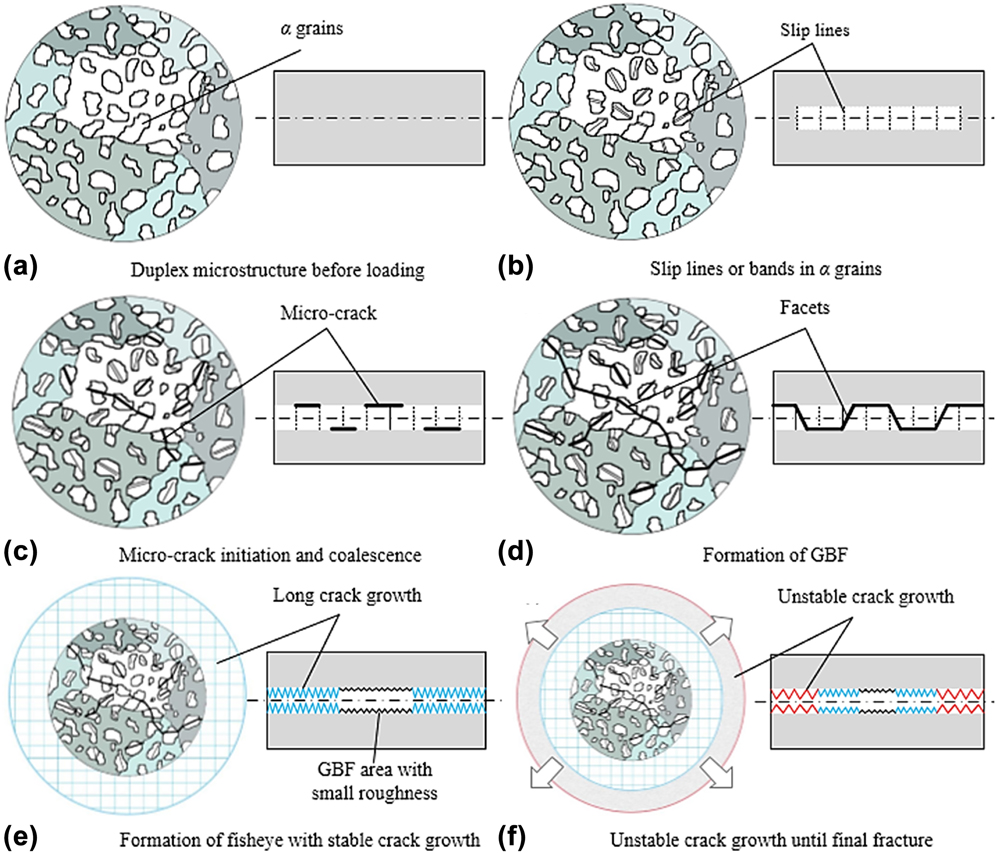
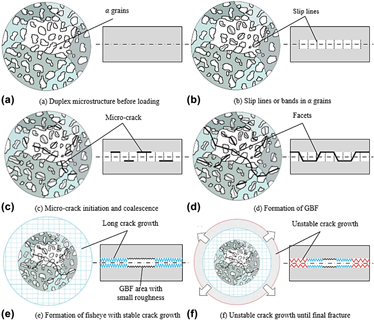
Based on above-mentioned discussion and analysis, it can be found that the interior failure process relative to the surface failure process is more complicated and remarkable. Thus, only the interior failure mechanism of the TC4 titanium alloy in the VHCF regime was elucidated in this study. On the whole, the typical stages of the interior failure process of the TC4 titanium alloy in the VHCF regime can be summarized schematically in Fig. 8. In this figure, the cross sections passing through the crack initiation site are indicated in the left hand side, while the longitudinal sections passing through the same crack initiation site are indicated in the right hand side.
Interior failure mechanism in the VHCF regime: (a) duplex microstructure before loading, (b) slip lines or bands in α grains, (c) microcrack initiation and coalescence, (d) formation of GBF, (e) formation of fisheye with stable crack growth, and (f) unstable crack growth until final fracture.

It is mentioned that the TC4 titanium alloy investigated in this study is a two-phase alloy consisting of hexagonal-close-packed α-phase and body-centered-cubic β-phase. The schematic of the relevant microstructure of the TC4 titanium alloy is shown in Fig. 8(a). It is known that the strength and hardness of the α-phase are lower than those of the β-phase. Under external cyclic loading, the deformation between them is inharmonic, and the stress concentration can occur in their interfaces. Thus, the softer α-phase is more easily strained than the harder β-phase. Furthermore, it should be noted that each grain has its own particular mechanical properties, ordering direction, and directional properties. With respect to some α grains that are oriented on the planes of easy slip or glide (dislocation movement) in the direction of the maximum shear stress, the possibility of their deformation greatly increases even if the applied nominal gross stress is lower in the VHCF regime. Under this circumstance, these softer α-phases first can undergo plastic deformation and yield, but the harder β-phases still remain in one elastic state and prevent the softer phase yielding. Just as the slip-like patterns can be observable on the surfaces of facets whose sizes are similar to α-grain sizes after experiment, the slips occur under cyclic loading and are the localization of the plastic strain. Also, the onset of the slip creates an appearance of one or more planes within a grain sliding relative to each other. Thus, more and more slip lines or bands can be continuously formed on some α grains, as shown in Fig. 8(b).
As cycling continues, more slip lines occur and continue to thicken. These intensified slip lines or bands, especially the progressive development of extrusion–intrusion pair, can become sources for cracks to develop. Thus, under the condition of consistent occurrence for dislocation movement and slip, a few microcracks can initiate within some α grains, as shown in Fig. 8(c). When the SIF at the microcrack tip exceeds the threshold value controlling the microstructurally local small crack, growth can take place in these microcracks, followed by the fracture of some grains, and finally some small facets are formed. In view of the fact that the different orientation exists in these grains because of the different crystallographic orientation of each grain, so the facets also have a different orientation, just like the observed results on the fracture surface. In consideration of the fact that the positive stress ratio is more conducive to the crack growth, so the slip-induced crack initiation and growth within primary α grains, associated with the formation of facets, are more likely to occur in the stress state of positive stress ratios, i.e., tension–tension. This is the reason why the facets can be easily observable for the stress ratio of 0.1 rather than −1. Moreover, the interior fatigue damage process almost takes place in the vacuum environment, to some extent, the threshold value for microcracks in the vacuum is smaller than that in the air. Therefore, the slip-induced fracture of α grains, i.e., the presence of facets, is more likely to happen in the interior fatigue process. Also, some researchers pointed out that due to the deficiency of oxygen in the matrix, a local cyclic erosion process can take place, which can overcome the effect of crack closure and promote the crack growth under a given condition.Reference McEvily, Nakamura, Oguma, Yamashita, Matsunaga and Endo4 This is also confirmed by the results in this study that clearer facets can be observed in the fracture surfaces for the interior failure rather than the surface failure.
With the continuous initiation and growth of microcracks, some of them will coalesce to one another. When the initiation, growth, and coalescence of the microcracks entirely spread all over a fine granular layer, a penny-shaped crack, i.e., GBF, is formed, as shown in Fig. 8(d). In this situation, the SIF range at the tip of GBF reaches the threshold value controlling interior long crack growth. Next, the penny-shaped crack continues to propagate at a stable rate described by the Paris law until the fisheye is formed, as shown in Fig. 8(e). The formation of the fisheye refers to the condition in which the crack begins to extend in a rapid or unstable manner without an increase in load or applied energy. After that, the crack takes place unstable growth until final fracture occurs, as shown in Fig. 8(f).
IV. CONCLUSIONS
Main conclusions obtained in this study are summarized as follows:
(1) The TC4 titanium alloy under axial loading shows the duplex S–N curve characteristics associated with surface and interior failures under R = 0.1, while it also shows the similar S–N curve characteristics only related to the surface failure under R = −1.
(2) There are few differences between the fracture surfaces in the short life regime and in the VHCF regime under R = −1, and the corresponding failure is mainly induced from surface grinding flaws or defects served as stress concentrators.
(3) The interior failure exhibits the peculiar failure mechanisms associated with facets, GBF, and fisheye in the VHCF regime, and several slip-like patterns or traces can be observable on the facets.
(4) The facets are more easily formed under the positive stress ratio and in the vacuum environment, which is dependent on the lower threshold value governing small crack growth and the promotive crack growth environment.
(5) The roughness value of the GBF area is very small, only 2.3–6.6 μm, which means that the only extremely low crack growth process mainly resulted from the geometric incompatibilities of the generated crack surfaces occurs in the GBF area.
(6) The interior failure process is summarized as follows: (i) occurrence of slip lines or bands on partial α grains under cyclic loading, (ii) initiation of microcracks within some α grains due to the occurrence of dislocation slip, followed by the formation of facets, (iii) coalescence of microcracks and the formation of GBF, (iv) stable macrocrack growth within fisheye, controlled by ∆K GBF, (v) unstable crack growth outside the fisheye, controlled by ∆K fisheye, and (vi) the final fracture.
ACKNOWLEDGMENT
This work was supported by the National Natural Science Foundation of China (Grant No. 51775043).