




No CrossRef data available.
Article contents
Rodent malaria parasites suffer from the presence of conspecific clones in three-clone Plasmodium chabaudi infections
Published online by Cambridge University Press: 17 October 2003
Abstract
We studied infection dynamics of Plasmodium chabaudi in mice infected with 3 genetically distinct clones – 1 less virulent than the other 2 – either on their own or in mixtures. During the acute phase of infection, total numbers of asexual parasites in mixed-clone infections were equal to those produced by the 3 clones alone, suggesting strong in-host competition among clones. During the chronic phase of the infection, mixed-clone infections produced more asexual parasites than single-clone infections, suggesting lower levels of competition than during the acute phase, and indicating that a genetically diverse infection is harder to control by the host immune system. Transmission potential over the whole course of infection was lower from mixed-clone infections than from the average of the 3 single-clone infections. These results suggest that in-host competition reduces both growth rate and probability of transmission for individual parasite clones.
Information
- Type
- Research Article
- Information
- Copyright
- 2003 Cambridge University Press
INTRODUCTION
Human malaria infections often consist of different parasite genotypes occupying the same host (Babiker et al. 1991; Conway, Greenwood & McBride, 1991; Arnot, 1998; Babiker, Ranford-Cartwright & Walliker, 1999; Felger et al. 1999; Smith et al. 1999), but the effect of multiplicity on virulence is unclear (reviewed by Read & Taylor, 2001). Previous experiments conducted in our laboratory with the rodent malaria model Plasmodium chabaudi have shown that mixed-clone infections with 2 parasite clones can result in higher virulence (Taylor, Mackinnon & Read, 1998; Timms, 2001), and can leave transmission unchanged or even increased (Taylor, Walliker & Read, 1997; Timms, 2001).
Here we studied experimental mixed infections of 3 genetically distinct clones, 2 of which were virulent, and the third avirulent. We infected laboratory mice with 1 of these clones, or with a mixture of them, to address the following questions: (i) is within-host growth of individual clones reduced by the presence of other clones, (ii) is transmission reduced by the presence of other clones, and (iii) do hosts experience more virulence from mixed infections than from single infections?
MATERIALS AND METHODS
Parasites and hosts
We used 3 cloned P. chabaudi lines, denoted AS, AT and ER (Beale, Carter & Walliker, 1978), originally derived from different isolates from thicket rats. Between isolation from the field and use in this experiment, AS, AT and ER had been blood passaged in mice 8, 7 and an unknown number of times, respectively. These clones were chosen for their different growth rates and virulence, AS having a much slower growth rate and virulence than AT and ER which were similar (Mackinnon & Read, 1999).
Hosts used for the experiment were 6-week-old C57Bl/6 inbred female mice (B&K Universal, England), fed on 41B maintenance diet (Harlan, England) and drinking water supplemented with 0·05% para-amino benzoic acid (PABA) to enhance parasite growth (Jacobs, 1964). Mice were kept in a 12[ratio ]12 h light-dark cycle.
Experimental design and inoculation of mice with parasites
We used 2 main treatments. One treatment was single-clone infections of clone AS, AT or ER, the other one was mixed-clone infections with one of the following clone ratios in the inocula: 8AS[ratio ]1AT[ratio ]1ER, 1AS[ratio ]8AT[ratio ]1ER, 1AS[ratio ]1AT[ratio ]8ER and 1AS[ratio ]1AT[ratio ]1ER. We chose highly skewed ratios as well as an evenly distributed ratio, to see if starting conditions were important for the outcome of competition. Inoculations consisted of the same total number of parasites (105 parasite-infected red blood cells in 0·1 ml) and were delivered i.p.; they were prepared from donor mice by diluting blood in a calf-serum solution (50% heat-inactivated calf-serum, 50% Ringer's solution [27 mM KCl, 27 mM CaCl2, 0·15 M NaCl], 20 units heparin/ml of mouse blood). The single-clone infection of AS consisted of 4 mice, while all other groups consisted of 5.
Monitoring of parasite densities and gametocyte densities
Thin blood smears were made from tail blood every 2 days from day 4–16, 3 times a week from day 24 to 35 and twice a week from day 39 to 70 post-inoculation (p.i.). After staining with Giemsa, the proportion of red blood cells infected with asexual parasites (parasitaemia) and gametocytes (gametocytaemia) were counted microscopically using 1000× magnification. When asexual parasitaemia was high, about 500 red blood cells were counted in at least 4 microscopic fields, whereas with lower parasitaemias 10 microscopic fields were counted for the number of parasites per field, and the average number of cells per field was calculated. Gametocytaemia was assessed from approximately 50 microscopic fields (corresponding to 25–30000 red blood cells), using polarized light, which highlights mature gametocytes against a dark background. Red blood cell densities were estimated by flow cytometry (Coulter Electronics) from a 1[ratio ]50000 dilution of a 2 μl sample of tail blood into Isoton solution on days 0, every 2 days from day 4 to 14, on days 17, 19 and 21 and then weekly from day 28 to 70 p.i. Asexual parasite density and gametocyte density were calculated from the product of red blood cell density and parasitaemia or gametocytaemia. On some days, parasitaemia, but not red blood cell density, was recorded, in which case the average red blood cell density on the previous and ensuing measurements was used for these calculations.
Monitoring of virulence
We used maximum weight loss and maximum red blood cell loss in the mouse as indicators of morbidity, which has been shown to correlate with mortality (Mackinnon, Gaffney & Read, 2002). Red blood cell density was measured as described above, and mouse weights were recorded on days 0, 4, every day from day 6 to 14, days 17, 19, 21, 24 and weekly from day 28 to 70 p.i.
Monitoring of clone dynamics using PCR-detection
Samples of 2 μl of mouse blood from the tail were stored in 200 μl of PBS solution (BDH) until DNA extraction, 1–4 h later, using red blood cell lysis buffer (Boehringer). PCR was performed as described by Taylor, Walliker & Read (1997), with the exception that we used 2 μl for the outer reaction, and 3 μl of 10× diluted outer reaction product for the inner reaction. Products were analysed on 2% metaphor agarose gels (FMC Bioproducts) using ethidium bromide staining. AS showed a band of approximately 300 bp, AT showed a band of approximately 320 bp and ER showed a band of 359 bp. At least 2, and usually 3 PCR reactions were performed on blood samples taken on days 4, 6, 8, 12, 17, 19, 21, 24, 26, 28, 31, 33, 35 and 39.
Statistical analyses
Trait definition.
The areas under the asexual parasite and gametocyte density by time curves (Fig. 1A, B) from days 0–12, days 12–39 and from days 39–70 p.i. were calculated as measures of the total number of parasites or gametocytes produced during acute, first and second part of the chronic phase of the infection, respectively, and are referred to as ‘total parasite densities’ and ‘total gametocyte densities’. We chose day 12 as the end of the acute phase as most infections were over their first peak at that point and started to rise again (results for individual mice not shown). Day 39 was chosen as the second break point because all infections had reached low parasitaemias by then. In the analysis, total gametocyte densities over days 12–39 and 39–70 were grouped together; this made the residual errors from the analysis follow a normal distribution, meeting the statistical assumption of normality. Data on asexual parasite density and gametocyte density were log10 transformed prior to analyses to reduce overdispersion in the distribution. As the threshold for detecting parasites by microscopy was around 1/105 red blood cells, when observed values of asexual parasite or gametocyte numbers were zero, they were replaced with 1/104 red blood cells so that zero values fell within the normal distribution range. As indicators of virulence, the minimum weight and red blood cell density for each mouse were subtracted from the average of their values on days 0 and 4 to give ‘maximum weight loss’ and ‘maximum red blood cell loss’. ‘Last day seen’ was defined for each clone as the day on which the last positive PCR result was obtained.

Fig. 1. Average log10 asexual parasite density (A) and log10 gametocyte density (B) through time in mice infected with either clone AS, AT or ER of Plasmodium chabaudi or a mixture of these 3 clones. Numbers represent the means of 4 mice (AS), 5 mice (AT, ER) and 19 mice (Mixed). Because parasite and gametocyte densities of 0 were set to 104 (see text), the y-axis starts at 4.
Hypothesis testing
The main aim of the analysis was to determine whether mixed-clone infections could be predicted by the 3 following alternative hypotheses. (1) The ‘Average all’ hypothesis: mixed-clone infections equal the average of the 3 single-clone infections, i.e. there is competition such that each clone in a mixed-clone infection obtains only a share of the total infection load. The value from each single-clone infection was weighted by one third and summed to give the predicted value of the mixed-clone infections. (2) The ‘Average virulent’ hypothesis: mixed-clone infections equal the average of AT and ER single-clone infections, i.e. the avirulent clone (AS) is out-competed, and the 2 virulent clones dictate the infection. (3) The ‘Sum’ hypothesis: mixed-clone infections equal the sum of all single-clone infections, i.e. clones do not compete, and virulence is as high as the sum of the virulence induced by each clone on its own.
To test these hypotheses, the means of mixed-clone infections were compared with predicted means by the method of linear contrasts using the CONTRAST statement in PROC GLM of SAS (SAS/STAT, 1990). This method applies the appropriate weights, as dictated by the hypothesis (e.g., in the case of the ‘Average all’ hypothesis, 0·33 for each single-clone infection, and −1 for the pooled mixed-clone infections), to the design matrix of the linear equations, and then tests the significance level from the sum of squares of these equations as usual. Note that this method allows for error on the predicted means (which were determined from the single-clone infections) as well as that on the observed means.
We also tested for differences in the rate of decline in the heights of the peaks of parasite densities through time. This was done by fitting a model to all data on parasite density peaks that occurred throughout the infection with fixed effects for treatment (4 levels), day of peak (linear covariate), an interaction between these and a random effect for mouse to account for non-independence between repeated measures on the same mouse (PROC MIXED in SAS).
Before testing our hypotheses, we tested for differences among single-clone infections, and among mixed-clone infections, using analysis of variance in PROC GLM of SAS, with a treatment factor with 3 levels (1 for each clone) or 4 levels (1 for each mixed-clone infection). Treatment and subtreatment means were compared by t-tests based on the residual variance after fitting the model. We also analysed ‘last day seen’, to determine whether mixed-clone infections were indeed still mixed-clone infections.
RESULTS
During the 70-day period of the experiment, parasite densities exhibited up to 6 peaks (average of 3·8±0·13), which decreased in height and frequency through time (Fig. 1A). Most of the gametocytes were produced during the first and second wave of asexual parasites (Fig. 1B). Afterwards they were detectable only during subsequent peaks in asexual parasite densities. One mouse in the group inoculated with 1AS[ratio ]1AT[ratio ]8ER died on day 10 p.i. This mouse had a relatively, but not exceptionally, high parasitaemia (34·6%) on day 8 p.i., but its initial weight was lower than the weights of the other mice in the same group.
Differences among single-clone infections and among mixed-clone infections
Mice infected with AS produced lower parasite densities over days 0–12 and 12–39, produced more gametocytes over the whole course of infection, and lost less weight and red blood cells than AT and ER (P=0·02, P=0·04, P<0·01, P<0·001, P<0·001 respectively) which themselves did not differ. AT and ER only differed in their total number of gametocytes over days 0–12, being higher in AT (P=0·01).
Among mixed-clone infections, mice in the 1AS[ratio ]1AT[ratio ]1ER treatment lost significantly less weight (P<0·05), had lower total parasite density over days 0–12 (P<0·05) and lower total gametocyte density over days 12–39 (P<0·05) than the other mixed-clone infections, but were similar for other traits. We therefore decided to pool the 4 different mixed treatments together prior to further hypothesis testing.
Survival of individual clones
In both single-clone infections and mixed-clone infections, AS disappeared below the PCR detection level before AT and ER (18·2 days for AS, 28·9 and 31·0 days for AT and ER single-clone infections, P<0·001; 18·4 days for AS, 26·9 and 22·0 days for AT and ER in mixed-clone infections, P<0·001). There was no interaction between treatment and clone effects, showing that clone AS was present for less time than AT and ER in both single-clone and mixed-clone infections. This could be explained by lower parasite densities, since there was a strong relationship between parasite density and PCR-positive rate (data not shown). We have no information on which clones were present after day 39 p.i. (when PCR sampling stopped), even though we still detected parasites by microscopy. We therefore do not know whether most infections from these days onwards were in fact still mixed-clone infections.
Hypothesis testing
Total asexual parasite densities during the acute phase (days 0–12; Fig. 2A) of mixed-clone infections did not differ from parasite densities predicted under the ‘Average all’ or ‘Average virulent’ hypotheses (P>0·10 for both), but were far lower than those under the ‘Sum’ hypothesis (P<0·001). Between days 12 and 39 the total number of parasites in mixed-clone infections was higher than that under the ‘Average all’ hypothesis, lower than that under the ‘Sum’ hypothesis, but the same as that under the ‘Average virulent’ hypotheses (P<0·001, P<0·001 and P=0·07 respectively). After day 39 parasite densities in mixed-clone infections were much higher than those predicted by the ‘Average all’ and ‘Average virulent’ hypotheses (P=0·02, P=0·03 respectively), although whether they were actually the same as those under the ‘Sum’ hypothesis, could not be tested statistically, as their variances differed greatly (Fig. 2C). The greater number of parasites in mixed-clone infections after day 12 was partly attributable to there being more peaks in mixed-clone infections (4·1±0·16) than single-clone infections (3·4±0·19, P<0·01). It was also partly due to higher individual peaks since the rate of decline in the height of peak densities through time was significantly slower than in single-clone infections (Fig. 3; P<0·001).

Fig. 2. (A) Total number of asexual parasites produced during the acute phase of infection (days 0–12) for single-clone infections (AS, AT, ER), mixed-clone infections (Mixed) and the predicted numbers based on the ‘Average all’ (Av. all), ‘Average virulent’ (Av. vir.) and ‘Sum’ (Sum) hypotheses. Bars represent ±1 S.E. Significance levels for testing whether predicted values under the ‘Average all’, ‘Average virulent’ or ‘Sum’ hypotheses differ from ‘Mixed’ are denoted as: ***P<0·001; **0·001<P<0·01; *0·01<P<0·05, [dagger]0·05<P<0·1. (B) As for (A), but for first part of chronic infection (days 12–39). (C) As for (A), but for second part of chronic phase of infection (days 39–70). Note that no significance symbol is present for the ‘Sum’ hypothesis, because this hypothesis could not be tested due to differences in variance.

Fig. 3. Best-fit regression lines between parasite density at primary and recrudescent peaks (log10 transformed) and day p.i. for mice infected with single-clone infections (—— [lozf ], [squf ], [utrif ]) or mixed-clone infections of Plasmodium chabaudi clones AS, AT and ER (–––, ○).
Over days 0–12 total numbers of gametocytes in mixed-clone infections did not differ from those under the ‘Average all’ or ‘Average virulent’ hypotheses (Fig. 4A; P=0·27, P=0·52 respectively), but were much lower than those under the ‘Sum’ hypothesis (P<0·001). Between day 12 and day 70 mixed-clone infections produced as many gametocytes as predicted under the ‘Average all’ and ‘Average virulent’ hypotheses (Fig. 4B; P=0·06, P=0·59 respectively), but far less than predicted under the ‘Sum’ hypothesis (P<0·0001). Taken over the whole infection, mixed-clone infections had lower numbers of gametocytes than those predicted under the ‘Average all’ hypothesis (Fig. 4C; P=0·03), but they were not different from those under the ‘Average virulent’ hypothesis (P=0·68). They were again lower than those under the ‘Sum’ hypothesis (P<0·001).

Fig. 4. (A) Total number of gametocytes produced during the acute phase of infection (days 0–12) for single-clone infections (AS, AT, ER), mixed-clone infections (Mixed) and the predicted numbers based on the ‘Average all’ (Av. all), ‘Average virulent’ (Av. vir.) and ‘Sum’ (Sum) hypotheses. See Fig. 2 (A) for a description of annotations. (B) As for (A), but for chronic phase (days 12–70). (C) As for (A), but for the whole course of infection (days 0–70).
Maximum weight loss (Fig. 5A) was as predicted by the ‘Average all’ and ‘Average virulent’ hypotheses (P=0·09, P=0·62). Maximum red blood cell loss (Fig. 5B) was higher than predicted by the ‘Average all’ hypothesis, but as predicted by the ‘Average virulent’ hypothesis (P<0·001, P=0·26). Both maximum weight loss and maximum red blood cell loss were much lower than predicted by the ‘Sum’ hypothesis (P<0·001 for both).

Fig. 5. Maximum weight loss (A) and maximum red blood cell loss (B) in single-clone infections (AS, AT, ER), mixed-clone infections (Mixed) and as predicted under the ‘Average all’ (Av. all), ‘Average virulent’ (Av. vir.) and ‘Sum’ (Sum) hypotheses. See Fig. 2 (A) for a description of annotations.
DISCUSSION
During the acute phase, parasite densities in mixed-clone infections were as high as the average of all 3 (‘Average all’ hypothesis) or the 2 virulent single-clone infections (‘Average virulent’ hypothesis), and much lower than predicted by their sums (‘Sum’ hypothesis). This indicates that during this phase, when parasite densities are high, clones must compete strongly for ecological space. After the acute phase, especially well into the chronic phase, when densities decrease, parasite densities in mixed-clone infections started to be higher than those predicted by the ‘Average all’ and ‘Average virulent’ hypotheses, indicating that competition lessened. However, parasite densities were still not as high as those predicted by the ‘Sum’ hypothesis, suggesting that some level of competition persisted. Our PCR results showed that, in general, all 3 clones survived the acute phase, suggesting that all 3 clones were affected by competition, though to what degree we cannot tell.
The fact that parasite clones in these mixed-clone infections suffered from competition, is not surprising, as there are several mechanisms by which this could happen. First, mice became very anaemic (probably through a combination of both parasite rupture, as well as phagocytosis of red blood cells and decreased red blood cell production (Cox, 1988; Jakeman et al. 1999; Menendez, Fleming & Alonso, 2000)), possibly resulting in competition between clones for remaining red blood cells. Yap & Stevenson (1994) showed that by artificially preventing anaemia through blood transfusion during and after peak parasitaemia in P. chabaudi, the patency of infection could be prolonged for up to 5 days after peak parasitaemia. Mice infected with Plasmodium chabaudi are also known to become hypoglycaemic (e.g. Li, Seixas & Langhorne, 2001), so low levels of glucose could also limit parasite growth and enhance competition.
Secondly, parasite clones could adversely affect each other through strain-transcending immunity. During the acute phase, immunity is thought to be largely non-specific (Li et al. 2001; Taylor-Robinson, 1995), although clone-specific immunity also plays a role (Jarra & Brown, 1989; Snounou et al. 1989) and antibodies seem to target parasitized red blood cells for phagocytosis through a very parasite clone-specific process (Mota et al. 1998). This means that if one clone provokes an immune response, it could adversely affect another. This has also been inferred for mixed-species and mixed-clone Plasmodium infections (Bruce et al. 2000). During the chronic phase there also seems to be a Th2 antibody-mediated response (Li et al. 2001; Phillips et al. 1997; Taylor-Robinson, 1995). We noticed that during this phase, mixed-clone infections seemed to be harder to clear by the host immune system than single-clone infections (they had more and higher parasite peaks), suggesting an inefficient immune clearance due to the fact that the host is faced with antigenic variants of several, rather than one, parasite clones. Several malaria species, e.g. P. knowlesi (Brown & Brown, 1965), P. falciparum (Biggs et al. 1991; Roberts et al. 1992) and P. chabaudi (McLean, Macdougall & Phillips, 1990; McLean, Pearson & Phillips, 1982; Phillips et al. 1997), have been shown to undergo antigenic variation, leaving them to grow relatively unimpeded until new specific antibodies are directed against them. Bruce et al. (2000) also invoked antigenic variation, among other mechanisms, to account for sequential episodes of infection in mixed-species and -clone infections in Plasmodia infecting humans.
Regardless of the underlying mechanism, it is clear that the 3 clones suffered from being in a mixed-clone infection, and this was also true for gametocytes, the life-stages that are transmitted to mosquitoes. Never did gametocytes reach densities as predicted by the ‘Sum’ hypothesis, thus demonstrating competition in the same way as with asexual parasites. It is important to note that we looked at gametocyte numbers, not infectivity to mosquitoes: therefore we looked at potential transmission rather than actual transmission.
One notable result here was that the avirulent clone (AS) had higher total gametocyte densities than the virulent clones AT and ER. In previous studies, it was found that less virulent clones had less transmission potential than more virulent clones (Mackinnon & Read, 1999). However, the lower gametocyte production in the virulent clones in this experiment was entirely due to there being no gametocytes during the acute phase when red blood cell density was very low (days 10–12). A similar cost to gametocytogenesis of high virulence, possibly mediated through red blood cell supply, was observed by Mackinnon et al. (2002).
Our results are in some ways in contrast with previous experiments carried out in P. chabaudi. In the current experiment, mice with mixed-clone infections had as much weight and red blood cell loss as predicted under the ‘Average virulent’ hypothesis. This is in contrast to Taylor et al. (1998), who found an increased virulence of mixed infections of 2 similarly virulent P. chabaudi clones. Timms (2001) also found that virulence increased with some 2-clone infections, but not with other clone pairs.
We also found that the per clone potential transmission in the current experiment was lower in mixed-clone infections than in single-clone infections, whereas Taylor et al. (1997) found that the 2 clones in a mixed-clone infection produced more gametocytes and infected more mosquitoes than when on their own. Transmission from mixed-clone infections might truly be variable: Ferguson & Read (2002), for example, showed higher gametocyte production in mixed-clone infections in one replicate, but not in the other replicate of an experiment. In the field, different relationships between diversity of infections and virulence are also common (Read & Taylor, 2001).
It is, however, equally possible that different combinations of clones and different numbers of clones have different outcomes for clone competition, transmission and virulence. We are currently developing the techniques in our lab to study a whole range of clone combinations to address this question. This is a necessary step if we are ever to understand the impact of mixed-clone infections on virulence in the field.
We thank the staff of the March Animal House, University of Edinburgh, for excellent animal husbandry, and R. Carter, H. Ferguson, A. Graham, T. Lamb, the editor and 2 anonymous referees for helpful comments on an earlier version of this manuscript. This work was supported by the BBSRC, the University of Edinburgh and the Leverhulme Trust. Support for J. C. DR. was kindly provided by the Stichting Wagenings Universiteits Fonds, the Hendrik Muller's Vaderlandsch Fonds, and the Fundatie van de Vrijvrouwe van Renswoude te Delft, the Netherlands. The Darwin Trust of Edinburgh funded J. C. DR. for the final stages of this research.
References
REFERENCES
ARNOT, D.
(
1998).
Clone multiplicity of Plasmodium falciparum infections in individuals exposed to variable levels of disease transmission.
Transactions of the Royal Society of Tropical Medicine and Hygiene 92, 580–585.CrossRefGoogle Scholar
BABIKER, H. A.,
CREASEY, A. M.,
FENTON, B.,
BAYOUMI, R. A. L.,
ARNOT, D. E. &
WALLIKER, D.
(
1991).
Genetic diversity of Plasmodium falciparum in a village in eastern Sudan. 1. Diversity of enzymes, 2d-PAGE proteins and antigens.
Transactions of the Royal Society of Tropical Medicine and Hygiene 85, 572–577.CrossRefGoogle Scholar
BABIKER, H. A.,
RANFORD-CARTWRIGHT, L. C. &
WALLIKER, D.
(
1999).
Genetic structure and dynamics of Plasmodium falciparum infections in the Kilombero region of Tanzania.
Transactions of the Royal Society of Tropical Medicine and Hygiene 93, S11–S14.CrossRefGoogle Scholar
BEALE, G. H.,
CARTER, R. &
WALLIKER, D.
(
1978).
Genetics. In
Rodent Malaria (ed. Killick Kendrick, R. & Peters, W.), pp. 213–246.
Academic Press,
London.CrossRef
BIGGS, B.-A.,
GOOZÉ, L.,
WYCHERLEY, K.,
WOLLISH, W.,
SOUTHWELL, B.,
LEECH, J. H. &
BROWN, G. V.
(
1991).
Antigenic variation in Plasmodium falciparum.
Proceedings of the National Academy of Sciences, USA 88, 9171–9174.CrossRefGoogle Scholar
BROWN, K. N. &
BROWN, I. N.
(
1965).
Immunity to malaria: antigenic variation in chronic infections of Plasmodium knowlesi.
Nature, London 208, 1286–1288.CrossRefGoogle Scholar
BRUCE, M. C.,
DONNELLY, C. A.,
ALPERS, M. P.,
GALINSKI, M. R.,
BARNWELL, J. W.,
WALLIKER, D. &
DAY, K. P.
(
2000).
Cross-species interactions between malaria parasites in humans.
Science 287, 845–848.CrossRefGoogle Scholar
CONWAY, D. J.,
GREENWOOD, B. M. &
McBRIDE, J. S.
(1991).
The epidemiology of multiple-clone Plasmodium falciparum infections in Gambian patients.
Parasitology 103, 1–6.CrossRefGoogle Scholar
COX, F. E. G.
(1988).
Major models in malaria research: rodent. In
Malaria: Principles and Practice of Malariology (ed. Wernsdorfer, W. H. & McGregor, I.), pp. 1503–1543. Churchill Livingstone,
Edinburgh.
FELGER, I.,
SMITH, T.,
EDOH, D.,
KITUA, A.,
ALONSO, P.,
TANNER, M. &
BECK, H. P.
(
1999).
Multiple Plasmodium falciparum infections in Tanzanian infants.
Transactions of the Royal Society of Tropical Medicine and Hygiene 93, S29–S34.CrossRefGoogle Scholar
FERGUSON, H. M. &
READ, A. F.
(
2002).
Genetic and environmental determinants of malaria parasite virulence in mosquitoes.
Proceedings of the Royal Society of London, Series B 269, 1217–1224.CrossRefGoogle Scholar
JACOBS, R. L.
(
1964).
Role of p-aminobenzoic acid in Plasmodium berghei infection in the mouse.
Experimental Parasitology 15, 213–225.CrossRefGoogle Scholar
JAKEMAN, G. N.,
SAUL, A.,
HOGARTH, W. L. &
COLLINS, W. E.
(
1999).
Anaemia of acute malaria infections in non-immune patients primarily results from destruction of uninfected erythrocytes.
Parasitology 119, 127–133.CrossRefGoogle Scholar
JARRA, W. &
BROWN, K. N.
(
1989).
Protective immunity to malaria: studies with cloned lines of rodent malaria in CBA/Ca mice. IV. The specificity of mechanisms resulting in crisis and resolution of the primary acute phase parasitaemia of Plasmodium chabaudi chabaudi and P. yoelii yoelii. Parasite Immunology 11, 1–13.Google Scholar
LI, C.,
SEIXAS, E. &
LANGHORNE, J.
(
2001).
Rodent malarias: the mouse as a model for understanding immune responses and pathology induced by the erythrocytic stages of the parasite.
Medical Microbiology and Immunology 189, 115–126.CrossRefGoogle Scholar
MACKINNON, M. J.,
GAFFNEY, D. J. &
READ, A. F.
(
2002).
Virulence of malaria parasites: host genotype by parasite genotype interactions.
Infection, Genetics and Evolution 1, 287–296.CrossRefGoogle Scholar
MACKINNON, M. J. &
READ, A. F.
(
1999).
Genetic relationships between parasite virulence and transmission in the rodent malaria Plasmodium chabaudi.
Evolution 53, 689–703.CrossRefGoogle Scholar
McLEAN, S. A.,
MACDOUGALL, L. M. &
PHILLIPS, R. S.
(
1990).
Early appearance of variant parasites in Plasmodium chabaudi infections.
Parasite Immunology 12, 97–103.CrossRefGoogle Scholar
McLEAN, S. A.,
PEARSON, C. D. &
PHILLIPS, R. S.
(
1982).
Plasmodium chabaudi: evidence of antigenic variation during recrudescent parasitaemias in mice.
Experimental Parasitology 54, 296–300.CrossRefGoogle Scholar
MENENDEZ, C.,
FLEMING, A. F. &
ALONSO, P. L.
(
2000).
Malaria-related anaemia.
Parasitology Today 16, 469–476.CrossRefGoogle Scholar
MOTA, M. M.,
NEIL BROWN, K.,
HOLDER, A. A. &
JARRA, W.
(
1998).
Acute Plasmodium chabaudi chabaudi malaria infection induces antibodies which bind to the surfaces of parasitized erythrocytes and promote their phagocytosis by macrophages in vitro.
Infection and Immunity 66, 4080–4086.Google Scholar
PHILLIPS, R. S.,
BRANNAN, L. R.,
BALMER, P. &
NEUVILLE, P.
(
1997).
Antigenic variation during malaria infection – the contribution from the murine parasite Plasmodium chabaudi.
Parasite Immunology 19, 427–434.CrossRefGoogle Scholar
READ, A. F. &
TAYLOR, L. H.
(
2001).
The ecology of genetically diverse infections.
Science 292, 1099–1102.CrossRefGoogle Scholar
ROBERTS, D. J.,
CRAIG, A. G.,
BERENDT, A. R.,
PINCHES, R.,
NASH, G.,
MARSH, K. &
NEWBOLD, C. I.
(
1992).
Rapid switching to multiple antigenic and adhesive phenotypes in malaria.
Nature, London 357, 689–692.CrossRefGoogle Scholar
SAS/STAT. (1990).
User's Guide (Version 6.0).
SAS Institute, Cary, NC, USA.
SMITH, T.,
BECK, H. P.,
KITUA, A.,
MWANKUSYE, S.,
FELGER, I.,
FRASER-HURT, N.,
IRION, A.,
ALONSO, P.,
TEUSCHER, T. &
TANNER, M.
(
1999).
Age dependence of the multiplicity of Plasmodium falciparum infections and of other malariological indices in an area of high endemicity.
Transactions of the Royal Society of Tropical Medicine and Hygiene 93, S15–S20.CrossRefGoogle Scholar
SNOUNOU, G.,
JARRA, W.,
VIRIYAKOSOL, S.,
WOOD, J. C. &
BROWN, K. N.
(
1989).
Use of a DNA probe to analyse the dynamics of infection with rodent malaria parasites confirms that parasite clearance during crisis is predominantly strain- and species-specific.
Molecular and Biochemical Parasitology 37, 37–46.CrossRefGoogle Scholar
TAYLOR, L. H.,
MACKINNON, M. J. &
READ, A. F.
(
1998).
Virulence of mixed-clone and single-clone infections of the rodent malaria Plasmodium chabaudi.
Evolution 52, 583–591.CrossRefGoogle Scholar
TAYLOR, L. H.,
WALLIKER, D. &
READ, A. F.
(
1997).
Mixed-genotype infections of malaria parasites: within-host dynamics and transmission success of competing clones.
Proceedings of the Royal Society of London, Series B 264, 927–935.CrossRefGoogle Scholar
TAYLOR, L. H.,
WALLIKER, D. &
READ, A. F.
(
1997).
Mixed-genotype infections of the rodent malaria Plasmodium chabaudi are more infectious to mosquitoes than single-genotype infections.
Parasitology 115, 121–132.CrossRefGoogle Scholar
TAYLOR-ROBINSON, A. W.
(
1995).
Regulation of immunity to malaria: valuable lessons learned from murine models.
Parasitology Today 11, 334–342.CrossRefGoogle Scholar
TIMMS, R.
(2001).
The ecology and evolution of virulence in mixed infections of malaria parasites. Ph.D. thesis, University of Edinburgh.
YAP, G. S. &
STEVENSON, M. M.
(
1994).
Blood transfusion alters the course and outcome of Plasmodium chabaudi AS infection in mice.
Infection and Immunity 62, 3761–3765.Google Scholar
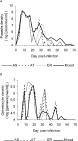
Fig. 1. Average log10 asexual parasite density (A) and log10 gametocyte density (B) through time in mice infected with either clone AS, AT or ER of Plasmodium chabaudi or a mixture of these 3 clones. Numbers represent the means of 4 mice (AS), 5 mice (AT, ER) and 19 mice (Mixed). Because parasite and gametocyte densities of 0 were set to 104 (see text), the y-axis starts at 4.
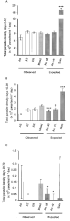
Fig. 2. (A) Total number of asexual parasites produced during the acute phase of infection (days 0–12) for single-clone infections (AS, AT, ER), mixed-clone infections (Mixed) and the predicted numbers based on the ‘Average all’ (Av. all), ‘Average virulent’ (Av. vir.) and ‘Sum’ (Sum) hypotheses. Bars represent ±1 S.E. Significance levels for testing whether predicted values under the ‘Average all’, ‘Average virulent’ or ‘Sum’ hypotheses differ from ‘Mixed’ are denoted as: ***P<0·001; **0·001

Fig. 3. Best-fit regression lines between parasite density at primary and recrudescent peaks (log10 transformed) and day p.i. for mice infected with single-clone infections (—— [lozf ], [squf ], [utrif ]) or mixed-clone infections of Plasmodium chabaudi clones AS, AT and ER (–––, ○).
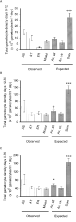
Fig. 4. (A) Total number of gametocytes produced during the acute phase of infection (days 0–12) for single-clone infections (AS, AT, ER), mixed-clone infections (Mixed) and the predicted numbers based on the ‘Average all’ (Av. all), ‘Average virulent’ (Av. vir.) and ‘Sum’ (Sum) hypotheses. See Fig. 2 (A) for a description of annotations. (B) As for (A), but for chronic phase (days 12–70). (C) As for (A), but for the whole course of infection (days 0–70).
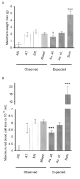
Fig. 5. Maximum weight loss (A) and maximum red blood cell loss (B) in single-clone infections (AS, AT, ER), mixed-clone infections (Mixed) and as predicted under the ‘Average all’ (Av. all), ‘Average virulent’ (Av. vir.) and ‘Sum’ (Sum) hypotheses. See Fig. 2 (A) for a description of annotations.
 You have
Access
- 64
- Cited by