


Introduction
In the first trimester of 2020, the novel severe acute respiratory syndrome coronavirus-2 (SARS-CoV-2) spread rapidly worldwide, leading the World Health Organization to declare a pandemic on 11th March 2020.1 The exponential growth of infections in the early stages of the pandemic necessitated that services be diverted to manage the influx of patients with coronavirus disease 2019 (Covid-19) who required hospital and emergency care, and routine, non-urgent clinics and operations were put on hold.Reference Vukkadala, Qian, Holsinger, Patel and Rosenthal2–Reference Boccalatte, Larrañaga, Perez Raffo, Teijido, García Fornari and Staneloni4 It also resulted in a plethora of guidance and opinion from surgical societies and regulatory bodies in relation to safe otolaryngology practice during the pandemic and appropriate levels of personal protective equipment (PPE). These were based initially on anecdotal evidence from experiences in China, Italy and Iran, early centres of the pandemic, as well as historical literature on the recent severe acute respiratory syndrome, Middle East respiratory syndrome coronavirus and H1N1 (‘swine flu’) viral epidemics.Reference Patel, Fernandez-Miranda, Hwang, Nayak, Dodd and Sajjadi5–Reference de Wit, van Doremalen, Falzarano and Munster8
Early reports suggested high rates of infection among otolaryngologists in comparison to other healthcare workers.Reference Vukkadala, Qian, Holsinger, Patel and Rosenthal2,Reference Patel, Fernandez-Miranda, Hwang, Nayak, Dodd and Sajjadi5,Reference Xu, Lai and Liu9,Reference Remuzzi and Remuzzi10 This was considered to be related to a variety of aerosol-generating procedures (AGPs) routinely performed in otolaryngology practice involving the examination and instrumentation of areas with proven high viral loads, such as the nose, nasopharynx and oropharynx.Reference Boccalatte, Larrañaga, Perez Raffo, Teijido, García Fornari and Staneloni4,Reference Zou, Ruan, Huang, Liang, Huang and Hong11 These range from office-based procedures such as flexible nasopharyngolaryngoscopy, nasal packing and quinsy drainage, to operative procedures such as intubation or extubation, tracheostomy, microlaryngoscopy, middle-ear and mastoid surgery, and endoscopic sinus and skull base surgery. The latter are associated with a higher risk of infection.Reference Patel, Fernandez-Miranda, Hwang, Nayak, Dodd and Sajjadi5,Reference Chen, Workman, Chari, Jung, Kozin and Lee12,Reference Workman, Welling, Carter, Curry, Holbrook and Gray13
While available evidence suggests that the transmission of SARS-CoV-2 is primarily through respiratory droplets and fomites, there is no consensus. Little research is available on the risk of specific otolaryngological procedures, and conflicting information persists among regulatory bodies as to the degree of protection required for AGPs.Reference Sharma, Rubel, Ye, Shipchandler, Wu and Higgins14–16 Moreover, recent reports support the capacity of coronavirus to act as an ‘opportunistic’ airborne pathogen during favourable conditions such as AGPs.Reference Morawska and Cao17–19 It has been proposed that measuring the level of aerosolised viral particles in rooms where AGPs are being performed on patients with Covid-19 could provide indirect evidence of the degree to which these procedures put healthcare workers at risk of aerosolised transmission, and whether exposure concentration affects risk of infection and severity of disease.
More specifically, in relation to functional endoscopic sinus surgery (FESS) and anterior skull base surgery, there are concerns that the use of suctioning, bipolar diathermy, microdebriders and drills can cause significant aerosol generation and a high risk of transmission to healthcare practitioners, necessitating the use of high-grade PPE (including powered air-purifying respirators and filtering facepiece code 3 (FFP3) respirators).Reference Jenkins20–Reference Lo, Yang Teo and Ang22 This was recently highlighted in a case of endoscopic transnasal pituitary surgery in China, wherein all 14 individuals who entered the operating theatre during the procedure later became infected despite the use of N95 masks intra-operatively.Reference Patel, Fernandez-Miranda, Hwang, Nayak, Dodd and Sajjadi5 Recent simulation models of FESS and anterior skull base surgery using cadaveric models, fluorescein and digital cameras experimentally demonstrated aerosol formation and the spread of microdroplets as small as 20 μm (method-related limit of detection), further supporting the risk of viral transmission intra-operatively via aerosol or microdroplets.Reference Workman, Welling, Carter, Curry, Holbrook and Gray13,Reference Sharma, Rubel, Ye, Shipchandler, Wu and Higgins14
In this context, measures to reduce the risk to operating theatre staff have been proposed by surgical societies, such as avoidance of powered instruments and diathermy, negative pressure rooms, and use of powered air-purifying respirators. Rokade et al.Reference Rokade, Burgess, Ismail Koch, Tsagkovits and Ioannidis23 introduced the use of a microscope drape technique as an additional barrier to ‘isolate’ the operating field and minimise aerosol spread in the operating theatre environment. These authors anecdotally reported using this technique to perform an endoscopic endonasal biopsy of a nasal tumour in a patient with unknown Covid-19 status. This study explored the efficacy of this techniqueReference Rokade, Burgess, Ismail Koch, Tsagkovits and Ioannidis23 in minimising the spread of particles as small as 0.3 μm by using an air particle counter. We also discuss the possible implications regarding the potential risk of viral transmission, and the level of required PPE during FESS and anterior skull base surgery.
Materials and methods
For the present experimental study, the microscope drape technique was used to ‘isolate’ the surgical field around a manikin, as described on the ENT UK website (Figure 1).Reference Rokade, Burgess, Ismail Koch, Tsagkovits and Ioannidis23 In order to assess the efficacy of the draping technique in reducing aerosol spread to the wider operating theatre environment, we initially used visual identification of potential leakage of smoke produced, within the drape, by a CMI Concept Air Trace MK2 smoke generator (Saintes, Belgium) in the low output mode (Figure 2). Air particle levels in the operating theatre environment were measured prior to, during and after the experiment with the use of a Fluke 985 airborne particle counter capable of measuring particles sized 0.3–10 μm.
Experimental setup, with the smoke generator within the drape and the air particle counter on the right side of the surgeon.

Smoke generation within the drapes to ensure no visual leaks and a ‘tight seal’.
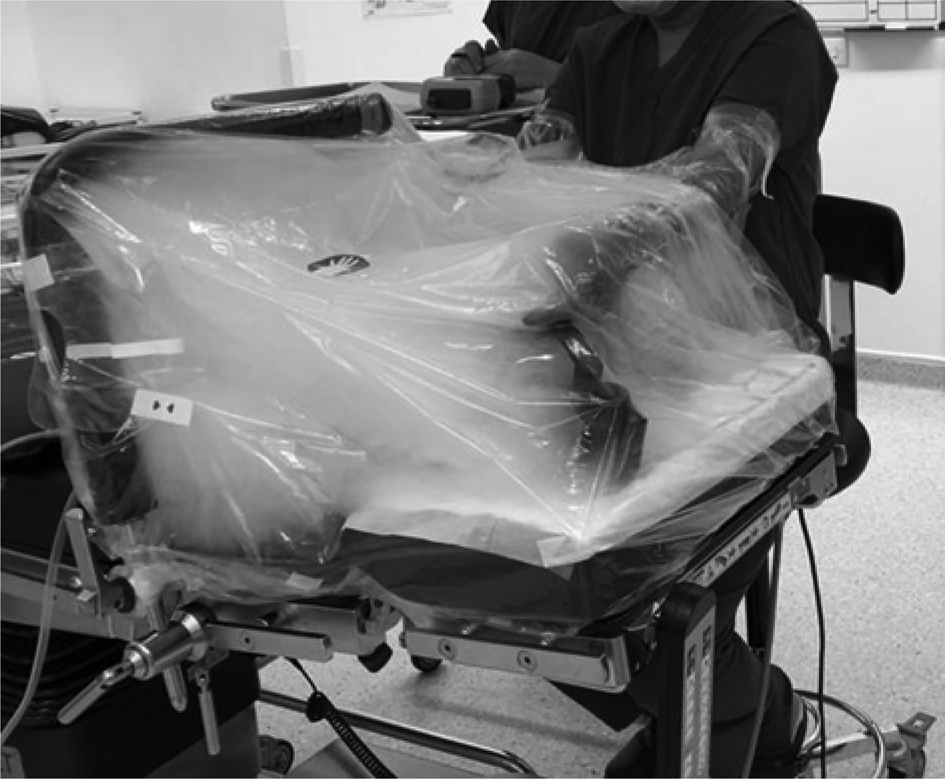
Visual observation during and after smoke generation within the drape identified ‘weak points’ prone to leakage. These weak points were located at the: (1) attachment of the drape supporting the arm to the operating table; (2) gaps between the body of the operating table and the articulated head of the operating table; and (3) the attachment of the drape to the surgeon's upper arms. The weak points were reinforced by using surgical adhesive tape around weak points 1 and 3, and a plastic surgical mat at the junction of the head and the main body of the bed (to address weak point 2), in order to achieve a ‘tight seal’. After these modifications, no visibly identifiable leaks were detected.
Measurements of air particles were obtained using the Fluke 985 airborne particle counter positioned in proximity to the operating surgeon (on the right side at the level of the surgeon's mouth). Measurements within and outside the drape were collected prior to smoke generation (5-minute baseline measurements) and after smoke generation. Smoke was generated within the drape, with the smoke generator positioned at the level of the manikin's nose. Smoke generation lasted for 1 minute – prior to measurements – for each experimental condition: using a drape without suction, or using a drape with suction. A viral heat and moisture exchanger (‘HME’) filter was attached to the suction system (VacSax BactiClear® Antimicrobial PreGelled Liner System). The experiment was repeated without a drape for comparisons. Measurements were carried out until the particle count in the operating theatre environment returned to pre-experiment levels. Those measurements recorded for the first 10 minutes of each experimental condition, either within or outside the drape, were analysed.
Statistical analysis of the collected data was performed; the Mann–Whitney test was employed to compare particle counts for each technique, using R statistical software, version 4.0.2.24
Results
The mean air particle count in the operating theatre for the 5 minutes prior to the experiment was 1914 (standard deviation (SD) = 54; maximum count of 2024) for 0.3 μm particles, and 91 (SD = 8; maximum count of 100) for 0.5 μm particles. The mean count values for particles sized 1 μm, 2 μm, 5 μm and 10 μm were 17 (SD = 8), 8 (SD = 3), 3 (SD = 2) and 2 (SD = 2) respectively.
For simplicity, we report and analyse the data for particles sized 0.3 μm and 0.5 μm, which vastly outnumbered the bigger particles.
After 1 minute of smoke generation within the drape (‘tight seal’ setup), there was no visible leak identified macroscopically. Over a 10-minute period of observation, the air particle counter showed a count elevation to a mean of 6102, with a maximum count of 28 906, for particles sized 0.3 μm (approximately 14 times higher than the pre-experiment baseline maximum value), and mean count of 1023, with a maximum count of 5947, for particles sized 0.5 μm (approximately 59 times higher than the pre-experiment baseline maximum value) (Figure 3).
Particle count measurements in the operating theatre environment, using the microscope drape technique (with a tight seal), for 10 minutes after smoke generation within the drape, shown according to (a) linear and (b) logarithmic scales. (Y-axes represent total particle counts measured for each 30-second timeframe shown on the x-axes.)

Repeating the experiment with a second suction on within the drapes led to a particle count mean of 2001, with a maximum count of 2101, for particles sized 0.3 μm, and a mean count of 101, with a maximum count of 124, for particles sized 0.5 μm, which are only marginally higher values than those recorded during the operating theatre pre-procedure baseline.
A count of the air particles within the drapes led to a steep and swift rise to above 1 000 000 (off the scale for the air particle counter in use), and remained as such for the 10-minute period of measurement and observation (with macroscopically visible smoke within the drapes).
Repeating the process with the suction system turned on led to a less steep increase in particle count to above 1 000 000, with the air particle count dropping down to pre-procedure levels after 8 minutes (Figure 4).
Particle count measurements within the drape, with suction on, for 10 minutes after smoke generation, shown according to (a) linear and (b) logarithmic scales. (Y-axes represent total particle counts measured for each 30-second timeframe shown on the x-axes.)

For comparison purposes and to assess the benefit of reducing the spread of aerosols to the wider operating theatre environment, we repeated the experiment, generating smoke for 1 minute using the same setup. This was performed after removing the drape and after the air particle count in the operating theatre had dropped to pre-experiment levels. The mean air particle count for the 10-minute observation period was 42 990, reaching a maximum count of 312 464, for particles sized 0.3 μm (approximately 154 times higher in comparison to the maximum at baseline).The mean count for particles sized 0.5 μm was 2121, with a maximum count of 15 998 (approximately 160 times higher in comparison to the maximum at baseline). Aerosols dropped to pre-experiment levels after approximately 7.5 minutes (Figure 5).
Particle count measurements in the operating theatre environment, without the drape in place, for 10 minutes after smoke generation, shown according to (a) linear and (b) logarithmic scales. (Y-axes represent total particle counts measured for each 30-second timeframe shown on the x-axes.)

The Mann–Whitney test indicated that the number of particles sized 0.3 μm in the operating theatre when using the drape and suction (median count of 1997) was significantly lower compared to not using any barrier measure (median count of 4096) (U = 396, p < 0.05)). The findings were similar for particles sized 0.5 μm, whereby the concurrent use of the drape and suction significantly lowered the number of particles in the operating theatre (174.5 vs 100.5, U = 383.5, p < 0.05). The median count values for each experimental setup are summarised in Table 1 and in the Figure 6 boxplot.
Boxplot showing the particle count (logarithmic scale) within the operating theatre (horizontal black lines represent median values and boxes reflect interquartile ranges).

Median particle count in operating theatre

Data represent median particle count (interquartile range)
The data suggest that aerosolisation in the wider operating theatre environment can be kept to a bare minimum with the microscope drape method, especially after adding a second suction within the drape tent. Adding a viral filter would in theory prevent the spread of virus particles within the suction system and canister. It could also reduce potential aerosol spread when removing the drapes.
Discussion
As practitioners begin to entertain a reverse surge in routine practice, knowledge of how AGPs in general and endonasal surgery in particular generate droplets and aerosols is paramount in establishing safe protocols and keeping healthcare providers and patients safe.
It is known that respiratory infections can be transmitted through droplets of various sizes containing infectious viral particles called virions. Coughing and sneezing have been documented to generate microdroplets, ranging from less than 1 μm to 500 μm in size, with more than 99 per cent of particles being less than 8 μm in size.Reference Thompson, Pappachan, Bennett, Mittal, Macken and Dove7,Reference Seto25 Ninety-seven per cent of SARS-CoV-2 aerosol particles have an aerodynamic diameter of less than 1 μm (range, 0.1–900 μm), with a dominant size of between 0.25 μm and 0.5 μm.Reference Liu, Ning, Chen, Guo, Liu and Gali26 Particles of more than 5 μm in diameter are referred to as respiratory droplets and those less than 5 μm in diameter are referred to as droplet nuclei. The latter remain in suspension longer than the former, and can spread greater distances.Reference Jotz, Voegels and Bento27
Current evidence suggests that SARS-CoV-2 in the community setting is transmitted primarily through respiratory droplets and fomites (touching a contaminated surface and then touching one's mouth or nose).Reference Iorio-Morin, Hodaie, Sarica, Dea, Westwick and Christie28 Airborne transmission is defined as ‘the spread of an infectious agent caused by the dissemination of droplet nuclei that remain infectious when suspended in the air over long distances and time’. Airborne transmission of SARS-CoV-2 remains controversial, but a growing number of recent papers support its feasibility – although rare – in favourable conditions such as AGPs (an opportunistic airborne pathogen).29
Many procedures within the otolaryngology clinical practice setup involve examination of, and use of instrumentation in, areas suspected to carry high viral loads; namely, the nose, nasopharynx and oropharynx.Reference Zou, Ruan, Huang, Liang, Huang and Hong11 ENT UK has generated a list of procedures considered to be AGPs,Reference Al-Jabir, Kerwan, Nicola, Alsafi, Khan and Sohrabi30,31 which can result in the contamination of surfaces and personnel with virus-loaded droplets.
Once outside of the contaminated host, SARS-CoV-2 virions can remain airborne for more than 3 hours,Reference Zou, Ruan, Huang, Liang, Huang and Hong11,Reference van Doremalen, Bushmaker, Morris, Holbrook, Gamble and Williamson32 with a half-life of 1.1 hours in aerosols.Reference Jotz, Voegels and Bento27,Reference van Doremalen, Bushmaker, Morris, Holbrook, Gamble and Williamson32 Emerging evidence suggests that Covid-19 is viable in aerosolised droplet nuclei and that a larger infective dose (which may result from prolonged exposure during long procedures) may increase the disease severity.Reference Mick and Murphy33 As per a recent paper by Guo et al.,Reference Guo, Wang, Zhang, Li, Li and Li34 the transmission distance of SARS-CoV-2 aerosol might reach 4 m. The same study also found that ‘SARS-CoV-2 was widely distributed in the air and on object surfaces in both the intensive care unit and general ward, implying a potentially high infection risk for medical staff and other close contacts’.Reference Mick and Murphy33,Reference Guo, Wang, Zhang, Li, Li and Li34
Functional endoscopic sinus surgery, and anterior skull base surgery more specifically, typically entail manoeuvres and instrumentation employed in or through high viral load areas, which can cause aerosolisation of viral particles in the mucosa.Reference Boccalatte, Larrañaga, Perez Raffo, Teijido, García Fornari and Staneloni4,Reference Jenkins20 The use of drills, microdebriders, electrocautery, advanced energy devices and suctioning further promotes aerosol formation and the possible shedding of infectious microdroplets throughout the operating theatre.Reference Boccalatte, Larrañaga, Perez Raffo, Teijido, García Fornari and Staneloni4,35 The concern is greater in anterior skull base surgery where the extensive and lengthy use of power instruments in contact with blood or bone, along with the aggressive disruption of potentially virus-containing mucosa, has been postulated to present an even higher risk of transmission to the healthcare team.Reference Lo, Yang Teo and Ang22,Reference Matava, Yu and Denning36,Reference Wang, Xu, Gao, Lu, Han and Wu37
Sharma et al.Reference Sharma, Rubel, Ye, Shipchandler, Wu and Higgins14 recently used an experimental cadaveric model and fluorescein to simulate and investigate droplet and splatter patterns resulting from common endoscopic endonasal procedures. The authors reported no observable fluorescein droplets or splatter in the measured surgical field after nasal endoscopy, septoplasty with microdebrider-assisted turbinoplasty, cold-steel FESS, and all experimental conditions using an ultrasonic aspirator. Limited droplet spread was reported when: using the microdebrider in FESS, drilling the sphenoid rostrum with a diamond burr or drilling the frontal beak with a cutting burr. The addition of concurrent suctioning while drilling also resulted in no noticeable droplet or splatter spread. The control condition of external activation of the drill resulted in gross contamination.Reference Sharma, Rubel, Ye, Shipchandler, Wu and Higgins14 These results, however reassuring, are restricted by the detectable particle size limit; the study did not formally assess the generation and potential shedding of smaller, non-visible air particles.
Workman et al.Reference Workman, Welling, Carter, Curry, Holbrook and Gray13 also used an experimental cadaveric model to demonstrate the aerosol spread during various surgical procedures. The researchers applied fluorescein inside the nasal cavity of cadaveric specimens, and measured aerosol spread outside of the nostrils during different procedures using a blue-light filter and digital image processing. The authors pointed out that aerosol production during endonasal surgery represents a unique condition that fundamentally differs from all other AGPs, as it occurs in the setting of an occluded lower airway. They suggested that the aerosol generation risk, particle size and transmission distance are entirely dependent on the instruments used. The authors found that cold surgical instrumentation and microdebrider use posed a significantly lower risk of aerosolisation in comparison to drilling with a high-speed burr.Reference Workman, Welling, Carter, Curry, Holbrook and Gray13 They reported that the intranasal drilling produced fluorescein aerosols that could be detected up to 60 cm from the nostrils. This was not observed with either cold instrumentation or use of a microdebrider. Based on these observations, these authors advised minimising the use of powered instruments when feasible, favouring the use of rongeurs and curettes over drilling with a burr. The authors did, however, caution on the limitations of their simulation model, which was capable of detecting particles no smaller than 20 μm, and as a result they did not assess the presence of smaller particles in the aerosols. These particles could potentially be generated when using a microdebrider and cold surgical instrumentation, and shed in longer distances. The risk for potential airborne transmission via virion-infected droplet nuclei smaller than 20 μm was not formally assessed in that study.Reference Workman, Welling, Carter, Curry, Holbrook and Gray13
The main objective of the present study was to simulate the generation of (micro)droplet nuclei as small as 0.3 μm during FESS, and assess the potential benefit of minimising or mitigating the spread of (micro)droplet nuclei – postulated to be generated during FESS or anterior skull base surgery – to the wider operating theatre environment, prior to widely adopting it in routine surgical practice. The spread of air particles was minimised by using an additional barrier consisting of a microscope drape covering the surgical field, as described by Rokade et al.Reference Rokade, Burgess, Ismail Koch, Tsagkovits and Ioannidis23 In order to avoid limitations (similar to those described above) in our simulation setup, we opted to use an air particle counter capable of detecting particles sized 0.3–10 μm in the operating theatre environment and a smoke generator capable of producing air particles within the 0.3–10 μm range.
Our results suggest that the microscope drape barrier is effective in minimising the spread of air particles produced within the drape in the wider operating theatre environment, especially if a second suction, attached to an antiviral filter to prevent viral particle shedding within the suction tubing, is used within the drape. Careful removal of the drape along with the surgical drapes covering the patient prevents particle shedding in the wider room, as demonstrated by a lack in increase of air particles in the operating theatre environment observed upon careful drapes removal.
Obvious limitations of our study include the experimental simulation setup, the inability of the air particle counter to detect particles smaller than 0.3 μm (SARS-CoV-2 aerosol particles range from 0.1 μm to 900 μmReference Liu, Ning, Chen, Guo, Liu and Gali26) and the fact that it does not specifically detect viable virions. In addition, it is not known whether the use of a smoke generator accurately mimics aerosol formation during endonasal surgery involving drilling, microdebrider use, diathermy and so on.
• Endoscopic sinus and anterior skull base surgery is high risk for severe acute respiratory syndrome coronavirus-2 transmission in the operating theatre
• The microscope drape method was introduced to minimise aerosol spread in the operating theatre environment
• The method's efficacy was assessed with a simulation model, using an air particle counter measuring air particles sized 0.3–10 μm, in an experimental setting
• Aerosol spread was contained almost to baseline levels with the drape barrier and negative pressure created by suction within the drape
• The technique could help reduce the risk of aerosol shedding and viral transmission
• It could potentially allow quicker operating theatre turnover time and more liberal use of powered instruments during endonasal surgery
The fact that the air particle count remained fairly stable before, during and after the procedure when a second suction was used indicates that the technique is efficient and safe to use in a clinical setting. However, there is not currently adequate evidence to suggest that it alone is sufficient to ensure zero aerosol spread outside the drape; as such, we could not advise on reducing the level of required PPE for operating theatre staff (currently FFP3 or powered air-purifying respirator use is suggested in the UK).31 However, the technique can be used as an adjunct to improve safety in lengthy procedures involving the aggressive disruption of potentially virus-containing mucosa. This is especially important given the concerns regarding leaks in filtering facepiece code 2 masks and N95 mask respirators (used in many countries) during long procedures.Reference Mick and Murphy33
Adoption of the microscope drape technique could also result in faster operating theatre cleaning and turnover associated with the significantly reduced air particle or aerosol spread in the operating theatre by the end of the AGP, and potentially allow more liberal use of powered instruments during endonasal surgery. Furthermore, it could be argued that the use of an air particle counter in the operating theatre would be valuable for alerting staff to a potential significant aerosol leak through the drape, and assisting in decision making with respect to doffing PPE and operating theatre cleaning and turnover.
Conclusion
Endonasal surgical procedures in the form of FESS and anterior skull base surgery conducted during the SARS-CoV-2 pandemic are currently considered high risk for viral transmission to healthcare staff, because of instrumentation used in areas with proven high viral loads and the associated aerosol generation especially when using powered instruments. Consequently, all such non-urgent procedures were put on hold during the exponential growth phase of the pandemic.
Uncertainty over the exact mechanisms of virus transmission, degree of aerosolisation and amount of viral load exposure, and the lack of data on appropriate PPE, have led to precautionary approaches being adopted by the operating theatre team. These precautionary approaches include donning powered air-purifying respirator or FFP3 respirators, avoiding the use of powered instruments, having lengthy intervals between procedures, and so on, as advised by surgical societies worldwide.
As a gradual return to routine operating is being phased in within most countries, the need for clarity and evidence-based recommendations is crucial. In this context, a simple and inexpensive technique using a microscope drape to ‘isolate’ the surgical field during FESS and anterior skull base surgery has been proposed and applied by Rokade et al.Reference Rokade, Burgess, Ismail Koch, Tsagkovits and Ioannidis23 This acts as an additional barrier to minimise aerosol spread to the wider operating theatre environment. This experimental study examined the efficacy of this technique prior to adopting it more widely within a routine clinical setting. The data collected from the simulation model described above suggest that concurrent use of the drape and suction mitigate the aerosol spread, highlighting the importance of vacuum and negative pressure in the operative field. These findings could have implications regarding the level of required PPE and operating theatre turnover, and allow more liberal use of powered instruments. Further data need to be collected within the routine clinical setup before recommendations can be made.
Acknowledgements
The authors would like to thank the Royal Hampshire County Hospital operating theatre team and the University Hospital Southampton estates team.
Competing interests
None declared



