Introduction
Stroke remains a global health issue, being a leading cause of disability and mortality. In 2019, there were approximately 12·2 million incident cases of stroke, 101 million prevalent cases of stroke, 143 million disability-adjusted life years due to stroke and 6·55 million deaths from stroke globally(1). Previous studies have established a complex combination of risk factors for stroke, including hypertension, obesity, hyperlipidaemia, hyperglycaemia, smoking and genetic factors(Reference Harshfield, Georgakis and Malik2,Reference Caprio and Sorond3) . Among modifiable factors, adequate physical activity (PA) has been recognised as a key behavioural approach to stroke prevention(Reference De Santis, Romoli and Foschi4–Reference Ghozy, Zayan and El-Qushayri6). Data from the China Health and Retirement Longitudinal Study 2020 showed an association between higher total PA levels and lower odds of prevalent stroke history(Reference Jiang, Chen and Xiang7). A longitudinal UK biobank-based study showed that regular PA was associated with a lower stroke risk compared with physical inactivity(Reference Shi, Peng and Xu8). Data from a South Korea cohort showed that stroke survivors maintaining sufficient PA levels after a stroke were at a lower risk of composite adverse outcomes including all-cause mortality, stroke recurrence and myocardial infarction (adjusted hazard ratio (HR), 95 % CI 0·85, 0·80–0·90)(Reference Kang, Kim and Han9).
Diet also plays a critical role in stroke prevention. Previous studies showed that specific dietary patterns, such as the EAT-Lancet diet and Mediterranean dietary patterns, were associated with a lower stroke risk(Reference Ibsen, Christiansen and Olsen10,Reference Chen, Neelakantan and Martin-Calvo11) . Stroke survivors are often nutritionally vulnerable, with suboptimal nutrient intake and lower diet quality (DQ) compared with the general population(Reference Zoellner, Patterson and Sharrief12). DQ reflects adherence to dietary guidelines, indicating the extent to which an individual’s diet aligns with recommended dietary patterns, and lower DQ therefore reflects poorer adherence to these recommendations(Reference Krebs-Smith, Pannucci and Subar13). The Multiethnic Cohort study of 172 043 participants showed that a lower DQ, assessed using the Healthy Eating Index 2010 (HEI-2010), was associated with a higher risk of stroke death(Reference Aigner, Becher and Jacobs14). The HEI is a widely used measure of DQ that evaluates adherence to the Dietary Guidelines for Americans, and the updated HEI-2020 reflects the most recent dietary recommendations(Reference Shams-White, Pannucci and Lerman15). Previous studies have shown that higher HEI-2020 scores were associated with lower risks of cardiometabolic diseases and all-cause mortality(Reference Abdi, Karamian and Hajiloo16–Reference Chen, Lin and Shen18).
Previous works have highlighted a potential relationship between PA and DQ. Low PA, defined as <600 MET-minutes/week, equivalent to not meeting the American Physical Activity Guidelines(Reference Piercy, Troiano and Ballard19), may be associated with unhealthy diets, whereas individuals with high PA (≥600 MET-min/week, meeting PA guidelines) are more likely to choose healthier diets(Reference Tavares20). Evidence from a nationally representative analysis indicated that individuals meeting PA guidelines were more likely to adhere to a healthy diet, as assessed using the HEI(Reference Loprinzi, Smit and Mahoney21). The individual associations of PA and DQ with stroke and related adverse outcomes have been widely reported, with the higher PA levels, the lower odds of stroke and improved prognosis, and the higher DQ, the lower odds of stroke and reduced mortality(Reference Jiang, Chen and Xiang7,Reference Kang, Kim and Han9,Reference Zoellner, Patterson and Sharrief12,Reference Aigner, Becher and Jacobs14) . Prior to our analyses, some studies have examined the combined associations of these factors among non-stroke populations, including individuals with chronic conditions such as diabetes and chronic kidney disease, cancer survivors, individuals with depression, as well as general adult populations(Reference Wang, Chen and Wang22–Reference Ding, Van Buskirk and Nguyen27). However, evidence regarding their combined association with prevalent stroke remains unresolved. To address this gap in knowledge, we aimed to investigate the combined association of PA and DQ with stroke prevalence in the general population and mortality among stroke survivors using data from the National Health and Nutrition Examination Survey (NHANES). We hypothesised that (i) both higher PA and higher DQ would be independently associated with lower odds of stroke and lower mortality among stroke survivors; and (ii) combined PA and DQ profiles would show differential associations with these outcomes.
Methods
Study population
The NHANES is a nationally representative survey of the non-institutionalised US population, conducted by the National Center for Health Statistics (NCHS) at the Centers for Disease Control and Prevention (CDC)(28). All survey protocols were approved by the NCHS Research Ethics Review Board(29). This study analysed data from the NHANES 2007–2018 cycles, which initially included 59 842 participants. Exclusion criteria were as follows: age < 20 years (n 25 072) and missing information on PA (n 172), DQ (n 7858), stroke status (n 35) and other covariates (n 6480). A total of 20 225 individuals were included in the final analysis (Figure 1).
Flow chart of sample selection. NHANES, National Health and Nutrition Examination Survey; PA, physical activity; DQ, dietary quality; PIR, poverty:income ratio.

Physical activity assessment
PA level was assessed using the Global Physical Activity Questionnaire (GPAQ). Each participant’s PA was converted to metabolic equivalent (MET) minutes per week based on the WHO guidelines(Reference Bull, Al-Ansari and Biddle30). NHANES provides reference MET values corresponding to each PA category. According to the American Physical Activity Guidelines, adults should engage in at least 150 min of moderate-intensity PA per week or 75 min of vigorous-intensity PA per week, which is equivalent to 600 MET-minutes per week(Reference Piercy, Troiano and Ballard19). In the current analysis, PA was categorised into no PA (0 MET-min/week), low PA (1–599 MET-min/week) and high PA (≥600 MET-min/week)(Reference Wei, Min and Xiang24,Reference Vilar-Gomez, Nephew and Vuppalanchi31) .
Dietary quality assessment
DQ data were collected through two 24-h recall interviews conducted by a professional dietary interviewer as part of NHANES. The first interview was conducted in person, and the second interview took place via telephone, typically 3 to 10 d later. During these interviews, participants were asked to recall the types and quantities of foods and beverages consumed in the past 24 h. The dietary intake estimate was derived by averaging the data from both recall interviews. NHANES Individual Food Data and Food Pattern Equivalence Database dietary data were used to calculate the HEI-2020. Across the two dietary recall interviews, both weekday and weekend days were represented, with weekend days accounting for 43·9 % of the first recalls and 11·7 % of the second recalls. The HEI-2020 is designed to assess the quality of an individual’s diet in relation to the Dietary Guidelines for Americans 2020–2025(Reference Shams-White, Pannucci and Lerman15). It consists of thirteen components, each representing a specific aspect of a healthy eating pattern. These components include key food groups such as fruits, vegetables, whole grains, dairy products, protein foods and oils, as well as dietary factors like added sugars, saturated fats and Na intake. The index is scored on a scale from 0 to 100, with higher scores indicating diets that more closely align with the DGA recommendations, reflecting higher DQ(Reference Shams-White, Pannucci and Lerman15). The calculation of the HEI-2020 was performed using the R package DietaryIndex(Reference Wang, Yan and Zhang32,Reference Zhan, Hodge and Dunlop33) . The categories of DQ were based on the median HEI-2020 score of all participants. The lower or higher DQ was categorised according to the median HEI-2020 score of 51·12 in our study population(Reference Lin, Colvin and Kusneniwar34).
Definition of stroke and covariates
Stroke status was determined based on the response to the question, ‘Has a doctor or other health professional ever told you that you had a stroke?’ Participants who answered yes were classified as having a stroke(Reference Fan, Ma and Liu35–Reference Hassani, Ovbiagele and Markovic37). Covariates including diabetes, hypertension, hyperlipidaemia, smoking status, alcohol consumption and demographic variables associated with both the exposures and outcomes were selected by referring to prior literature(Reference Harshfield, Georgakis and Malik2,Reference Caprio and Sorond3,Reference Yue, Dong and Xie38–Reference Yu, Cao and Liu40) . Diabetes status was assessed by the question, ‘Has a doctor or other health professional ever told you that you have diabetes?’ Diabetes was categorised as ‘yes’, ‘no’ or ‘borderline’(Reference Wang, Lv and Ti41), where ‘borderline’ corresponds to participants who reported being told they had borderline diabetes(42). Hypertension and hyperlipidaemia status were based on answers to similar questions. Smoking status was determined by the response to the question, ‘Have you ever smoked at least 100 cigarettes in your lifetime?’ Participants who answered ‘yes’ (≥100 cigarettes) were classified as smokers, and those who answered ‘no’ (<100 cigarettes) were classified as non-smokers(Reference Niu, Sun and Xie43). Alcohol consumption was based on the frequency of the participant drinks. Participants who drink twelve or more times a year were classified as drinkers, and participants who drink less than twelve times a year were classified as non-drinkers(Reference Niu, Sun and Xie43). In addition, the following demographic variables were included: sex (male/female), age (years), race/ethnicity (Mexican American, other Hispanic, non-Hispanic White, non-Hispanic Black and other race), BMI (kg/m2), poverty:income ratio (PIR, ≥500 %/300–500 %/≥100–300 %/<100 %), education level (less than 9th grade, 9–11th grade, high school graduate or GED or equivalent, Some college or AA degree, and College graduate or above) and marital status (married or living with a partner v. not married or not living with a partner). All variables, including stroke status, were assessed only at baseline based on self-reported information.
Stroke mortality outcome
Information on mortality status in stroke survivors and follow-up time was collected through the National Death Index mortality database from NHANES (up to 26 April 2022). All-cause mortality (referred as deaths due to any causes) was used in this study.
Statistical analysis
Data in this study were weighted using the dietary interview sample weights provided by NHANES to account for the complex survey design of the NHANES database. Continuous variables were summarised as means and standard deviations if normally distributed, and medians with interquartile ranges (IQR) if not normally distributed. Categorical variables were presented as absolute counts with proportions. Kruskal–Wallis test and χ 2 tests were used to compare differences between groups. The OR with 95 % CI of stroke with PA and DQ in the cross-sectional analysis was assessed using multivariable logistic regression models, adjusting for potential confounders. Three models were used: model 1 adjusted for age, sex and race/ethnicity; model 2 further adjusted for BMI, PIR, education level, marital status, alcohol consumption and smoking status; and the full model 3 further adjusted for diabetes, hypertension and hyperlipidaemia. Cox proportional hazards regression models were used to calculate the HR with 95 % CI for the association of all-cause mortality with PA and DQ among stroke survivors, adjusting for potential confounding factors. Exploratory additive and multiplicative interaction analyses between PA and DQ were conducted to assess potential effect modification in their associations with stroke and mortality outcomes. We did a separate analysis by excluding participants who died within the first 24 months of follow-up to minimise the potential impact of reverse causation(Reference Wei, Min and Xiang24), since individuals with poor health at baseline may have altered behaviours and a higher short-term mortality risk.
Several sensitivity analyses were performed to test the robustness of our findings: (1) categorising PA into quartiles; (2) applying multiple imputation for missing covariate data using chained equations, with five imputed datasets generated and combined using Rubin’s rules to obtain pooled estimates (the imputation model included all covariates, exposure (PA and DQ) and outcome (stroke) variables, and missing rates were BMI: 273 [1·02 %], education level: 26 [0·10 %], PIR: 2295 [8·59 %], marital status: 12 [0·04 %], alcohol consumption: 1781 [6·67 %], smoking status: 12 [0·04 %], hypertension: 29 [0·11 %], diabetes: 13 [0·05 %], hyperlipidaemia: 2847 [10·66 %])(Reference Azur, Stuart and Frangakis44,Reference Buuren and Groothuis-Oudshoorn45) ; and (3) excluding participants aged ≤40 or 50 years(Reference Di, Liu and Xiang46). For sensitive analyses (2) and (3), DQ was re-categorised based on the median HEI-2020 score within each analytical sample (median values: 50·84 for the multiple imputation sample, and 52·42 and 53·13 for the age-restricted samples, respectively). We also used restricted cubic spline models to explore the potential non-linear associations of continuous PA and DQ scores with stroke prevalence and all-cause mortality among stroke survivors. All statistical analyses were done using R Studio software (version 4.4.1), with a two-sided P value < 0·05 considered statistically significant.
Results
Baseline characteristics of study participants
Of 20 225 participants enrolled in the final analysis, 9697 (48·2 %) were men and 10 528 (51·8 %) were women, and 838 (2·9 %) were stroke survivors. The baseline characteristics of participants, categorised by PA and DQ groups, are shown in Table 1. Participants in the different PA and DQ categories differed in age, BMI, sex, race/ethnicity, PIR, education level, marital status, alcohol consumption, smoking status and the presence of co-morbidities including diabetes, hypertension and hyperlipidaemia (p < 0·001).
Baseline characteristics of participants according to PA and DQ categories

Table 1. Long description
A table comparing baseline characteristics of participants according to physical activity (PA) and diet quality (DQ) categories. The table has 18 rows and 13 columns. Column headers include Overall, No PA and lower DQ, No PA and higher DQ, Low PA and lower DQ, Low PA and higher DQ, High PA and lower DQ, and High PA and higher DQ, each with sub-columns for count (n) and percentage (%). Row labels include Stroke/number, Age, BMI, Sex, Race, PIR, Education level, Marital status, Alcohol consumption, Smoking status, Diabetes, Hypertension, and Hyperlipidaemia. Each row provides data for different categories of participants, showing variations in age, BMI, sex, race/ethnicity, PIR, education level, marital status, alcohol consumption, smoking status, and the presence of co-morbidities including diabetes, hypertension, and hyperlipidaemia. Notable trends include differences in age, BMI, sex, race/ethnicity, PIR, education level, marital status, alcohol consumption, smoking status, and co-morbidities across different PA and DQ categories.
PA, physical activity; DQ, dietary quality; IQR, interquartile range; PIR, poverty:income ratio.
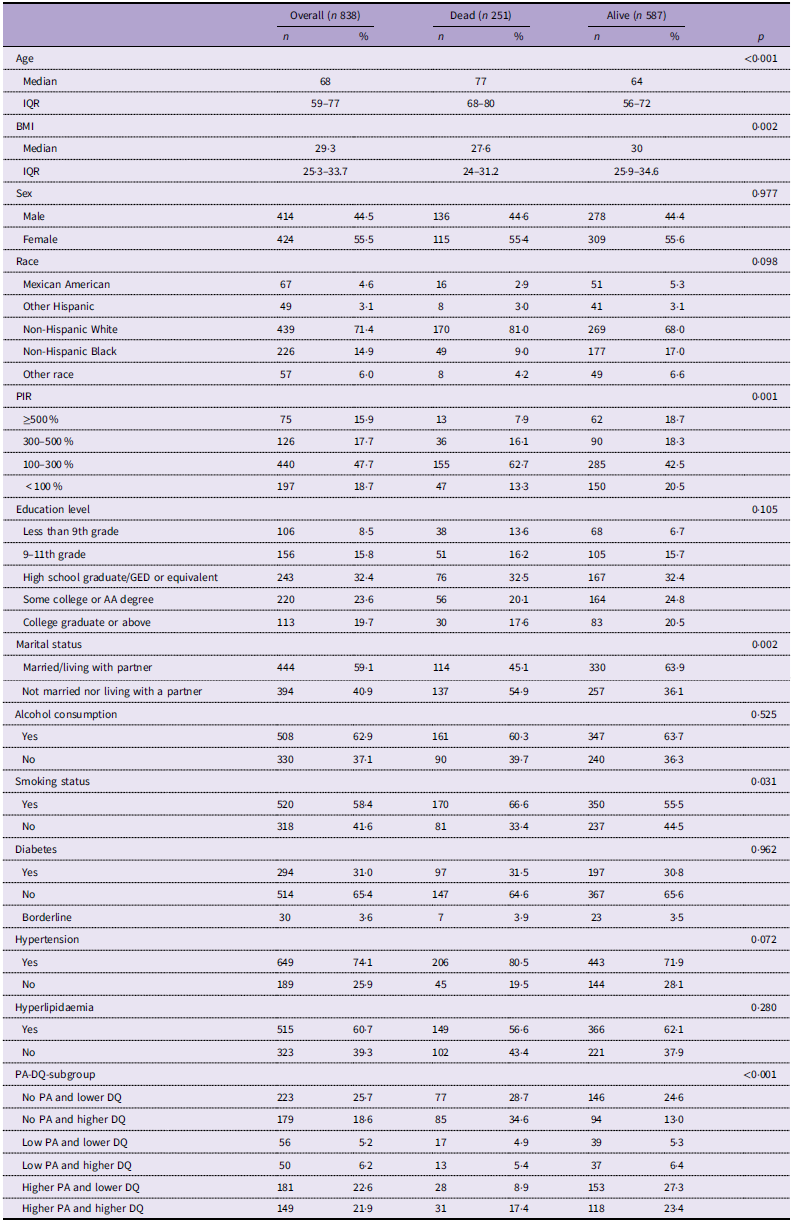
Baseline characteristics among participants with and without stroke were shown in Table 2. Participants with and without stroke differed in age, BMI, sex, race/ethnicity, PIR, education level, marital status, alcohol consumption, smoking status and the presence of co-morbidities including diabetes, hypertension and hyperlipidaemia (all p < 0·001). The distribution of combined PA and DQ categories also differed significantly between participants with and without stroke (p < 0·001).
Baseline characteristics of participants according to stroke status

Table 2. Long description
The table compares baseline characteristics of participants with and without stroke. It includes data on age, BMI, sex, race, PIR, education level, marital status, alcohol consumption, smoking status, and the presence of co-morbidities such as diabetes, hypertension, and hyperlipidaemia. The table also shows the distribution of combined physical activity and dietary quality categories. The table has 20 rows and 12 columns. Column headers include Overall, Stroke, and Non-stroke, with sub-columns for n, %, and p-values. Row labels include Age, BMI, Sex, Race, PIR, Education level, Marital status, Alcohol consumption, Smoking status, Diabetes, Hypertension, Hyperlipidaemia, and PA-DQ-subgroup. Notable trends include significant differences in age, BMI, sex, race/ethnicity, PIR, education level, marital status, alcohol consumption, smoking status, and the presence of co-morbidities between participants with and without stroke. The distribution of combined PA and DQ categories also differed significantly between the two groups.
IQR, interquartile range; PIR, poverty:income ratio; PA, physical activity; DQ, dietary quality.
Association of stroke with physical activity and diet quality
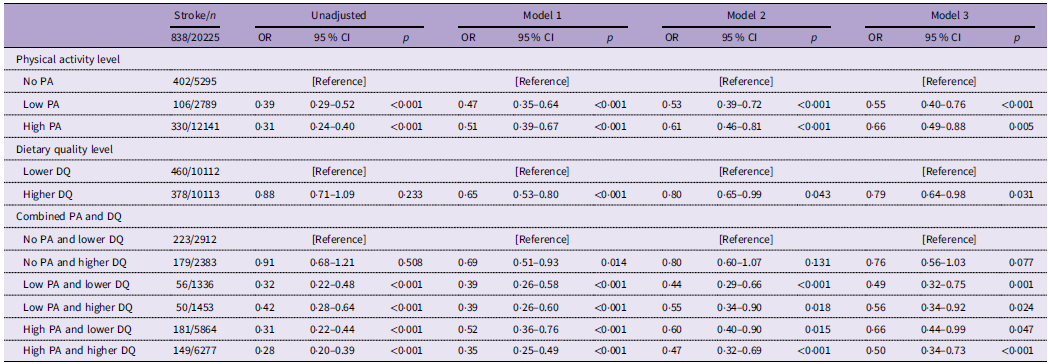
The associations of stroke with individual PA and DQ are shown in Table 3. After adjustment for age, sex, race, BMI, PIR, education level, marital status, alcohol consumption, smoking status, diabetes, hypertension and hyperlipidaemia, participants with low PA (adjusted OR 0·55, 95 % CI 0·40–0·76, p < 0·001) and high PA (adjusted OR 0·66, 95 % CI 0·49–0·88, p = 0·005) had significantly lower odds of stroke compared with those with no PA (Table 3). Compared with participants in the lowest quartile of PA (Q1), those in the second (Q2: adjusted OR 0·61, 95 % CI 0·46–0·82, p = 0·001), third (Q3: adjusted OR 0·65, 95 % CI 0·47–0·90, p = 0·009) and fourth quartiles (Q4: adjusted OR 0·64, 95 % CI 0·42–0·96, p = 0·034) had significantly lower odds of stroke (Supplemental Table S1). Participants with higher DQ had significantly lower odds of stroke after adjustment for potential confounders (adjusted OR 0·79, 95 % CI 0·64–0·98, p = 0·031, Table 3).
Individual and combined association of PA and DQ with the odds of prevalent stroke

Table 3. Long description
A table with 838 rows and 15 columns comparing physical activity and dietary quality levels with stroke odds. The table includes unadjusted and adjusted models for different levels of physical activity, dietary quality, and their combined effects. The columns include Stroke/n, OR, 95% CI, and p-values for each model. The rows are categorized by physical activity level (No PA, Low PA, High PA), dietary quality level (Lower DQ, Higher DQ), and combined PA and DQ levels (No PA and lower DQ, No PA and higher DQ, Low PA and lower DQ, Low PA and higher DQ, High PA and lower DQ, High PA and higher DQ). Each row provides specific values for the unadjusted model and three adjusted models.
PA, physical activity; DQ, dietary quality; PIR, poverty:income ratio.
Model 1 adjusted for age, sex and race.
Model 2 adjusted for age, sex, race, BMI, PIR, education levels, marital, alcohol consumption and smoking status.
Model 3 adjusted for the variables in model 2 plus diabetes, hypertension and hyperlipidaemia.
Restricted cubic spline analysis showed that PA was non-linearly associated with stroke (p for overall < 0·01; p for non-linearity < 0·01), whereas DQ showed a linear association with stroke (p for overall < 0·01; p for non-linearity = 0·28) (Supplemental Figures S1 and S2).
To evaluate the combined association of PA and DQ with stroke, participants were categorised into six groups based on their combined PA and DQ status: no PA–lower DQ (reference), no PA–higher DQ, low PA–lower DQ, low PA–higher DQ, high PA–lower DQ and high PA–higher DQ. After adjustment for age, sex, race, BMI, education level, PIR, marital status, smoking status, alcohol consumption, diabetes, hypertension and hyperlipidaemia, participants with no PA–higher DQ did not have lower odds of stroke compared with those with no PA–lower DQ (adjusted OR 0·76, 95 % CI 0·56–1·03, p = 0·077). Participants with low PA–lower DQ (adjusted OR 0·49, 95 % CI 0·32–0·75, p = 0·001), low PA–higher DQ (adjusted OR 0·56, 95 % CI 0·34–0·92, p = 0·024), high PA–lower DQ (adjusted OR 0·66, 95 % CI 0·44–0·99, p = 0·047) and high PA–higher DQ (adjusted OR 0·50, 95 % CI 0·34–0·73, p < 0·001) were all at significantly lower odds of stroke (Table 3). We do not detect additive or multiplicative interactions between low/high PA and higher DQ on odds of prevalent stroke history (Supplemental Table S2 and S3).
Baseline characteristics of stroke survivors
Among 838 stroke survivors, 414 (44·5 %) were men and 424 (55·5 %) were women, and 439 (71·4 %) identified as non-Hispanic White. Baseline characteristics of the stroke survivors, stratified by PA and DQ categories, are summarised in Table 4. Significant differences were observed across PA and DQ categories in age, BMI, PIR, education level, alcohol consumption, smoking status and diabetes (p < 0·05). During a median follow-up of 63 (IQR: 33–102) months, 251 deaths were recorded among stroke survivors. Baseline characteristics among stroke survivors and non-survivors were summarised in Table 5. Significant differences in age, BMI, PIR, marital status, smoking status and distribution of PA and DQ were detected (p < 0·05).
Baseline characteristics of stroke survivors according to PA and DQ categories

Table 4. Long description
A table comparing baseline characteristics of stroke survivors based on physical activity (PA) and diet quality (DQ) categories. The table has 15 rows and 12 columns. Column headers include Overall, No PA and lower DQ, No PA and higher DQ, Low PA and lower DQ, Low PA and higher DQ, High PA and lower DQ, High PA and higher DQ, and p-value. Row labels include Death/number, Age, BMI, Sex, Race, PIR, Education level, Marital status, Alcohol consumption, Smoking status, Diabetes, Hypertension, and Hyperlipidaemia. Each row provides percentages and counts for each category, with notable trends and comparisons across different PA and DQ levels. Significant differences are observed in age, BMI, PIR, education level, alcohol consumption, smoking status, and diabetes.
PA, physical activity; DQ, dietary quality; IQR, interquartile range; PIR, poverty:income ratio.
Baseline characteristics of stroke survivors according to outcome

Table 5. Long description
A table comparing baseline characteristics of stroke survivors by outcome. The table has 19 rows and 10 columns. Column headers are Overall (n 838), Dead (n 251), Alive (n 587), with subheaders n, %, n, %, n, %, and p. Row labels include Age, BMI, Sex, Race, PIR, Education level, Marital status, Alcohol consumption, Smoking status, Diabetes, Borderline, Hypertension, Hyperlipidaemia, and PA-DQ-subgroup. Each row provides specific values for each category. Notable trends include differences in age, BMI, PIR, education level, alcohol consumption, smoking status, and diabetes between dead and alive stroke survivors.
IQR, interquartile range; PIR, poverty:income ratio; PA, physical activity; DQ, dietary quality.
Association of mortality with physical activity and diet quality among stroke survivors
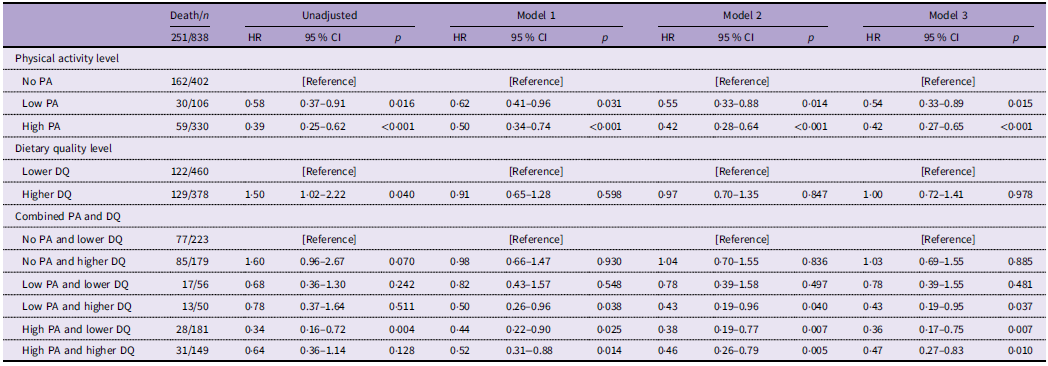
The associations of all-cause mortality with PA and DQ among stroke survivors are shown in Table 6. After adjustment for age, sex, race, BMI, PIR, education level, marital status, alcohol consumption, smoking status, diabetes, hypertension and hyperlipidaemia, stroke survivors with low (adjusted HR 0·54, 95 % CI 0·33–0·89, p = 0·015) or high PA (adjusted HR 0·42, 95 % CI 0·28–0·65, p < 0·001) had a significantly lower risk of all-cause mortality compared with those with no PA. In the sensitivity analysis using a quartile-based categorisation of PA, stroke survivors in the second (Q2: adjusted HR 0·53, 95 % CI 0·35–0·81, p = 0·004), third (Q3: adjusted HR 0·41, 95 % CI 0·24–0·72, p = 0·002) and fourth quartiles (Q4: adjusted HR 0·35, 95 % CI 0·17–0·73, p = 0·005) had significantly lower risks of all-cause mortality compared with those in the lowest quartile (Q1) (Supplemental Table S4). No significant association was observed between DQ and all-cause mortality among stroke survivors (adjusted HR 1·00, 95 % CI 0·72–1·41, p = 0·978) (Table 4).
Individual and combined association of PA and DQ with all-cause mortality in stroke survivors

Table 6. Long description
A table with 11 rows and 15 columns comparing physical activity and dietary quality levels with all-cause mortality in stroke survivors. The table includes data on death counts, hazard ratios (HR), 95% confidence intervals (CI), and p-values for different levels of physical activity (PA) and dietary quality (DQ). The table is divided into sections for physical activity level, dietary quality level, and combined PA and DQ. Each section provides unadjusted and adjusted models for HR, CI, and p-values. Notable trends include lower hazard ratios for higher physical activity levels and no significant association between dietary quality and all-cause mortality.
PA, physical activity; DQ, dietary quality; HR, hazard ratio; PIR, poverty:income ratio.
Model 1 adjusted for age, sex and race.
Model 2 adjusted for age, sex, race, BMI, PIR, education levels, marital, alcohol consumption and smoking status.
Model 3 adjusted for the variables in model 2 plus diabetes, hypertension and hyperlipidaemia.
Restricted cubic spline analysis showed that PA was non-linearly associated with all-cause mortality in stroke survivors (p for overall < 0·01, p for non-linear < 0·01), and DQ was not significantly associated with all-cause mortality in stroke survivors (p for overall = 0·65, p for non-linear = 0.62) (Supplemental Figures S3 and S4).
Looking at combined association, compared with stroke survivors with no PA–lower DQ, those with low PA–higher DQ (adjusted HR 0·43, 95 % CI 0·19–0·95, p = 0·037), high PA–lower DQ (adjusted HR 0·36, 95 % CI 0·17–0·75, p = 0·007) and high PA–higher DQ (adjusted HR 0·47, 95 % CI 0·27–0·83, p = 0·010) had a significantly lower risk of all-cause mortality (Table 6). We detected no significant additive or multiplicative interactions between low/high PA and higher DQ on all-cause mortality in stroke survivors (Supplemental Tables S5 and S6).
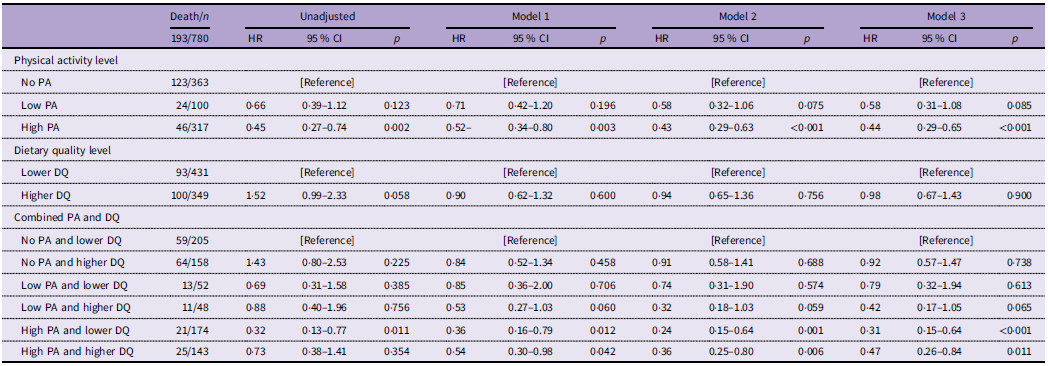
After excluding those who died within the first 24 months of follow-up (n 58), the results showed that after adjustment for age, sex, race, BMI, PIR, education level, marital status, alcohol consumption, smoking status, diabetes, hypertension and hyperlipidaemia, stroke survivors with active PA had a significantly lower risk of all-cause mortality compared with those with no PA (adjusted HR 0·44, 95 % CI 0·29–0·65, p < 0·001, Table 7). In the sensitivity analysis using a quartile-based categorisation of PA, stroke survivors in the second (Q2: adjusted HR 0·52, 95 % CI 0·33–0·83, p = 0·006), third (Q3: adjusted HR 0·43, 95 % CI 0·25–0·73, p = 0·002) and fourth quartiles (Q4: adjusted HR 0·45, 95 % CI 0·20–1·00, p = 0·050) had significantly lower risks of all-cause mortality compared with those in the lowest quartile (Q1) (Supplemental Table S7). We did not detect a significant association between DQ and all-cause mortality among stroke survivors (adjusted HR 0·98, 95 % CI 0·67–1·43, p = 0·900). Looking at combined association, compared with stroke survivors with no PA–lower DQ, those with high PA–lower DQ (adjusted HR 0·31, 95 % CI 0·15–0·64, p < 0·001), and high PA–higher DQ (adjusted HR 0·47, 95 % CI 0·26–0·84, p = 0·001) had lower risks of all-cause mortality after adjustment for potential confounders (Table 7).
Individual and combined association of PA and DQ with all-cause mortality in stroke survivors after excluding participants who died during the first 24 months of follow-up

Table 7. Long description
A table with 193 rows and 15 columns. The table compares the association of physical activity (PA) and dietary quality (DQ) levels with all-cause mortality in stroke survivors, excluding those who died within the first 24 months of follow-up. The columns include Death/n, Unadjusted HR, Unadjusted 95% CI, Unadjusted p, Model 1 HR, Model 1 95% CI, Model 1 p, Model 2 HR, Model 2 95% CI, Model 2 p, Model 3 HR, Model 3 95% CI, and Model 3 p. The rows are categorized by physical activity level (No PA, Low PA, High PA), dietary quality level (Lower DQ, Higher DQ), and combined PA and DQ (No PA and lower DQ, No PA and higher DQ, Low PA and lower DQ, Low PA and higher DQ, High PA and lower DQ, High PA and higher DQ). Each row provides specific values for the categories listed in the columns.
PA, physical activity; DQ, dietary quality; HR, hazard ratio; PIR, poverty:income ratio.
Model 1 adjusted for age, sex and race.
Model 2 adjusted for age, sex, race, BMI, PIR, education levels, marital, alcohol consumption and smoking status.
Model 3 adjusted for the variables in model 2 plus diabetes, hypertension and hyperlipidaemia.
Several sensitivity analyses were conducted to evaluate the robustness of the findings. Multiple imputation for missing covariate data did not materially change the results. Analyses excluding younger participants (aged ≤40 or ≤ 50 years) yielded similar results to primary analyses (Supplemental Tables S8–S16).
Discussion
To our knowledge, this is the first large observational study to examine the combined exposure patterns of PA and DQ in relation to stroke prevalence among general population and mortality in stroke survivors. Our study showed that compared with participants with no PA, those with either low or high PA across all categories of DQ had lower odds of prevalent stroke. Furthermore, stroke survivors with high PA–higher DQ, high PA–lower DQ and low PA–higher DQ were all at lower risks of all-cause mortality. Neither additive nor multiplicative effect of PA and DQ on outcomes was observed. Our findings underscore the potential importance of PA and DQ in stroke prevention and prognosis.
In our study population, the prevalence of stroke was 2·9 %, which is comparable to estimates reported by the American Heart Association (approximately 3·4 %)(Reference Martin, Aday and Allen47). Among stroke survivors in our participants, 251 deaths were recorded during 4821·25 person-years of follow-up, a mortality rate of 52·1 per 1000 person-years. The Geographic and Racial Differences in Stroke study reported a mortality rate of 82·3 per 1000 person-years(Reference Elfassy, Grasset and Glymour48). Another prospective cohort study from India reported a mortality rate of 91·8 per 1000 person-years in stroke survivors(Reference Nambiar, Raj and Vasudevan49). Possible explanations of the discrepancies in the above-mentioned studies may be attributed to different study populations.
PA is a well-established modifiable factor associated with cardiovascular outcomes. Evidence from large population-based studies demonstrates that higher levels of PA are associated with a lower likelihood of stroke(Reference Jiang, Chen and Xiang7,Reference Shi, Peng and Xu8) . In addition, longitudinal cohort evidence suggests that maintaining or increasing PA over time was associated with a reduced risk of ischaemic stroke, and vice versa(Reference Cowan, Tome and Mallhi5), which supports the association of lower odds of prevalent stroke history with high PA levels in our participants. Moreover, in agreement with several previous studies, our analyses showed that higher PA levels were significantly associated with lower all-cause mortality among stroke survivors(Reference Kang, Kim and Han9,Reference Mediano, Mok and Coresh50,Reference Joundi, Patten and Lukmanji51) . Notably, evidence from the Atherosclerosis Risk in Communities study suggests that higher pre-stroke PA was associated with a lower risk of adverse health outcomes after stroke(Reference Mediano, Mok and Coresh50), while studies in community-dwelling stroke survivors showed that higher PA was linked to reduced mortality risk(Reference Joundi, Patten and Lukmanji51). The underlying mechanism for the association of stroke prevalence and stroke outcomes with PA level remains uncertain but might include potential effects of regular PA on endothelial function, blood pressure regulation, insulin sensitivity and lipid metabolism(Reference Ashcroft, Stocks and Egan52–Reference Fernstrom, Heiland and Kjellenberg56).
Recent studies have increasingly focused on assessing overall dietary patterns rather than individual foods or nutrients, providing a more comprehensive understanding of the relationship between overall dietary quality and stroke(Reference Ibsen, Christiansen and Olsen10,Reference Chen, Neelakantan and Martin-Calvo11,Reference Gonzalez-Padilla, Tao and Sanchez-Villegas57–Reference Gao, Wang and Wang59) . Dietary patterns such as the EAT-Lancet diet and Mediterranean diet patterns have been shown to be consistently associated with a lower risk of stroke, highlighting the importance of overall diet pattern in stroke prevention(Reference Ibsen, Christiansen and Olsen10,Reference Chen, Neelakantan and Martin-Calvo11) . In addition, adherence to national dietary guidelines and Mediterranean-style diets, as well as higher DQ scores and specific dietary patterns such as low-carbohydrate diets, were associated with a lower likelihood of stroke in diverse populations(Reference Gonzalez-Padilla, Tao and Sanchez-Villegas57–Reference Gao, Wang and Wang59). In line with previous studies, our study showed that a higher DQ was associated with lower odds of stroke. However, the HEI-2020 was not associated with mortality among stroke survivors. A cohort study with 172 043 participants showed that compared with participants with higher HEI-2010, those with lower HEI-2010 were at a higher risk of stroke mortality(Reference Aigner, Becher and Jacobs14). Similarly, data from two large prospective cohorts with up to 36 years of follow-up showed that participants in the highest HEI-2015 quintile were at a significantly lower risk of all-cause mortality compared with those in the lowest quintile(Reference Shan, Wang and Li60). The discrepancy between our findings and the above-mentioned studies may be partly explained by differences in study populations and the specific dietary assessment methods used. The beneficial effects of higher DQ on stroke prevalence may be mediated through pathways related to blood pressure regulation, inflammation and metabolic health(Reference Mao, Weng and Xie61–Reference Harrison, Couture and Lamarche63).
Although both PA and DQ are independently associated with the odds of prevalent stroke history and prognosis, few studies have examined their combined exposure effects. However, we detected no statistically additive or multiplicative significant interactions between PA and DQ, suggesting that their protective effects on stroke prevalence operate independently rather than synergistically.
Our study was based on a large, nationally representative sample and accounted for sample weights, clustering and stratification to accurately estimate variance and enhance the generalisability of the findings. We acknowledge limitations. First, data on PA, DQ, diseases and covariates were collected through interviews and questionnaires, which may be subject to recall bias and potential misclassification. Second, only recent PA and DQ status was measured without collecting information on changes during follow-up, which may not reflect long-term lifestyle patterns. Third, we cannot infer causation regarding PA and DQ with stroke prevalence in our participants due to the nature of our cross-sectional design. Notably, participants may have reduced PA after stroke due to disability or may have improved diet after stroke diagnosis. Fourth, some stroke survivors with severe disability may not have been reached or included in this study. Fifth, we cannot fully rule out the confounding effects of unmeasured or unknown factors. Notably, some covariates, such as BMI, diabetes, hypertension and hyperlipidaemia, may be potential mediators rather than confounders, and adjustment for these variables may underestimate true effects. Furthermore, some potentially relevant factors, such as family history of stroke or CVD, were not analysed due to data unavailability, which may introduce residual confounding. Lastly, the NHANES database does not distinguish between ischaemic and haemorrhagic stroke, which may have different aetiologies and associations with PA and DQ.
Conclusions
This study highlights the associations of PA and DQ with stroke prevalence and mortality among stroke survivors. Higher PA was associated with lower odds of stroke and lower all-cause mortality, while higher DQ was associated with lower odds of stroke but not with mortality among stroke survivors. In the combined exposure analysis, different PA and DQ profiles showed differential associations with these outcomes, although no significant interaction between PA and DQ was observed. Our findings may help the public better understand the role of PA and DQ in preventing stroke and mortality and offer valuable insights for policymakers and clinical decision-making.
Supplementary material
For supplementary material accompanying this paper visit https://doi.org/10.1017/S0007114526108125
Data availability
The datasets used in this study are publicly available from the NHANES website at the CDC: https://wwwn.cdc.gov/nchs/nhanes/default.aspx.
Acknowledgements
The authors sincerely thank the participants and investigators of the NHANES study for their invaluable contributions, which greatly supported and enriched our research.
Author contributions
M Yang contributed to data interpretation, statistical analysis and manuscript drafting. S Fang contributed to statistical analysis and data interpretation and contributed to critical revisions. A Gareth contributed to statistical analysis and critical revision of the manuscript. H Huang (Huapin), Y Zhang, H Huang (Huayao) and N Liu contributed to the critical revision and final approval of the manuscript. H Du had full access to all of the data in the study and took responsibility for the integrity of the data and the accuracy of the data analysis. All authors reviewed and approved the final version of the manuscript.
Financial support
This work was supported by the Fujian Provincial Key Clinical Specialty of Neurology (Huapin Huang, No. 05029001), China National Key Clinical Specialty (No. 0802714), Fujian Science and Technology Innovation Joint Fund Project (Huayao Huang, No. 2021Y9082) and Clinical Research Center for Precision Diagnosis and Treatment of Neurological Diseases of Fujian Province (No. 2022Y2005).
Competing interests
The authors report no conflicts of interest.