Introduction
Frailty in older adults is defined as a multifactorial syndrome associated with low metabolic reserve, less resistance to stressors, and difficulty to maintain the organic homeostasis due to cumulative decline of multiple physiological systems (Fried et al., Reference Fried2001; Hogan et al., Reference Hogan, Macknight and Bergman2003). There is agreement that it can be considered as a state of vulnerability expressed as an increased risk of accumulating health-related problems, hospitalization, dependency, institutionalization, and death (Bergman et al., Reference Bergman2007; Rockwood and Mitnitski, Reference Rockwood and Mitnitski2007; Lang et al., Reference Lang, Michel and Zekry2009). Identifying frail and pre-frail older adults is a priority in geriatric settings, as these individuals should participate in interventions. There is no consensus about the best definition and criteria to identify the syndrome (Hogan et al., Reference Hogan, Macknight and Bergman2003; Walston et al., Reference Walston2006; Ensrud et al., Reference Ensrud2009; Abellan van Kan et al., Reference Abellan van Kan, Rolland, Houles, Gillette-Guyonnet, Soto and Vellas2010), and whether cognitive impairment should be added to frailty criteria (Ávila-Funes et al., Reference Ávila-Funes2009; Song et al., Reference Song, Mitnitski and Rockwood2010).
It has been demonstrated that lower cognitive performance is associated with adverse health outcomes such as functional limitations and hospitalization (Raji et al., Reference Raji2005; Rockwood et al., Reference Rockwood, Andrew and Mitnitski2007; Ávila-Funes et al., Reference Ávila-Funes2009). Longitudinal studies have reported that physical frailty is associated with lower cognitive performance (Samper-Ternent et al., Reference Samper-Ternent, Al Snih, Raji, Markides and Ottenbacher2008; Ávila-Funes et al., Reference Ávila-Funes2009; Auyeung et al., Reference Auyeung, Lee, Kwok and Woo2011; Jacobs et al., Reference Jacobs, Cohen, Ein-Mor, Maaravi and Stessman2011), higher risk for Mild Cognitive Impairment (MCI), and Alzheimer's disease (AD) (Buchman et al., Reference Buchman, Boyle, Wilson, Tang and Bennett2007; Boyle et al., Reference Boyle, Buchman, Wilson, Leurgans and Bennett2010).
The study of frailty remains little explored in Latin America. Precise criteria and simple diagnostic tools for the early identification of frail older adults need to be validated for this region of the world, as socioeconomic conditions and access to healthcare may vary. In a previous study which examined the Cardiovascular Health Study (CHS) frailty criteria separately (Yassuda et al., Reference Yassuda2012), the percentage of frail older adults who performed below cut-off scores in several cognitive measures was higher than in the other frailty profiles.
The aim of the present study was to assess the association between frailty and performance of 384 older adults on the MMSE total and its subdomain scores. It was hypothesized that cognitive performance would be lower among frail older adults when compared to pre-frail and non-frail. It was also hypothesized that there would be an independent association between frailty and cognitive impairment as assessed by the MMSE and its subdomains. This study was part of a multicenter nationwide effort to collect data on frailty and aging in Brazil, known as the FIBRA network.
Methods
Data collection procedures
The district of Ermelino Matarazzo is located in the eastern area of the city of São Paulo and it has a population around 106,000 inhabitants. It is characterized as a region of low socioeconomic status. Older adults (≥ 65 years) represent 4.5% of the residents of the district (SEADE, 2010).
The present study was a population-based survey. Prior to its beginning, the survey was advertised in senior centers and religious groups to enhance participation of older adults. The organization of the sample was based on a multistage procedure that took into account the primary sampling units (PSU) and the households. A PSU is the smallest area considered by the census. The PSU, in turn, may be composed of one single large block that may contain several households or a group of smaller blocks. Sixty-six PSUs were randomly drawn, and a team of trained recruiters identified all households within each PSU. The households were visited to identify seniors 65 years and older, according to inclusion and exclusion criteria, and they were invited to participate in a data collection session at a nearby community center on a later date. After signing an informed consent form, participants were interviewed by 30 trained Gerontology students, who collected information regarding sociodemographic variables, cognitive status, and CHS frailty criteria. Twelve of those students were involved in cognitive testing. They received four training sessions to make sure that they could apply the MMSE in a standardized way. Procedures lasted from 90 to 120 minutes. After participation, seniors received health counseling based on the information provided. They also received a booklet with health tips and information on healthy lifestyles. This research project was completed in accordance with the Helsinki declaration, and it was approved by the Ethics Committee of the State University of Campinas (UNICAMP), and the University of São Paulo.
In the FIBRA study, for cities with less than one million inhabitants, the minimum sample size was estimated at 385 participants for a sampling error of 5%. Sample size was estimated to guarantee a proportion of 50% for the occurrence of a certain characteristic in the older population.
Participants
Three hundred and eighty-four older adults participated and were classified as pre-frail if they met one or two of the five CHS frailty criteria and as frail if they met three or more. Frailty criteria were strictly operationalized according to Fried et al. (Reference Fried2001) as: (1) weight loss of more than 4.5 kg or 5% of weight loss in the last year; (2) fatigue, assessed by items 7 and 20 from the CES-D (Radloff, Reference Radloff1977); (3) decreased activity level, identified by the lowest 20% in the Minnesota Leisure Time Activities Questionnaire (Ainsworth et al., Reference Ainsworth, Haskell, Whitt, Irwin, Swartz and Strath2000), adjusted for sex; (4) reduced walking speed, identified by the lowest 20%, assessed by the number of seconds to walk 4.6 m, adjusted for sex and height (Guralnik et al., Reference Guralnik1994); (5) reduced grip strength, identified by the lowest 20%, adjusted for sex and body mass index (Rauen et al., Reference Rauen2008).
The sample included elders 65 years and older, who understood instructions, agreed to participate, and were a permanent resident in the household and census tract. Exclusion criteria were: (1) severe cognitive impairment suggestive of dementia, (2) need of a wheelchair, or being bedridden, (3) having sequelae of strokes, with localized loss of strength and/or aphasia, (4) untreated Parkinson's disease, (5) severe deficits in hearing or vision, which greatly hindered communication, and (6) being terminally ill. The inclusion and exclusion criteria were adapted from the Cardiovascular Health Study (CHS), according to Ferrucci et al. (Reference Ferrucci2004).
Instruments
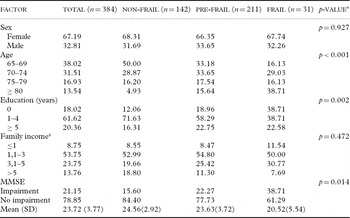
Sociodemographic data were gathered by means of a structured protocol. Cognitive performance was assessed by the MMSE and its subdomains (Folstein et al., Reference Folstein, Folstein and McHugh1975). To identify participants with possible cognitive impairment in the descriptive analyses, education adjusted cut-off scores were used, suggested by a previous study (Brucki et al., Reference Brucki, Nitrini, Caramelli, Bertolucci and Okamoto2003). The sample was stratified into cognitively impaired and unimpaired only for descriptive purposes (see Table 1).
Sociodemographic characteristics and cognitive status of non-frail, pre-frail, and frail participants, in percentages, Ermelino Matarazzo, São Paulo, 2009

* p value for chi square or Fisher test.
Note: MMSE: Mini-Mental State Examination. SD: Standard deviation.
a Monthly family income in minimum wages.
Statistical analysis
The chi square and Fisher exact tests were used to compare the distribution between the categorical variables. The Mann–Whitney test was used to compare numerical variables between two groups, and the Kruskal–Wallis test was used to compare numerical variables between three or more groups, as variables did not follow normal distribution. Spearman's correlation was used to assess the association between the numerical variables. These variables were transformed into ranks due to the absence of normal distribution. To study the relationship between the independent variables (age, sex, education, family income, and frailty profile) and the MMSE total and subdomain scores, univariate and multivariate linear regression analyses with stepwise criteria for variable selection were used. Statistical analyses used SAS System for Windows, version 8.02 (SAS Institute Inc, 1999–2001, Cary, NC, USA). Descriptive statistics were presented to characterize the sample. Significance level was set at p < 0.05. In the description of the sample, some of the percentages reported are slightly different from the ones presented in Yassuda et al. (Reference Yassuda2012) due to the fact that in the present analyses statistical software did not incorporate weight factors based on census data, as the focus of the current analyses was not epidemiological.
Results
The sample (N = 384) was composed mostly of older adults, i.e., individuals aged 65–69 years (38%, M = 72.3, SD = 5.8), with a higher presence of females (67.2%). Most of the sample had between one to four years of education (60.2%, M = 3.4, SD = 2.8) and family income from 1.1 to three minimum wages (53.8%, M = 3.4, SD = 3.1). In the study, 8% of the older adults were classified as frail and 54.2% were classified as pre-frail. Regarding cognitive screening, 21.2% of them were identified as having cognitive impairment according to the MMSE education-adjusted cut-off points. Among non-frail participants (n = 141), 15.6% had cognitive impairment, among the pre-frail (n = 211), 22.3% were impaired, and 38.7% of frail older adults (n = 31) had cognitive impairment. Frail participants were significantly older, less educated, and more impaired in the MMSE, as detailed in Table 1.
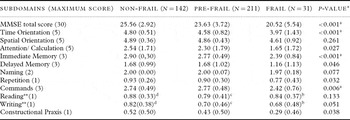
To control for the possibility of finding random significant results due to multiple comparisons involving the MMSE subdomains, for these analyses, results were considered significant if p < 0.01. Frail participants were significantly different from pre-frail and non-frail older adults in the MMSE total score and in Time Orientation, Immediate Memory and Commands (Table 2).
Means and standard deviation (in parentheses) for the MMSE total score and subdomains for non-frail, pre-frail, and frail, Ermelino Matarazzo, São Paulo, 2009

*p-value refers to the Kruskal–Wallis test. Significant differences: p < 0.01. **for Reading and Writing, illiterate participants were not included in the analyses,
Note: MMSE: Mini-Mental State Examination.
aNon-frail ≠ Frail, Pre-frail ≠ Frail.
b n = 19.
c n = 170.
d n = 123.
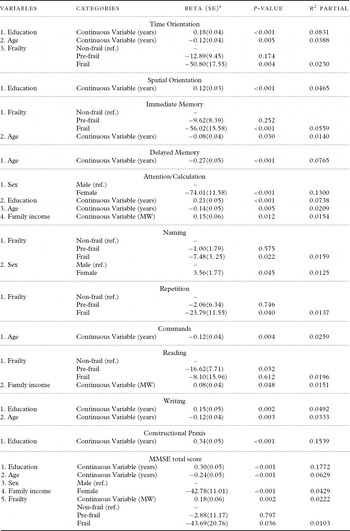
As can be seen in Table 3, the MMSE total score and subdomain scores were influenced by sex, age, education, family income, and frailty. Results indicated that women, those who are older, with lower education and income, and those who meet CHS criteria for frailty tend to score lower in the MMSE total and subdomain scores. Age and education displayed the strongest influence on cognition as assessed by the MMSE.
Multivariate linear regression analyses for the MMSE total score and subdomains, Ermelino Matarazzo, São Paulo, 2009

* Beta: estimated value or slope on the regression line.
Note: ref. = reference level; MW = minimum wages; SE: standard error. R 2: determination coefficient. Stepwise criteria to select variables. R 2 Total Time orientation: 0.1449. Intercept (SE): 190.75 (13.84); P < 0.001. R 2 Total Spatial Orientation: 0.0465. Intercept (SE): 169.83 (6.74); P < 0.001. R 2 Total Immediate Memory: 0.0699. Intercept (SE): 221.00 (8.63); P < 0.001. R 2 Total Delayed Memory (11): 0.0765. Intercept (SE): 243.30 (11.59); P < 0.001. R 2 Total Attention/Calculation: 0.2401. Intercept (SE): 204.03 (20.84); P < 0.001. R 2 Total Naming: 0.0284. Intercept (SE): 191.13 (1.82); P < 0.001. R 2 Total Repetition: 0.0137. Intercept (SE): 198.37 (4.92); P < 0.001. R 2 Total Commands: 0.0259. Intercept (SE): 216.31 (8.99); P < 0.001. R 2 Total Reading: 0.0347. Intercept (SE): 152.26 (9.22); P < 0.001. R 2 Total Writing: 0.0825. Intercept (SE): 144.19 (14.42); P < 0.001. R 2 Total MMSE total: 0.3155. Intercept (SE): 184.35 (20.57); P < 0.001.
Discussion
The present study compared MMSE performance among 384 frail, pre-frail, and non-frail older community dwellers in Ermelino Matarazzo, a poor subdistrict of the city of São Paulo, Brazil. Prevalence of frailty was similar to previous studies (Fried et al., Reference Fried2001; Ávila-Funes et al., Reference Ávila-Funes2008; Ottenbacher et al., Reference Ottenbacher2009). However, we should point out that frailty prevalence may be different in other regions of Brazil, as there was a higher presence of younger older adults in the studied sample. In agreement with previous findings (Ávila-Funes et al., Reference Ávila-Funes2008), frail older adults were significantly older, more likely to be female, less educated, and report lower income, in comparison to non-frail participants.
The present results revealed lower MMSE performance for frail participants, in agreement with earlier studies (Samper-Ternent et al., Reference Samper-Ternent, Al Snih, Raji, Markides and Ottenbacher2008; Ávila-Funes et al., Reference Ávila-Funes2009). In the sample, 38.7% of frail older adults scored below education-adjusted cut-off scores for the MMSE. Similarly, in a sample of older adults, i.e., 85 years and older followed up in Jerusalem, 53% of frail seniors scored below 24 points in the MMSE (Jacobs et al., Reference Jacobs, Cohen, Ein-Mor, Maaravi and Stessman2011). These findings may imply that, in part, frailty may be related to neurodegenerative disorders, such as Alzheimer's disease (AD). AD pathology may be present in the brain at least a decade before clinical symptoms emerge (Sperling et al., Reference Sperling2011), therefore, it is plausible that the frailty syndrome may be explained by these brain changes. Epidemiological studies have suggested that frailty may indeed be a precocious marker of mild cognitive impairment and AD (Buchman et al., Reference Buchman, Boyle, Wilson, Tang and Bennett2007; Boyle et al., Reference Boyle, Buchman, Wilson, Leurgans and Bennett2010).
In the present analyses, the full range of MMSE scores was included as participants with scores below education-adjusted cut-off scores were not excluded from the analyses. This fact may have magnified the relationship between frailty and cognition. Ottenbacher et al. (Reference Ottenbacher2009) and Ávila- Funes et al. (Reference Ávila-Funes2009) adopted the same procedure as they justified their interest in predicting adverse health outcomes and strengthening the predictive validity of the frailty syndrome. Including participants with different cognitive profiles may help capture, in a more precise way, the shared vulnerability of those who decline simultaneously in the physical and cognitive domains. In addition, exclusion criteria in the FIBRA may have limited the participation of older adults with acute cognitive and physical limitations, therefore, we felt including in the analyses only cognitively unimpaired participants who would, in turn, further select the sample toward non-frailty.
Current findings suggest that being frail is associated with worse performance in several aspects of cognition, such as time orientation, immediate memory, and following commands. The fact that frailty is associated with lower performance in several domains is consistent with the hypothesis that frailty and cognitive decline could be caused by physiological changes related to aging (Alfaro-Acha et al., Reference Alfaro-Acha, Snih, Raji, Yong-Fang, Markides and Ottenbacher2006; Buchman et al., Reference Buchman, Boyle, Wilson, Tang and Bennett2007; Samper-Ternent et al., Reference Samper-Ternent, Al Snih, Raji, Markides and Ottenbacher2008; Ávila-Funes et al., Reference Ávila-Funes2009; Boyle et al., Reference Boyle, Buchman, Wilson, Leurgans and Bennett2010).
Among the limitations of the study, besides the strict exclusion criteria, one could cite the significant number of young older adults present in the sample. Another limitation refers to its cross-sectional nature and current absence of follow-up data from this cohort. On the other hand, the criteria and procedures used were similar to those adopted by international studies on frailty, which may facilitate cross-cultural comparisons.
To conclude, the results bear important implications for the comprehensive care of the older adults. In clinical settings, when patients meet frailty criteria they should be seen as patients at risk for cognitive decline. MMSE scores, in particular, some of its domains such as time orientation and immediate memory may help identify patients with physical and cognitive vulnerabilities.
Conflict of interest
None.
Descriptions of authors’ roles
C. Macuco designed the study and wrote the paper. D. Falcão, S. Batistoni, A. Lopes, and M. Cachioni collected the data and supervised the data collection and revised the paper. A. Neri designed the study and revised the final version of the paper. M. Yassuda designed the study, collected the data, supervised the data collection, assisted with writing the paper, and revised the final version of the paper.