

1. Introduction
Physical infrastructure assets, such as roads, electrical grid, telecommunication networks, water supply, and waste disposal, provide services that are central to the functioning of modern economies (Palei, Reference Palei2015). Beyond being one of the most essential inputs in the process of economic growth, the supply of efficient public infrastructure improves quality of life and is critical for national security (Baldwin and Dixon, Reference Baldwin and Dixon2008). As a consequence of sustained economic development, population pressure, and rapid advances in science and technology in the past century, infrastructure capital has become increasingly diverse and broad, meaning that improving the quality and quantity of infrastructure capital as a vital factor of production has become an integral part of sustainable development policies.
A significant body of academic literature has focused on the contributions of infrastructure capital to aggregate output, productivity, and welfare. Often, such studies discuss these contributions in terms of the growth effects of productive government spending models (see, for instance, Barro, Reference Barro1990; Ghosh and Roy, Reference Ghosh and Roy2004; Glomm and Ravikumar, Reference Glomm and Ravikumar1997). Moreover, following the seminal work of Aschauer (Reference Aschauer1989), there has been a growing interest in empirically investigating the link between infrastructure capital and economic growth (see, e.g. Bougheas et al., Reference Bougheas, Demetriades and Mamuneas2000; Calderón and Servén, Reference Calderón and Servén2004; Calderón et al., Reference Calderón, Moral-Benito and Servén2015; Canning and Pedroni, Reference Canning and Pedroni1999; Röller and Waverman, Reference Röller and Waverman2001). Despite using a variety of datasets and empirical methodologies, most of these empirical studies document a generally positive correlation and long-run effect of physical infrastructure on aggregate output and productivity (Calderón and Servén, Reference Calderón and Servén2004; Fedderke et al., Reference Fedderke, Perkins and Luiz2006; Fernald, Reference Fernald1999; Munnell and Cook, Reference Munnell and Cook1990; Torrisi, Reference Torrisi2010).
Similar to infrastructure capital, the role of institutional quality in the process of economic development has also received increasing attention in empirical growth studies conducted in the past three decades (see, among others, Coase, Reference Coase1992; North, Reference North1991; Ostrom et al., Reference Ostrom, Schroeder and Wynne1993; Rodrik, Reference Rodrik and Rodrick2003). These studies convincingly demonstrate that general differences in institutional quality are one of the most reliable determinants of variations in economic development among countries (Acemoglu and Robinson, Reference Acemoglu and Robinson2013; Acemoglu et al., Reference Acemoglu, Johnson and Robinson2005, Reference Acemoglu, Johnson, Robinson and Yared2008; Law et al., Reference Law, Lim and Ismail2013; Lee and Kim, Reference Lee and Kim2009; Rodrik et al., Reference Rodrik, Subramanian and Trebbi2004; Valeriani and Peluso, Reference Valeriani and Peluso2011). In particular, the protection of civil and property rights, economic and political freedom, law and order, bureaucratic quality, and low levels of corruption have been shown to be associated with higher rates of economic growth (Bénassy-Quéré et al., Reference Bénassy-Quéré, Coupet and Mayer2007).
Although large bodies of empirical literature have examined the separate roles of infrastructure capital and institutional quality in economic development, existing cross-country studies pay surprisingly little attention to the complementarities between infrastructural and institutional capability as it relates to their effects on economic growth.
The few exceptions to this generalization include Esfahani and Ramırez (Reference Esfahani and Ramırez2003), Maiorano and Stern (Reference Maiorano and Stern2007), and Andonova and Diaz-Serrano (Reference Andonova and Diaz-Serrano2009). Using a cross-country study and a structural model of infrastructure, Esfahani and Ramırez (Reference Esfahani and Ramırez2003) document the crucial role of generic institutional capabilities as an indicator of the credibility and effectiveness of governments toward enabling high infrastructure returns. However, these authors employ ordinary least squares (OLS) cross-sectional regressions that are known to suffer from endogeneity biases. Maiorano and Stern (Reference Maiorano and Stern2007) find that regulatory institutions have a positive effect on mobile telecommunication infrastructure and the levels of per capita gross domestic product (GDP). Despite using narrow measures of infrastructure capital and institutional quality, the study by Maiorano and Stern (Reference Maiorano and Stern2007) suggests a potentially positive joint impact of infrastructure and institutions on economic growth. A similar study by Andonova and Diaz-Serrano (Reference Andonova and Diaz-Serrano2009) also shows that although political institutions are essential to the development of telecommunications infrastructure, their effect is limited, as mobile technologies are less dependent on political constraints.
The current study aims to reassess the role of infrastructure capital in economic growth under varying degrees of institutional quality.Footnote 1 In this context, although infrastructure capital is considered as a physical core, institutional quality can be viewed as a soft component in shaping growth patterns.Footnote 2 Hence, the first contribution of this paper is to revisit the joint impact of infrastructure capital and institutional quality using a new dataset that consists of several alternative measures for both variables. We employ a balanced dataset of 99 countries spanning the period 1980–2015.
The second contribution of this paper concerns the estimation methodology. Empirical growth models often include lagged dependent variables as a covariate to control for the convergence effect. This creates an endogeneity problem, as the lagged dependent variable will – by construction – be correlated with the unobserved country-specific effects (Caselli et al., Reference Caselli, Esquivel and Lefort1996). Earlier studies on institutions and infrastructure, such as Esfahani and Ramırez (Reference Esfahani and Ramırez2003) and Law et al. (Reference Law, Lim and Ismail2013), use cross-sectional regressions and apply an instrumental variable approach to address the endogeneity problem. However, implementing an instrumental variable estimation approach is often challenging as it is difficult to find a reliable instrumental variable for infrastructure capital and institutional quality (Lee and Kim, Reference Lee and Kim2009). Our second contribution is thus to provide more reliable results by addressing the endogeneity problem through the system generalized method of moments (system-GMM) estimator (Arellano and Bover, Reference Arellano and Bover1995; Blundell and Bond, Reference Blundell and Bond1998). This estimator is well suited to account for the potential endogeneity of not only the lagged dependent variable but also of other explanatory variables.
As a third contribution, this paper improves upon extant studies on the joint effects of infrastructure and institutions, such as Esfahani and Ramırez (Reference Esfahani and Ramırez2003), Maiorano and Stern (Reference Maiorano and Stern2007), and Andonova and Diaz-Serrano (Reference Andonova and Diaz-Serrano2009), by employing a large spectrum of institutional quality indicators, including democracy, autocracy, executive constraints, bureaucratic quality, government stability, control over corruption, and the rule of law. These indicators capture three different dimensions of political institutions: political stability, administrative quality, and democratic accountability. With these contributions in mind, this study seeks to help better understand the extent to which the effects of infrastructure capital on economic growth depend on specific institutional quality dimensions. For instance, noting that corruption is arguably the most apparent linking factor between institutional quality and the growth-promoting role of infrastructure, we also examine if other aspects of institutional quality, such as democracy, government stability, bureaucratic quality, and the rule of law, have any effect over and above the effect captured by corruption.
Our results reveal that infrastructure capital is positively and significantly correlated with economic growth in countries with higher institutional qualities and vice versa. In particular, infrastructure capital affects economic growth positively and significantly in the presence of considerably better institutional frameworks such as democracy, law and order, control of corruption, bureaucratic qualities, and government stability. On the contrary, weaker institutional setups, such as corruption and autocracy, diminish the growth impacts of infrastructure capital. Our results are robust to the use of various alternative specifications and estimation methods. Most notably, both de jure (constraints on executives, democracy and autocracy), as well as de facto (the rule of law and government stability) institutional quality indicators significantly determine the efficacy of infrastructure even after the effect of corruption, is taken into account. These results suggest that improving the quality of institutions is essential to reap the full economic benefits of infrastructural investments.
The rest of the paper is organized as follows. Section 2 introduces the empirical specification of our model. Section 3 describes our data in detail. Section 4 discusses the results, and Section 5 provides the conclusion. Finally, the Appendices are provided.
2. Conceptual foundations and empirical model specification
In this section, we provide the empirical model as well as the conceptual and theoretical foundations that form the basis of our hypothesis that institutional quality matters for the growth-promoting role of infrastructural capital.
Conceptual foundations
In our quest to examine the role of infrastructure capital on economic growth under varying degrees of institutional quality (henceforth, we use ‘institutions’ and ‘institutional quality’ alternatively), we employ theoretical models that link economic growth with rent-seeking models. Specifically, our model builds upon the endogenous growth model of Barro (Reference Barro1990), which incorporates infrastructure capital as one factor of production. It bears noting here that infrastructural investments are highly vulnerable to substantial bribes and rent-seeking activities (Shleifer and Vishny, Reference Shleifer and Vishny1993). Hence, weak institutional setups may lead to lower quality of infrastructural investments and hence slow the rate of economic growth (Knack and Keefer, Reference Knack and Keefer1995; Mauro, Reference Mauro1997). Specifically, governments with weak accountability, low transparency, and high cronyism may select infrastructural projects based on the expected political gains for the members of the ruling party and not on the projects' expected economic returns for the public at large. Hence, lobbying and corruption inflate expenditures in publicly funded projects, which in turn makes the financing of debt more costly and puts economies into financial stress (e.g. Tanzi and Davoodi, Reference Tanzi, Davoodi, Shibata and Ihori1998).
The local governance system has a direct influence on the planning, selection, and implementation of infrastructural projects. Political interference is particularly prevalent in infrastructural projects that require large budgets, involve a high number of actors, and benefit a large number of people. The risk of moral hazard in delivering low-quality infrastructural projects depends on the capacity and independence of authorities controlling projects and the availability of a legal system that can penalize wrongdoing. Low institutional quality, such as in the form of rampant corruption and organized crime, is also related to massive cost overruns and significant delays of completion of infrastructural projects. Facing these problems, infrastructural projects may end up being ‘white elephants’, which instead of fostering economic growth, may somewhat impede it by crowding out private investment.
Finally, even after infrastructural projects are completed, their impacts on economic growth might be limited by political instability, weak accountability, and ineffective governance systems. The availability of road networks might not attract the expected amount of investment in areas where there is civil conflict, armed gangs operate freely, or private property rights are not secure. The same can be said about a power grid infrastructure if electricity is rationed on political connection or if corruption makes prices too expensive for investors to participate in profitable investments. Ineffective governments will find it challenging to repair and maintain infrastructure capital for a long time, and autocratic and less transparent governments often prefer investing in new infrastructure than maintaining existing infrastructure.
Therefore, although specific institutional aspects, such as the prevalence of corruption, could play a visible role in reducing the impact of infrastructure, other dimensions of institutional quality, such as government effectiveness, government stability, and the rule of law, are also crucial in determining the efficacy of infrastructure in promoting economic growth.
Empirical model specification
Our empirical model is derived from Canning and Pedroni (Reference Canning and Pedroni2008), who, following Barro (Reference Barro1990), incorporate stochastic disturbance terms over time. Such an approach allows us to estimate the role of infrastructure capital in a reduced form growth model using panel data estimation techniques. Specifically, our theoretical model describes the long-run growth rate of output per capita as a function of infrastructure capital and institutions.Footnote 3 Formally, our model, after a logarithmic transformation, is written as

where $\dot{y}_{it}$ denotes the GDP per capita growth rate for country i at time period t, I it represents an indicator of institutional quality, G it stands for infrastructural capital, and I it × G it is the interaction term between institutions and infrastructure.
Our empirical model follows from (1) and reads as:

where Z it is a vector of control variables and ε it is the error term. In this model the marginal effect (ME) of G it on $\dot{y}_{it}$ is given by

In (3) unless σ is zero, the marginal effect of G it is conditional on the value of I it. Since we have a symmetric interactive model specification in (2), the marginal effect of I it on $\dot{y}_{it}$ is also conditional on G it, that is

Thus, the coefficient of the interaction term, σ, indicates both the slope of the relationship between ME(G it|I it) and I it, and the slope of the relationship between ME(I it|G it) and G it (Berry et al., Reference Berry, Golder and Milton2012). Based on the aforementioned conceptual foundations, we propose the following hypothesis:
HInfrastructure|Institutions: The marginal effect of infrastructure capital on economic growth is expected to be positively dependent on the level of institutional quality. Namely, we expect infrastructure to have a stronger impact on economic growth in economies with a higher level of institutional quality.
Dynamic panel data estimation approach
The empirical growth literature on the effects of infrastructure capital and institutional quality on economic growth has relied heavily on pure cross-sectional estimation methods (see, e.g. Esfahani and Ramırez, Reference Esfahani and Ramırez2003; Glaeser et al., Reference Glaeser, La Porta, Lopez-de Silanes and Shleifer2004; Rodrik et al., Reference Rodrik, Subramanian and Trebbi2004). Nonetheless, the pure cross-sectional estimations often suffer from endogeneity bias, which arises by construction from the correlation between unobserved country-specific effects and the lagged dependent variable (Caselli et al., Reference Caselli, Esquivel and Lefort1996). Furthermore, reverse causality from determinants of growth, such as infrastructure capital and institutional quality, to economic growth could be another source of endogeneity and, hence, could bias estimation results. To overcome these endogeneity concerns, an instrumental variable approach could be employed. Nevertheless, it is often difficult to find reliable instruments, which should be associated with the explanatory variables but not with the error term.
In the empirical growth literature, the GMM-based dynamic panel data estimators suggested by Arellano and Bond (Reference Arellano and Bond1991), Arellano and Bover (Reference Arellano and Bover1995), and Blundell and Bond (Reference Blundell and Bond1998) are widely used to overcome the aforementioned econometric challenges in pure cross-sectional growth regressions. These estimators address unobserved country heterogeneity, omitted variable bias, and potential endogeneity that could arise from reverse-causality by first removing country-specific effects through first-differencing and subsequently employing lagged levels as internal instruments for the first-differenced series.
In this study, we employ the system-GMM estimator (Arellano and Bover, Reference Arellano and Bover1995; Blundell and Bond, Reference Blundell and Bond1998) to examine the effects of infrastructure capital and institutional quality on aggregate output. We employ a panel dataset of 99 countries over the period 1980–2015, with data averaged over 5-year periods to overcome business cycle effects. Our baseline model is a multiplicative interaction model, which is derived from (2):

where y it−1 is log GDP per capita of the previous 5-year period and μ i denotes the unobserved country-specific fixed effect. In (5), the interaction term allows the marginal effect of infrastructure capital on economic growth to vary with different degrees of institutional quality.
Unlike the difference-GMM estimator (Arellano and Bond, Reference Arellano and Bond1991), which employs equations in first differences, the system-GMM estimator uses a system of two equations: one in first differences and the other in levels. The variables in levels in the latter are instrumented with their first differences, and these additional instruments reduce small sample biases and imprecision associated with the difference-GMM estimator (Arellano and Bover, Reference Arellano and Bover1995; Blundell and Bond, Reference Blundell and Bond1998; Roodman, Reference Roodman2009).
To test if our model is correctly specified, we apply two tests: the overidentification test and the test for serial correlation of the residuals in the differenced equation. Under the null hypothesis of instrument validity, the Hansen tests for over-identifying restrictions are asymptotically distributed as a Chi-squared random variable with degrees of freedom equal to the number of instruments less the number of parameters. The autocorrelation test determines the presence of autocorrelation of order p + 1 in the residuals in first differences, which is equivalent to testing autocorrelation of order p in the residuals in levels.
3. Data description
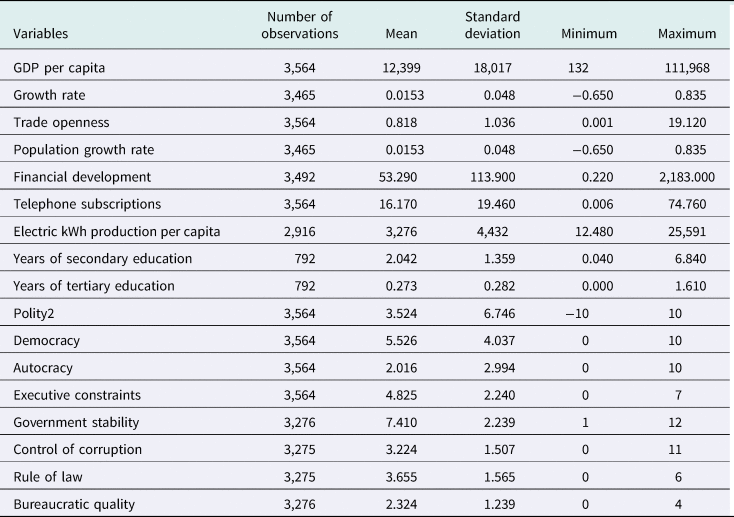
As stated above, our goal in this paper is to estimate the effects of infrastructure capital, institutional quality and their interaction on aggregate economic growth worldwide. To this end, we employ a balanced panel dataset that covers 99 countries over the period 1980–2015. The list of the sample countries covered by the study is provided in Appendix B. The variables used in the model and the source of data are briefly discussed below whereas summary statistics are documented in Table 1.
Summary statistics of variables used in estimation

The dependent variable is the growth rate of aggregate output of a country. Aggregate output is measured by GDP per capita in constant 2010 US dollars. The data are obtained from the World Bank Development Indicators database (World-Bank, 2017).
One of the main challenges associated with research on infrastructure and growth is obtaining good quality national-level data on infrastructure capital. Sector-specific physical infrastructure data on investment or capital stock volumes are available only for a handful of high-income economies, and usually for just a few years. As a result of the incomplete nature of the data for other sectors of infrastructural investments, such as road networks, airports, and irrigation, we have opted here to focus on telephone and electric power production infrastructure. Accordingly, we use fixed telephone subscriptions per 100 people and the aggregate electric power generation kilowatt-hours (kWh) per capita as proxies for infrastructure capital investment. As a particular merit of these indicators, telephone networks, and electric power generation are major contentious issues in the political economy of infrastructure development in many countries, and their productivity could be strongly influenced by the quality of prevailing institutions (Esfahani and Ramırez, Reference Esfahani and Ramırez2003).
Fixed telephone subscriptions refer to the sum of an active number of analog fixed telephone lines, voice-over-IP (VoIP) subscriptions, fixed wireless local loop (WLL) subscriptions, ISDN voice-channel equivalents, and fixed public payphones. Alternatively, we use the telephone data from the Cross-National Time-Series Data Archive (CNTS) (Banks and Wilson, Reference Banks and Wilson2011), which consolidates fixed-line and cellular telephones.
Our data on electric power generation come from the U.S. Energy Information Administration (2017), which provides access to a wide range of global energy and climate statistics. The dataset provides electricity generation by energy sources such as oil, nuclear, hydroelectric, gas, coal, and others. For this study, we use the aggregated data from all sources in kWh for each country, divided by the total population of the country.
To measure institutional quality, we rely on two primary sources. First, we use the political institution indicators from the Polity IV Project dataset (Marshall and Jaggers, Reference Marshall and Jaggers2002). Second, we employ the political risk index of the International Country Risk Guide (ICRG) dataset, which provides survey-based data on the rule of law, control of corruption, bureaucratic quality, and government stability (Howell, Reference Howell2011). A brief description of the individual institutional quality indicators used in the current study is provided below:
• Polity2: This is a combination of institutionalized democracy and institutionalized autocracy indices. The Polity2 score, which is derived from the Polity IV Dataset (Marshall and Jaggers, Reference Marshall and Jaggers2002), is computed by subtracting the autocracy score from the democracy score. The resulting unified Polity2 scale ranges from +10 (strongly democratic) to −10 (strongly autocratic).
• Executive constraints: This refers to the extent of institutionalized constraints on the decision-making powers of chief executives, whether individuals or collectives, where any ‘accountability group may impose such limitations’. This variable, which is also from the Polity IV Dataset, ranges from one to seven, wherein the larger the value, the larger the degree of constraints on the executive.
• Institutionalized democracy: This measure covers three aspects: (i) the presence of institutions and procedures through which citizens can express effective preferences about alternative policies and leaders; (ii) the existence of institutionalized constraints on the exercise of power by the executive; and (iii) the guarantee of civil liberties to all citizens in their daily lives and acts of political participation. This variable, which is drawn from the Polity IV Dataset, ranges from zero to ten, wherein the larger the value, the larger the degree of institutionalized democracy.
• Institutionalized autocracy: This measure defines the presence of a distinctive set of political characteristics including (i) the competitiveness of political participation; (ii) the regulation of political participation; (iii) the openness and competitiveness of executive recruitment; and (iv) constraints on the chief executive. This variable, which is also taken from the Polity IV Dataset, ranges from zero to ten, wherein the larger the value, the larger the degree of institutionalized autocracy.
• Bureaucracy quality: This index measures the degree to which the bureaucracy minimizes policy revisions when governments change. Therefore, this measure of shock absorption takes on larger points for countries where the bureaucracy has the strength and expertise to govern without drastic changes in policy or interruptions in government services. In these low-risk countries, the bureaucracy tends to be somewhat autonomous from political pressure and to have an established mechanism for recruitment and training. The related data come from the International Country Risk Guide (Howell, Reference Howell2011).
• Rule of law: This index, which is taken from the International Country Risk Guide (Howell, Reference Howell2011), measures the strength and impartiality of the legal system. It ranges from zero to six, wherein the larger the value, the lower the risk of partiality.
• Control of corruption: This index, which comes from the International Country Risk Guide (Howell, Reference Howell2011), measures potential corruption in the form of excessive patronage, nepotism, job reservations, ‘scratching each other's back’, secret party funding, and suspiciously close ties between politics and infrastructure capital. It ranges from zero to six, wherein the larger the value, the lower the control of corruption. The largest risk associated with corruption is that, if it becomes excessive or if some major scandal is suddenly revealed, it could spark a popular backlash with severe consequences. This could result in, for instance, a fall of the government, a major restructuring of the country's political institutions, or, at worst, a breakdown in law and order, rendering the country ungovernable.
• Government stability: This indicator is meant to assess both of the government's ability to carry out its declared program(s), and its ability to stay in office. We use data from the International Country Risk Guide (Howell, Reference Howell2011). The risk rating assigned is the sum of three sub-components: government unity, legislative strength, and popular support. Each of these items ranges from zero to four, wherein the larger the value, the lower the risk of instability.
In line with the empirical growth literature (see, for instance, Barro and Lee, Reference Barro and Lee1996; Mankiw et al., Reference Mankiw, Romer and Weil1992; Nawaz, Reference Nawaz2015; Sala-i-Martin, Reference Sala-i Martin1997), we use a vector of control variables including human capital, trade openness, financial development, and the growth rate of population in the estimated equations. Educational attainment is measured using average years of schooling of adults above 25 years of age. Annual population growth rate for year t is the exponential rate of growth of midyear population from year t − 1 to t, expressed as a percentage. Financial development is measured as the total amount of credit provided to the private sector as a percentage of GDP. Similarly, the trade openness of the sample countries is computed as the sum of imports and exports of goods and services as a ratio of GDP. The data for all these control variables, except for educational attainment, are obtained from the World Development Indicators (World Bank, 2017). The data on educational attainment are drawn from Barro and Lee (Reference Barro and Lee2013).
4. Results
This section provides the discussion about the estimation results we obtained from the empirical growth model where infrastructure, institutional quality, and the interaction between them, are our variables of interest. First, we present our baseline results, which are obtained by using Polity2 as an indicator of institutional quality. Then, we discuss the robustness of our baseline results by employing alternative and disaggregated institutional quality indicators as well as an alternative measure of infrastructural capital. Noting that pooled OLS and fixed effects estimations suffer from endogeneity problems associated with the dynamic nature of our growth model, we estimate our model by employing the system-GMM estimator (Arellano and Bond, Reference Arellano and Bond1991; Blundell and Bond, Reference Blundell and Bond1998).Footnote 4 To avoid the possibility of modeling business cycle fluctuations, we do not employ annual data for our estimation. Instead, we take the averages over 5 years, which results in a panel of seven non-overlapping 5-year periods (e.g. Levine et al., Reference Levine, Loayza and Beck2000).
Baseline results: the effects of infrastructure and institutional quality on growth
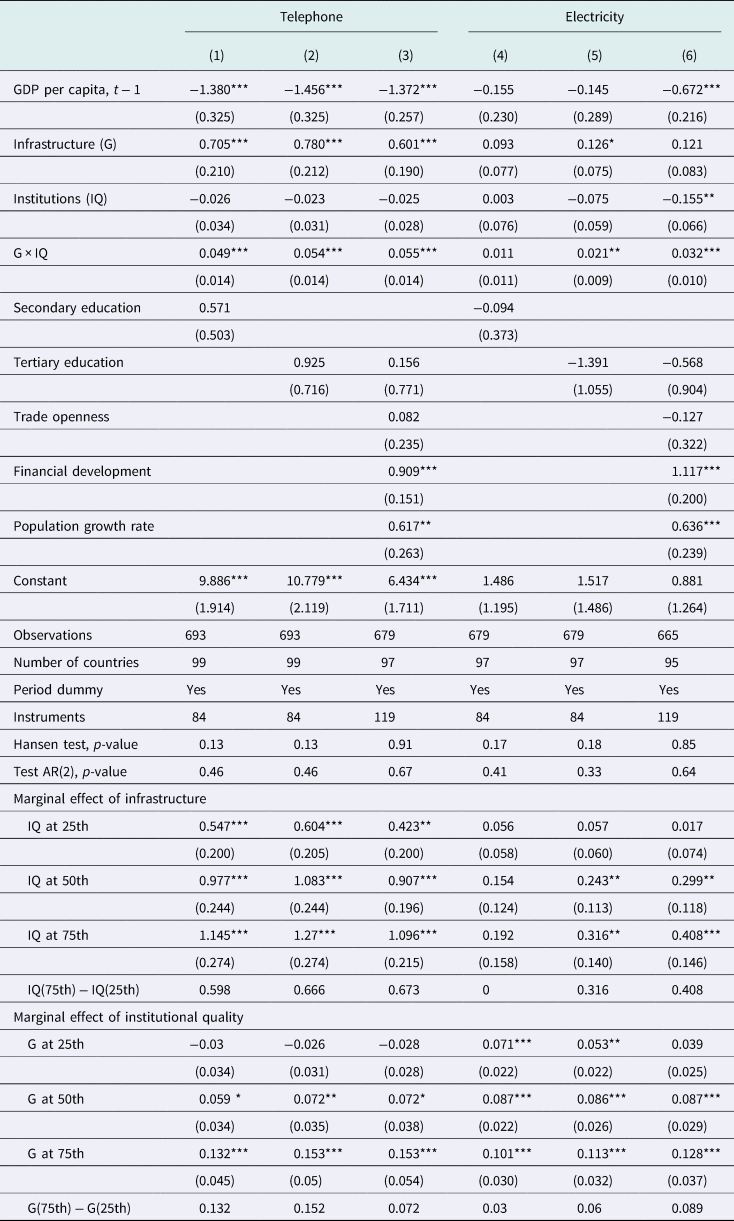
Table 2 documents the estimated effects of infrastructure, institutional quality, and their interaction on economic growth. These results are obtained employing the two-step system-GMM estimator, which addresses the problems of endogenous explanatory variables and time-invariant omitted variables.Footnote 5 The table presents results for two infrastructure capital indicators. In particular, although columns (1), (2), and (3) employ the fixed telephone subscriptions per 100 people (hereinafter telephone), columns (4), (5), and (6) use electric power generation in kWh per capita (hereinafter electricity) to proxy infrastructural capital. For all specifications, institutional quality is proxied by Polity2. In columns (1) and (4), the conditioning set includes only two variables: the lagged GDP per capita and human capital measured by the average years of secondary education. In columns (2) and (5), we use the average years of tertiary education as an alternative indicator of the level of human capital. The most comprehensive specifications, columns (3) and (6), additionally control for trade openness, financial development, and population growth rate. Therefore, our discussions and graphical visualizations of the estimation results will mainly rely on results documented in columns (3) and (6).
System-GMM estimation baseline results

Notes: The dependent variable is GDP per capita growth over 5 years. For the following regressors, the natural logarithms are used: lagged GDP per capita, average years of education, trade openness, and financial development. Results are obtained by employing the system-GMM estimator for dynamic panel data models. Standard errors in parenthesis are the Windmeijer robust standard errors. Significance at the 1%, 5%, and 10% levels is indicated by ***, **, and *, respectively.
Before discussing the estimation results documented in Table 2, it is noteworthy that the coefficient estimates for infrastructure and institutional quality represent the partial effect of one of the variables on economic growth for the empirically irrelevant scenarios when the other variable takes on a value of zero (see, e.g. Balli and Sørensen, Reference Balli and Sørensen2013; Brambor et al., Reference Brambor, Clark and Golder2006). Hence, we refrain from interpreting these coefficients and instead compute the marginal effects and the corresponding standard errors of infrastructure by setting institutional quality at the 25th, 50th, or 75th percentile of its distribution.
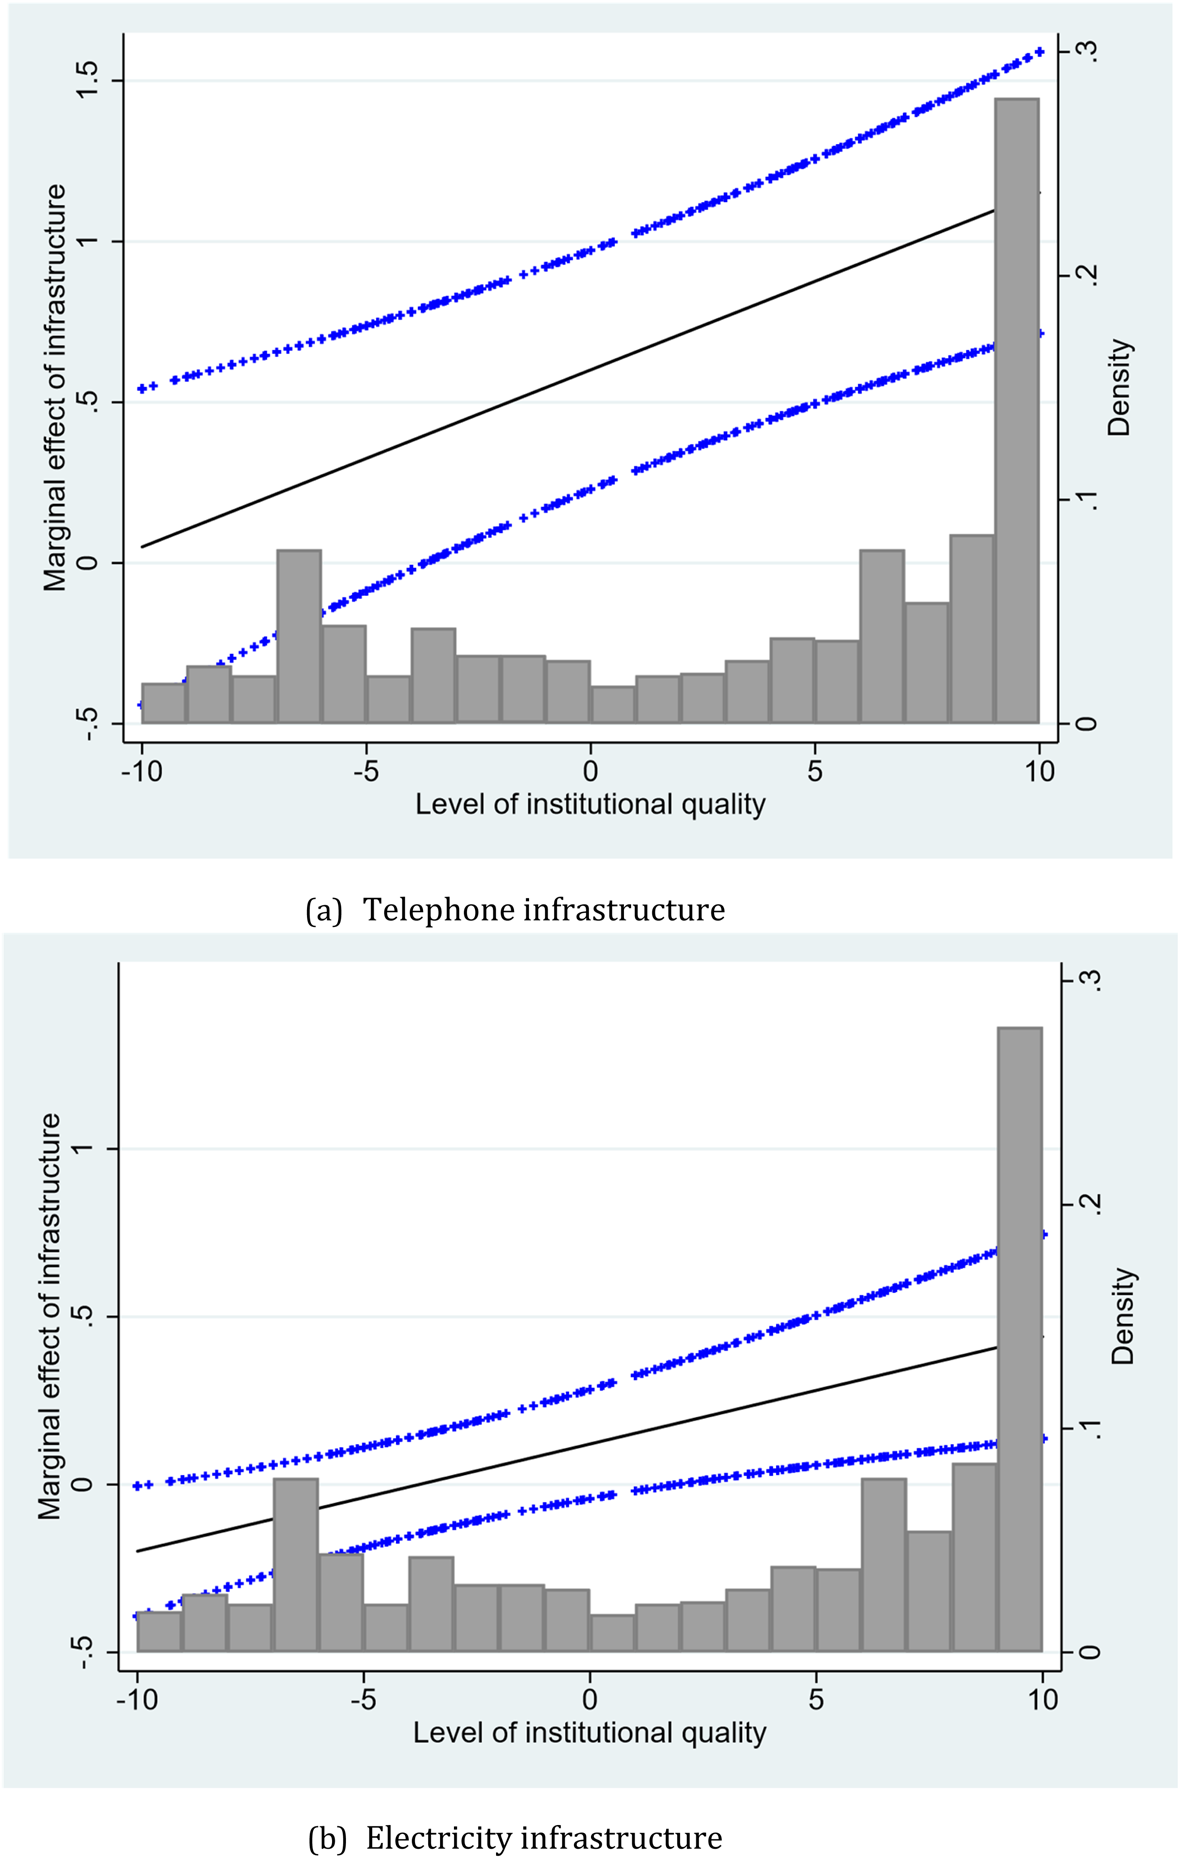
Furthermore, Table 2 provides the marginal effects of infrastructure on economic growth at the three different levels of institutional quality. These results show that infrastructure capital has a significantly positive marginal effect on economic growth at all the considered levels of institutional quality and in most of the specifications. The only exception is that the marginal effect becomes insignificant when infrastructure is measured by means of electricity and institutional quality is low at the 25th percentile. Plotting this effect at all observed levels of institutional quality, the graphs in panels (a) and (b) of Figure 1 also confirm that infrastructure promotes economic growth at higher levels of institutional quality, whereas its marginal effect lacks statistical significance at very low levels of institutional quality. Hence, these results support our hypothesis that the marginal effect of infrastructure on economic growth depends positively on the level of institutional quality.
The marginal effect of infrastructure on economic growth. The solid lines in panels (a) and (b) depict, respectively, the marginal effects of telephone infrastructure and electricity infrastructure on economic growth. Panels (a) and (b) are, respectively, derived from the system-GMM regression results documented in columns (3) and (6) of Table 2. For instance, the solid line in panel (a) is computed as 0.601 + 0.055 × IQ, where IQ is the level of the institutional quality indicator, Polity2. The dotted lines represent the 95% confidence intervals. The histograms in the figures provide the distribution of Polity2, which ranges from −10 to 10.

It is noteworthy that the statistical significance of the dependence on institutional quality of the efficacy of infrastructure is shown by the significance of the interaction term between infrastructure and institutions, which turns out to be positive and statistically significant in most of the specifications. The significant interaction terms are the slopes of the marginal effects plots in Figure 1. This dependence is also of sizable economic importance. For instance, if the level of institutional quality of a country improves from the 25th percentile to the 75th percentile, the marginal effect of infrastructure on (5-years) economic growth increases by 67.4 and 39.1 percentage points in columns (3) and (6), respectively. This difference is economically sizable, especially in light of the fact that our dynamic panel data estimates are not due to simultaneity bias or omitted variables. Apparently, telephone infrastructure has a more robust and pronounced growth-promoting effect than does electricity infrastructure. However, it is also worth emphasizing that both telephone and electricity infrastructure exert positive marginal effects on economic growth in most prevailing levels of institutional quality and that marginal effects increase with improving institutional quality.
The bottom panel of Table 2 presents the marginal effects of institutional quality on economic growth at typical levels of infrastructure. The results show that the marginal effect of institutional quality is generally not significant at the 25th percentile of the infrastructure distribution, whereas the marginal effect becomes significantly positive when the level of infrastructure increases to the 50th and 75th percentiles.Footnote 6 The result implies that the dependence of the marginal effect of institutional quality on the level of infrastructure is relatively less important compared to the dependence of the marginal effect of infrastructure on the level of institutional quality. Hence, we focus on the dependence of the growth-promoting effect of infrastructure on institutional quality, which is the main focus of this paper.
The fact that the variables in the conditioning information set generally carry expected signs lends support for our growth model specifications. In particular, the effects of education on growth are not statistically significant. These results may be explained by noting that institutions and education are strongly correlated (see, for instance, Glaeser et al., Reference Glaeser, La Porta, Lopez-de Silanes and Shleifer2004 and Bhattacharyya, Reference Bhattacharyya2009). One can argue that a high correlation between the two predictors may induce multicollinearity, making it challenging to disentangle separate effects. The effect of trade openness is also not significant, which could also be explained by noting the correlation between trade openness, infrastructure, and institutional quality, making it difficult to estimate individual effects. Corroborating empirical evidence in several studies, for example Levine et al. (Reference Levine, Loayza and Beck2000), financial development has a significantly positive effect on economic growth in both specifications where it is included. Perhaps, somehow unexpected is the consistently positive and significant effect of population growth rate on economic growth. However, there is also no consensus in the literature on the role of population growth in economic development. Specifically, the net effect of population growth on economic growth depends on whether greater population's contribution for human capital and expansion of knowledge outweighs its role in diminishing returns to natural resources (see, e.g. Becker et al., Reference Becker, Glaeser and Murphy1999).
Finally, our specification tests support the validity of our instruments. In particular, as we are able to reject autocorrelation of order two, but not one, we use the second and third lags of the variables in levels as instruments for the equations in first differences. Hence, nowhere among the regressions did the overidentification and AR(2) test statistics show any evidence of poor instrument choice or bad specification of the model at the 95% confidence level. Thus, the dynamic panel findings are fairly reliable and support the view that institutional quality exerts a large impact on the efficacy of infrastructural capital.
Therefore, our estimation results imply that both infrastructure capital and institutional quality are crucial for economic growth even after addressing possible omitted variables and endogeneity problems by means of GMM-based panel data estimators. Moreover, although it is a common practice to consider the impacts of the two factors on economic growth separately (e.g. Acemoglu et al., Reference Acemoglu, Johnson and Robinson2005; Calderón et al., Reference Calderón, Moral-Benito and Servén2015; Flachaire et al., Reference Flachaire, García-Peñalosa and Konte2014), our use of interaction terms yields results which confirm that infrastructure and institutions are complementary to each other in their effects on economic growth.
Robustness checks
We check if our baseline results on the positive impact of institutional quality on the efficacy of infrastructural capital on economic growth are robust to the use of a variety of alternative institutional quality measures and distinct indicators of infrastructure capital. Noting that corruption is arguably the most apparent linking factor between institutional quality and the growth-promoting role of infrastructure, this robustness checks also helps us to examine if other aspects of institutional quality have any effect over and above the effect captured by corruption.
Acknowledging the potential limitations of our baseline estimations' reliance on Polity2 as the only measure of the quality of political institutions, we consider two groups of alternative institutional quality indicators. The first group consists of three indicators that are taken from the Polity IV Project dataset whereas the second group includes four indicators from the Country Risk Guide (ICRG) dataset. Following Docquier et al. (Reference Docquier, Lodigiani, Rapoport and Schiff2016), we can classify these two datasets into de jure and de facto measures of institutional quality. Accordingly, the ‘Polity2’, ‘democracy’, ‘autocracy’, and ‘executive constraints’ are constructed based on expert coding of legal documents and can, therefore, be interpreted more as de jure measures. On the other hand, the ‘bureaucratic quality’, ‘rule of law’, ‘control of corruption’, and ‘government stability’ indices are based largely on subjective analysis and can, therefore, be seen as de facto measures of institutional quality.
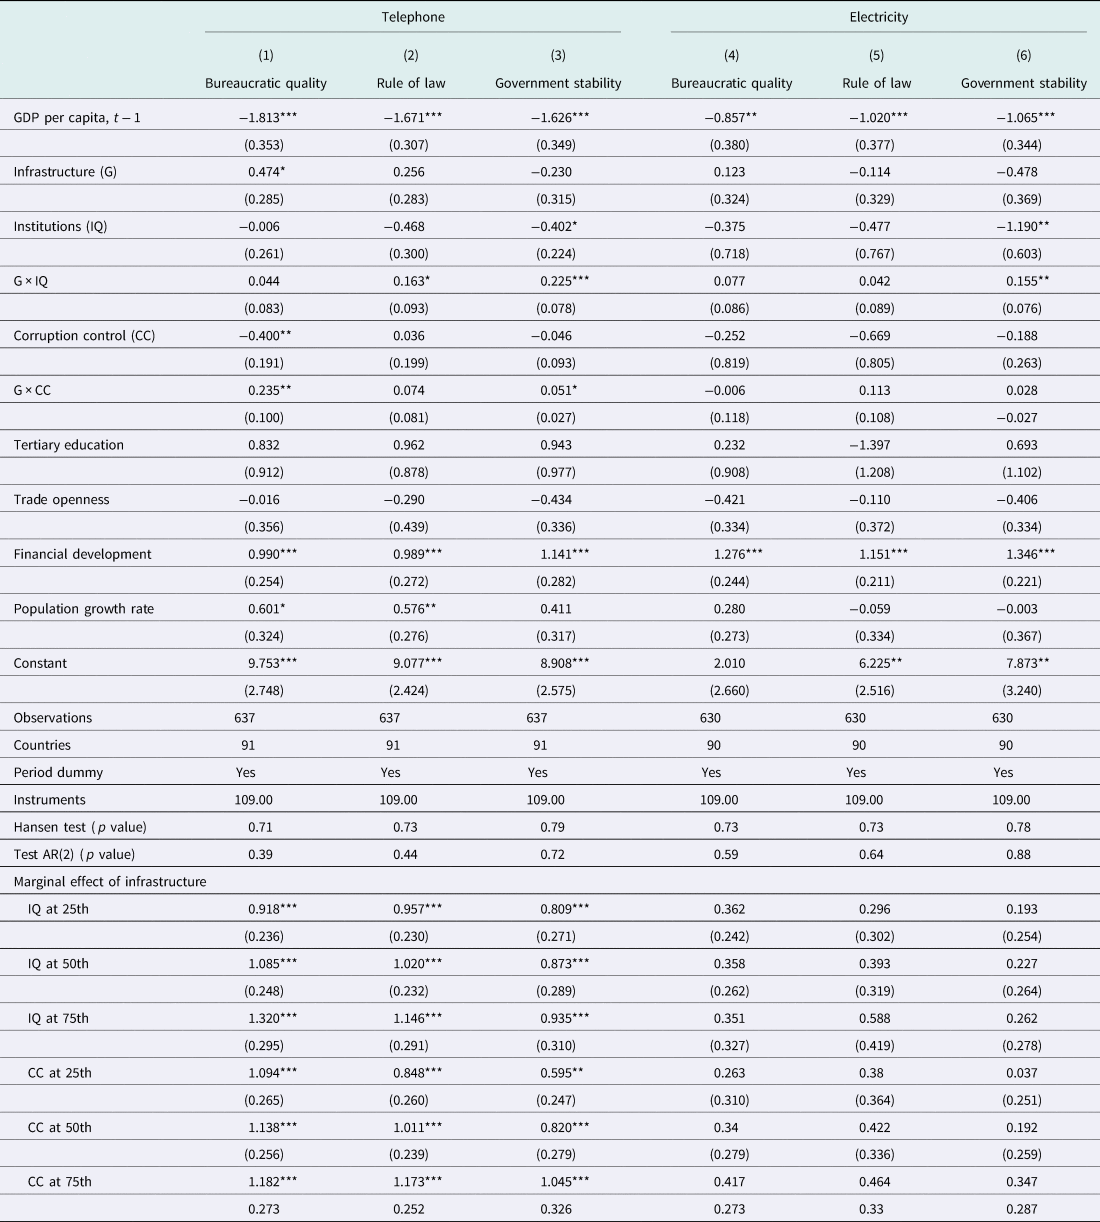
This robustness check is done in two ways. First, we replace Polity2 by the aforementioned disaggregated institutional quality measures, using one measure at a time. These results, which are available from the authors upon request, are qualitatively similar to our baseline results and imply that political institutions play a crucial role in determining the effect of infrastructure capital on economic growth.
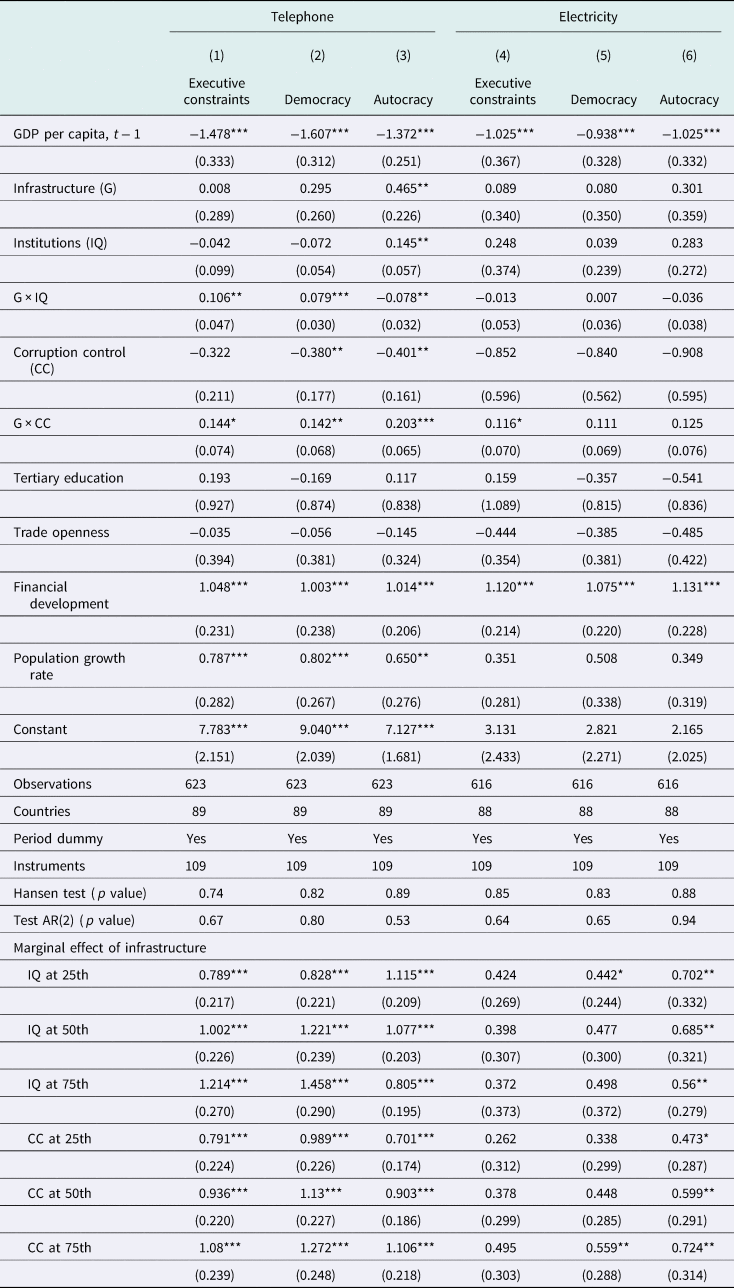
Second, and more interesting, we enter each disaggregated institutional quality measure together with corruption in our growth regressions. The prevalence of corruption has been repeatedly singled out in the literature as a crucial determinant of the efficacy of infrastructure capital for economic productivity. However, we have argued in Section 2 that other dimensions of institutional quality, such as government stability, bureaucratic quality, and the rule of law, could also play an important role in determining the efficacy of infrastructure in promoting economic growth. Hence, putting disaggregated institutional quality measures in the same regression with control of corruption helps us to examine if other aspects of institutional quality have any effect on the efficacy of infrastructure once the effect of corruption is taken into account. Corresponding results are reported in Tables 3 and 4. Results from both tables depict similar pictures: de jure (constraints on executives, democracy, and autocracy), as well as de facto (the rule of law and government stability) institutional quality indicators significantly determine the efficacy of telephone infrastructure even after the effect of corruption, is taken into account. Of all the considered indicators, only the interaction between bureaucratic quality and infrastructure is not statistically significant after the impact of corruption is controlled for. This is likely due to the high correlation between bureaucratic quality and corruption.
Effects of de jure institutional quality indicators beyond that of corruption

Notes: Results are obtained by employing the system-GMM estimator for dynamic panel data models. Marginal effects of infrastructure on economic growth at varying levels of institutional quality (corruption control) are computed by setting corruption control (institutional quality) at its mean value. Standard errors in parenthesis are the Windmeijer robust standard errors. Significance at the 1%, 5%, and 10% levels is indicated by ***, **, and *, respectively. For further notes, see Table 2.
Effects of de facto institutional quality indicators beyond that of corruption

Notes: Results are obtained by employing the system-GMM estimator for dynamic panel data models. Marginal effects of infrastructure on economic growth at varying levels of institutional quality (or corruption control) are computed by setting corruption control (or institutional quality) at its mean value. Standard errors in parenthesis are the Windmeijer robust standard errors. Significance at the 1%, 5%, and 10% levels is indicated by ***, **, and *, respectively. For further notes, see Table 2.
On the contrary, almost all interaction terms between electricity infrastructure and the disaggregated de jure and de facto measures lack statistical significance when corruption is taken into account. These results could be explained by noting the fact that electricity infrastructure has a weaker (and mostly not statistically significant) marginal effect on economic growth than telephone infrastructure. Supporting this view, the interaction term between electricity infrastructure and corruption is not significant in any of the specifications even when corruption is excluded from the models (results available upon request). Hence, our results show that it is not just the prevalence of corruption that affects the growth-promoting role of corruption. Other dimensions of institutional quality, such as constraints on executives, democracy, autocracy, the rule of law and government stability, affect the infrastructure-growth nexus over and above the effects of corruption.
Our next robustness check involves employing an alternative measure of the telephone infrastructure. Following the emergence of the information and communication technology, cellular phones have become more popular since the 1990s. In the baseline analysis, we used the fixed line telephone subscriptions as a proxy for infrastructure capital. Re-estimating our baseline model by using the total number of telephone subscriptions per capita (both fixed-line and cellular) as a proxy for infrastructure capital, we find that the interaction terms between infrastructure and institutions have statistically significant effects with expected signs in most of the specifications. Therefore, these results, which are available from the authors upon request, confirm the robustness of our baseline results to using a more comprehensive telephone infrastructure indicator.
5. Conclusion
The current study revisits the ongoing debate on the determinants of long-run economic growth with a specific focus on the roles of infrastructure capital and political institutions. Our hypothesis is that the marginal effect of the infrastructure capital on economic growth depends on the quality of existing political institutions, that is the better the institutional quality, the larger the productivity of infrastructure. In order to address potential econometric concerns concerning endogeneity and reverse causality, we estimate our growth model employing system-GMM dynamic panel data estimations.
Our results show that there is a positive correlation between infrastructure capital and economic growth in countries with good institutional quality, but this relationship weakens as institutional quality deteriorates. These results are robust to the use of different specifications and estimators and hold across a range of alternative indicators of infrastructure (telecommunication subscriptions and electric power generation) and political institutions (democracy, autocracy, executive constraint, bureaucratic quality, the rule of law, and government stability). We provide two potential explanations for these results.
First, political institutions, even in the absence of a significant direct effect (Flachaire et al., Reference Flachaire, García-Peñalosa and Konte2014), are a central element in the growth process since they determine the marginal effect on economic growth of standard growth determinants such as infrastructural investment. More precisely, countries with democratic institutional frameworks (binding legislature) have a higher level of economic growth, whereas authoritarian regimes (nonbinding legislatures) adversely affect economic growth (Wright, Reference Wright2008). Second, regulations are important mechanisms to increase the productivity of public investments as inefficiency is pervasive in public-owned investments. Dal Bó and Rossi (Reference Dal Bó and Rossi2007) and Corrado and Rossetti (Reference Corrado and Rossetti2018) show that a higher level of corruption is significantly associated with a lower degree of efficiency in using infrastructure capital. Moreover, when countries have a weaker commitment to power and regulatory capacity, potential returns from infrastructure might be lower due to weak contract enforcement, expropriation, and opportunistic renegotiations (Straub, Reference Straub2011).
It is also noteworthy that our results do not just reflect the detrimental effect of corruption on the growth-promoting role of infrastructure. By including both corruption and other de facto and de jure measures of institutional quality in the same empirical growth models, we find that other de jure (constraints on executives, democracy, and autocracy), as well as de facto (the rule of law and government stability) institutional quality indicators significantly determine the efficacy of telephone infrastructure even after the effect of corruption, is taken into account. This leads us to conclude that it is not just the prevalence of corruption that affects the growth-promoting role of corruption. Other dimensions of institutional quality, such as constraints on executives, democracy, autocracy, the rule of law, and government stability, affect the infrastructure-growth nexus over and above the effects captured by corruption.
Finally, it is noteworthy that the current study has the following limitations. First, both the theoretical model and the empirical estimation do not address the issue of infrastructure quality. Second, the study does not distinguish between private and public ownerships of the infrastructure capital. Third, due to a lack of a sufficiently large panel data for other infrastructure sectors, such as transportation, water, and irrigation, we only use the telephone subscriptions and electric power generation as proxies for infrastructure capital. Fourth, our empirical models assume that current values are time-invariant linear functions of the past values. However, this assumption might be too restrictive when we consider certain scenarios such as the adaptation of the legal system to technological progress. Addressing these limitations, including a flexible time-variant semi-parametric modeling of the joint effects infrastructure capital and institutional quality, is left for future research.
Acknowledgements
Financial support from Universitat Rovira i Virgili and Generalitat de Catalunya (2018PFR-URV-B2-53) and Ministerio de Econom´ıa y Competitividad (ECO2016-75410-P (AEI/FEDER, UE)) is acknowledged. We also acknowledge Françeska Tomori for her comments and technical supports.
Appendix A
Theoretical framework
Our theoretical model builds upon the endogenous growth model of Barro (Reference Barro1990), which incorporates infrastructure capital as one factor of production. Besides, following Canning and Pedroni (Reference Canning and Pedroni2008), we specify a Cobb–Douglas type production function and apply the model to panel data as

where the countries and time periods are indexed by i and t, respectively. Aggregate output Y is produced by employing (non-infrastructure) aggregate capital stock K, infrastructure capital stock G, aggregate hours worked by the labor force L, and total factor of productivity A. For simplicity, it is assumed that infrastructure capital is a fixed fraction τ it of total savings s. It can be shown that there is a growth and welfare-maximizing level of investment in the infrastructure capital τ* (Canning and Pedroni, Reference Canning and Pedroni2008; Straub, Reference Straub2011). Note that, without shocks in infrastructure capital, given by τ* = β|α + β (Barro, Reference Barro1990).
Furthermore, Canning and Pedroni (Reference Canning and Pedroni2008) show that the proportion of investment going to infrastructure is $\tau _{it} = \bar{\tau} + \mu _{it}$ where μ it is a zero-mean stationary series. Accordingly, in the endogenous growth model, a positive shock to the infrastructure capital will increase income per capita when $\bar{\tau} \lt \tau ^*$
 and income per capita will decrease when $\bar{\tau} \gt \tau ^*$
 .Footnote 7 The marginal cost of the increased infrastructure capital is the diversion of resources from other productive sectors, whereas the marginal benefit is the gain in the long-run income (Straub, Reference Straub2011).
However, Aron (Reference Aron2000) argues that in growth models, the presence of threshold levels of certain inputs such as infrastructure must be in place before production is feasible. Hence, the constant returns to scale assumption may not be satisfied. Thus, the effect of infrastructure capital on output can be dependent on country-specific institutional variables. To capture this notion, we redefine the production function specified in (A.1) by including rent-seeking activities that act as a distortion in the production process. Our new production function model is adapted from Nawaz et al. (Reference Nawaz, Iqbal and Khan2014) and given as

where $\eta _{it}\in [ {0,\hat{\eta}} ]$ , $\hat{\eta} \ll 1$
 denotes rent-seeking behavior.
In our model, institutional quality is captured by rent-seeking as a proxy. Formally, $\hat{\eta}$ is the point at which rent-seeking is the highest (institutional quality is the lowest).
We assume that each firm uses all its capacity to appropriate as much rent as possible, which is dependent on the total amount of rent and the quality of institutions. When r it = 0, it indicates the presence of high institutional quality, whereby an agent extracts less rent. On the contrary, when r it = 1, institutional quality hits its lowest level, and hence, the marginal utility of rent-seeking reaches its maximum (Nawaz et al., Reference Nawaz, Iqbal and Khan2014). Thus, the level of r it determines the marginal productivity of infrastructural investment.
In contrast, good institutional quality improves the efficiency of infrastructure capital as resources are prevented from being wasted in rent-seeking activities, so they lead to higher economic growth. Furthermore, to predict the long-run growth patterns, it is important to test the consumption and investment decisions made by individual agents. In doing so, we assume that a representative agent is facing an infinite planning horizon and maximizing utility subject to a dynamic budget constraint. As a result, the agent seeks to maximize inter-temporal utility, which is defined as

where C it denotes consumption per capita, and we assume that 0 < σ < 1. This implies that the elasticity of marginal utility equals the constant −σ. Moreover, e −ρt represents the time preference rate, where ρ > 0 is a time discount factor. By assuming that other elements of the production function are constant in (A.2) for simplification, the dynamic budget constraint of infrastructure in per capita terms is subject to:

where a dot over a variable denotes a time derivative. It is assumed that the infrastructure capital stock is G (0) = 1 at the initial period. The terminal condition is given as lim t→∞Gλe −ρt = 0, which indicates that the infrastructure capital stock left over at the end of the planning horizon is zero. In (A.4) we can observe that increases in the infrastructure capital stock (where τ < τ*) are equal to the total saving, which in turn, is equal to the difference between output and consumption. Hence, in this case, the individual agent chooses depending on whether the specificity you wish to indicate optimal consumption [C it:t ≥ 0] and investment path to determine the level of infrastructure capital stock [G it:t ≥ 1]. To find this optimal allocation of resources by the individual agent, Nawaz et al. (Reference Nawaz, Iqbal and Khan2014) suggest to apply Hamiltonian function, which is given by

In (A.5), the expression within the square brackets is equal to $\dot{G}_{}$ and λ is the Lagrange multiplier representing the present value of the shadow price of income. Differentiation of the Lagrange function with respect to C it and G it yields the first-order conditions

and

From (A.6) and (A.7) and fixing the infrastructure capital stock G(0) = 0, the transversality condition equals lim t→∞Gλe −ρt = 0. Using the budget constraint in (A.4), the growth rate of per capita consumption, which is the same as the growth rate of output and infrastructure capital, is given as follows:

and

The outcome in (A.8) indicates that as institutional quality improves, rent-seeking activities decrease. In our context, this implies that high institutional quality enhances the productivity of infrastructure capital. Finally, differentiating (A.9) with respect to rent-seeking activities obtains

which shows that as η it increases, economic growth decreases if σ > 0.
After a logarithmic transformation, model (A.9) is written as

where $\dot{y}_{it}$ denotes the GDP per capita growth rate for country i at time period t, I it represents an indicator of institutional quality, G it stands for infrastructure capital, and I it × G it is the interaction term between institutions and infrastructure.
Finally, it is noteworthy that the theoretical model discussed above indicates that the higher η it, the lower the economic growth will be due to less productivity of the infrastructure capital and vice versa. The validation of the statement, therefore, specifies that when η it = 0 (in the case of strong institutions) the economic growth is with $(1/\sigma )[ {A_{it}\cdot K_{it}^\alpha \cdot \beta G_{it}^\beta \cdot L_{it}^{1-\alpha -\beta} -\rho} ]$ higher than the economic growth under weak institutions $0 \lt \eta _{it} \lt \hat{\eta} _{}$
 , which is given by $(1/\sigma )[ {\lpar {1-\eta_{it}} \rpar A_{it}\cdot K_{it}^\alpha \cdot \beta G_{it}^\beta \cdot L_{it}^{1-\alpha -\beta} -\rho} ] .$

Appendix B
List of countries covered by the study
Albania, Algeria, Argentina, Australia, Austria, Bangladesh, Belgium, Benin, Bolivia, Botswana, Brazil, Bulgaria, Burundi, Cameroon, Canada, Central African Republic, Chile, China, Colombia, Dem. Rep. Congo, Rep. Congo, Costa Rica, Cote d'Ivoire, Cyprus, Denmark, Dominican Republic, Ecuador, Arab Rep. Egypt, El Salvador, Fiji, Finland, France, Gabon, The Gambia, Germany, Ghana, Greece, Guatemala, Guyana, Honduras, India, Indonesia, Islamic Rep. Iran, Ireland, Israel, Italy, Jamaica, Japan, Jordan, Kenya, Rep. Korea, Lesotho, Luxembourg, Malawi, Malaysia, Mali, Mauritania, Mauritius, Mexico, Mongolia, Morocco, Mozambique, Namibia, Nepal, Netherlands, New Zealand, Nicaragua, Niger, Norway, Pakistan, Panama, Papua New Guinea, Paraguay, Peru, Philippines, Portugal, Rwanda, Saudi Arabia, Senegal, Sierra Leone, Singapore, South Africa, Spain, Sudan, Swaziland, Sweden, Switzerland, Tanzania, Thailand, Togo, Tunisia, Turkey, Uganda, United Kingdom, United States, Uruguay, Venezuela, Zambia, Zimbabwe.