I. INTRODUCTION
Device miniaturization and shrinking internal material length scales have pushed the mechanics community to investigate deformation and fracture behavior of materials at ever smaller length scales. The principal problem that crops up with reducing sample dimensions is that size effects cannot be accounted for by direct extrapolation of known properties at the macroscale. Two of the most widely known size effects pertaining to strength of materials deal with the extrinsic (smaller is stronger) Reference Dehm, Motz, Scheu, Clemens, Maryhofer and Mitterer1–Reference Greer and Hosson3 and intrinsic (Hall–Petch like effects) Reference Chokshi, Rosen, Karch and Gleiter4,Reference Carlton and Ferreira5 material length scales, respectively. Although known as a characteristic material property, many reports on K IC for the same given materials show variations due to the geometry, sample dimensions, and preparation techniques. One example is that of pure single crystal silicon, Si(100), a homogeneous, and ideally elastic–brittle material. The reported K IC as found from tension, bending, and indentation experiments both at the bulk and small-scales for Si(100) shows a wide scatter, anywhere from 0.7 to 2.1 MPa m1/2. Reference Chen and Leipold6–Reference Tanaka, Higashida, Nakashima, Takagi and Fujiwara10 The largely agreed value though is between 0.7 and 1.3 MPa m1/2 for single crystal Si. Reference Ritchie11 One of the reasons for this scatter in reported values could be due to the inability at small length scales to strictly adhere to the ASTM standards, which prescribe exact sample dimensions and crack sizes for a valid fracture toughness test. 12 As the sample dimensions become smaller, the relative plastic zone size becomes larger and hence maintaining plane strain and linear elastic fracture mechanics (LEFM) conditions becomes difficult, which in turn bring in the controversy as to whether the observed size effect is real or apparent. To avoid underestimation of fracture toughness and unsubstantiated safety factors, the material is tested best at the scale at which it is used in real application. Also in some cases, the amount of material available is scarce, in which case one is forced to determine fracture properties within the available small volume. Moreover, bulk scale testing can lead to loss of information, especially in materials showing stable crack growth and R-curve behavior, due to overload or during fatigue precracking of such specimen.
The development of instruments to both apply and measure loads and displacements accurately as well as to observe the deformation as it proceeds in situ at smaller dimensions has enabled fracture toughness testing of materials at micrometer and nanometer sizes to become a reality. Reference Yawny, Malarria, Soukup and Sade13 Simultaneously, there has been a spurt in the availability of micromachining techniques like focused ion beam (FIB) machining, lithography, deep reactive ion etching (DRIE), and laser machining to prepare samples at ever smaller dimensions. Reference Jaya and Alam14 Specially equipped scanning electron microscopes (SEM) are being used today as microlaboratories, replacing bulk tests. Reference Ipina, Yawny, Inman, Farrar, Lopes and Steffen15,Reference Podor, Ravaoux, Brau and Kazmiruk16 Testing in situ inside the SEM enables using smaller specimens but on the flip side, smaller sample sizes make it difficult to maintain LEFM and plane strain conditions in materials with significant plasticity. Also an expanding process zone in a material with a rising R-curve cannot be captured beyond a critical crack length (a)/specimen width (w) ratio, since the crack begins to “see” the free surface after a point. Reference Jaya, Bhowmick, S Asif, Warren and Jayaram17 Information on the processes within the interior of the material is lost, since SEM imaging gives only surface information. This causes a problem in observing the actual toughening mechanisms operating in the material. In spite of these general limitations for in situ fracture toughness tests inside the SEM, there are several advantages that such instruments provide to probe small volumes. In situ testing allows simultaneous and synchronous recording of the load–displacement information and crack initiation and propagation events. This enables fracture loads to be precisely noted, as also accurate determination of crack opening displacements (COD) via direct observation or by digital image correlation (DIC), important in fracture mechanics experiments at the small-scale. For materials exhibiting a rising fracture toughness (R-curve), in situ imaging allows one to capture the crack trajectory during different stages of crack growth under both static and cyclic loads, enabling determination of the fracture and fatigue mechanisms at the small-length scale. Reference Jaya, Bhowmick, S Asif, Warren and Jayaram17 The same does not apply to brittle systems exhibiting very high crack propagation velocities and catastrophic failure though. But sufficient care needs to be exercised in separating out the actual material displacements from that due to the instrument, even in sufficiently stiff machines, because smaller loads and displacements are involved. Reference Oliver and Pharr18 This is especially important in material systems where stable crack growth is hard to achieve. The loading system is expected to have a frame stiffness much higher (by 2–3 orders of magnitude) than the material being tested but this may not always be the case at smaller dimensions. For instance, commercial nanoindenters used inside the SEM for in situ measurements have a high load frame compliance (over 10 nm/mN Reference Vliet, Prchlik and Smith19 –Reference Kupka21 ), which is at least an order of magnitude higher than conventional universal testing machines (0.16 nm/mN Reference Huerta, Corona, Oliva, Aviles and Gonzalez-Hernandez22 ). This prevents a stiff enough machine required to achieve true fixed-grip conditions. Although, using nanoindenters is better than using AFM or micromanipulators with an even higher compliance, the fraction of the energy that is stored in the load frame is still a large part of the total energy expended in carrying out tests at the small scale. Displacement control is a prerequisite for stable crack growth under most geometries. The presently available indenter systems are often intrinsically load controlled but provide for depth control via a feedback loop from the displacement sensor. The frequency of this feedback channel (∼80 kHz for the Hysitron PI series) is sufficient to provide true depth control for routine indentation tests, but falls short of matching the velocity of crack propagation. The depth change during the associated pop-in in the load (P)–displacement (d) curve is much more rapid and hence difficult to control. Reference Fischer-Cripps23 Therefore, accurate R-curve measurements in such systems may be difficult to perform. The ASMEC UNAT-2 setup used in the present work is intrinsically displacement controlled using highly compliant springs (>1000 nm/mN), which adds versatility to the type of tests that can be carried out but hinders controlled crack propagation in fracture studies. Peret and Rodrigues Reference Peret and Rodrigues24 elaborate on the importance of machine stiffness in attaining stable crack propagation in displacement controlled three point bend tests, highlighting the effect of the stored elastic energy in some of the low stiffness machine parts. The release of this energy during crack propagation will result in instabilities and increase speed of propagation.
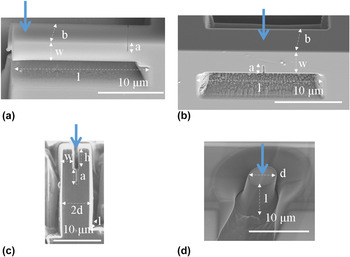
Given the discrepancies that exist in reported values of K IC of Si in the literature, the effect of four different microscale testing geometries (Fig. 1) on the fracture toughness of single crystal Si(100) was probed in the present work. Instead of round robin tests that are carried out between different groups to establish material properties objectively, we applied different test methods to analyze whether differences arise in the deduced fracture toughness values. Extraneous effects that arise due to change in the investigator, sample dimensions, and purity were eliminated by restricting all the tests to one single Si(100) wafer, micromachined by the FIB to similar beam dimensions on an average and loaded using an indenter in situ inside the SEM. Since the plastic zone size of Si is not larger than 0.25 µm (with a conservative estimate assuming a K IC of 0.75 MPa m1/2 and a yield stress σy of 500 MPa Reference Ritchie11 ), the sample dimensions chosen here adhere to LEFM and plane strain conditions. K IC as determined from all the four chosen geometries is reported along with a discussion on the advantages and limitations of each of them. None of them are typical scaled down versions of bulk test geometries but show some resemblance to the macroscopic cases with several modifications. The choice of these four geometries was made because they are relatively new and specifically used in small-scale testing. Being nonstandard geometries, it is important to compare the K IC's obtained from them in a single given material with known fracture toughness, which has not been done before. Pure, single crystal Si in a given orientation was chosen to avoid effects of interfaces and alloying additions on a property like fracture toughness which is known to be very sensitive to the above factors. Also, it was ensured that the initial notching and loading direction drive the crack in the same plane and direction in all the four cases. A discussion on the more general aspects affecting small-scale fracture toughness testing, like effect of FIB milling, finite value of notch root radius, sample dimensions compared to the plastic zone size, follows. A guideline for future users highlighting the usefulness of each geometry and possible sources of error is given in the end.
Four different geometries selected for fracture toughness testing at the small scale: (a) single cantilever bending, (b) clamped beam bending, (c) DCB, and (d) pillar splitting. All samples were machined and notched using the FIB on a straight edge of Si(100).

II. EXPERIMENTAL PROCEDURE
A Si(100) wafer was scratched by a diamond scribe and sliced to get a straight edge and mounted in the FIB (Zeiss AURIGA, Germany) for micromachining. Four different geometries were chosen from the literature for fracture toughness testing: (1) single cantilever bending Reference Matoy, Schoenherr, Detzel, Pippan, Motz and Dehm25 with 5 µm conical indenter tip; (2) clamped beam bending Reference Jaya, Jayaram and Biswas26 with 5 µm conical tip; (3) double cantilever bending (DCB) with 5 µm flat punch indenter tip Reference Liu, Wheeler, Howie, Zeng, Michler and Clegg27 ; and (4) pillar splitting Reference Sebastiani, Johanns, Herbert, Carasitti and M Pharr28 with cube corner indenter tip. Five samples were tested for each type. The custom-made indenter tips, made of B-doped diamond, were supplied by ASMEC GmbH (Germany). The governing dimension was in the range of few micrometers for all the sample geometries, as listed in Table I. This ensured that the LEFM and plane strain criteria were satisfied for Si. The test geometries with their exact dimensions and nomenclature used to describe them are shown in Fig. 1. Notches were milled at lower currents to act as starter cracks along (010)<001>. All the microbeams were milled at the straight edge using the following conditions: (a) 30 kV, 4 nA aperture for coarse cuts, (b) 30 kV, 600 pA aperture for final polishing and removal of redeposited material, and (c) 30 kV, 10 pA aperture for notching. Ga+ ion damage was minimized by viewing the milling process using the secondary electron (SE) imaging of the electron microscope. The sample was then loaded in a nanoindenter (ASMEC UNAT SEM-2) inside the SEM for direct viewing of the fracture process while simultaneously recording the load (P)–displacement (d) information. All the loading was carried out in open loop displacement control at ∼5 nm/s. Since the point of onset of contact was to be accurately determined for measurement of fracture loads, the indentation programme was setup such that the P–d curve was recorded while the indenter tip began to approach the surface from a distance about 500 nm away from the sample. This distance could be maintained accurately using the real-time SEM imaging. The point of onset of contact was defined as the point in the P–d curve when there was a transition from zero load to a finite load (which showed up as a spike in stiffness). This portion of the curve showing zero load was later subtracted. Cyclic load–unload was carried out with sufficient hold times to record every stage of crack growth. Crack propagation was detected as a pop-in the P–d curve and the exact crack length was measured by extracting the corresponding snapshots of the SEM images from the recorded video. Crack opening displacement was not measured in the present work since LEFM calculations suffice for Si, an ideally elastic brittle system, but it is of relevance to systems which exhibit significant crack tip plasticity. Such materials may also not display a clear pop-in but instead show gradual drop in stiffness of the P–d curve. Reference Jaya, Bhowmick, S Asif, Warren and Jayaram17 The fracture load corresponding to the crack propagation event was used as input in available analytical solutions Reference Matoy, Schoenherr, Detzel, Pippan, Motz and Dehm25,Reference Liu, Wheeler, Howie, Zeng, Michler and Clegg27,Reference Sebastiani, Johanns, Herbert, Carasitti and M Pharr28 for geometries 1, 3, and 4, respectively or in finite element method (FEM) simulated K I versus P curves (as carried out in ABAQUS 6.12 for geometry 2) Reference Jaya and Jayaram29 to extract the K IC. The simulation procedure for the clamped beam geometry was explained already in detail Reference Jaya, Jayaram and Biswas26 and will not be repeated here. The elastic modulus of Si(100) was taken to be 169 GPa as per the guidelines given for monocrystalline anisotropic Si. Reference Hopcroft, Nix and Kenny30
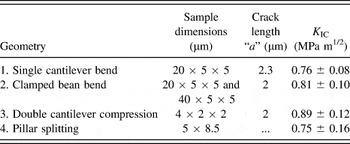
Fracture toughness of Si(100) as obtained from five valid tests in each geometry. The sample dimensions mentioned above are average values, with individual differences being attributed to minor shifts during FIB milling.

Specifications for a valid test for each individual geometry are given below:
A. Single cantilever bending
Beam dimensions should adhere to a l/w ratio greater than 4 and an initial a/w ratio ideally between 0.45 to 0.55. Reference Matoy, Schoenherr, Detzel, Pippan, Motz and Dehm25 The indenter position should be close to the free end at a minimum distance of four times the width of the beam from the initial notch, to minimize the shear component of loading. Reference Timoshenko and Goodier31 Large cantilever deformations can be accompanied by slipping of the indenter on the beam surface when the indenter does not possess sufficient lateral stiffness. Slipping shows up in the P–d curve as random displacement jumps not associated with any crack propagation. This can be avoided to an extent by using sharp indenters (which is mostly the case as seen from the literature Reference Liu, Wheeler, Howie, Zeng, Michler and Clegg27 ) but in such cases the indentation contribution to the total displacement has to be accounted for. In the other case, where a blunt wedge/conical tip is used, like in the present work, in situ imaging helps to correlate pop-in in the P–d curve to real crack propagation events. In the present work, no such slipping was observed. Elastic deformation must be ensured by cyclically loading and unloading below the expected fracture load a couple of times to check for any remnant displacement in the P–d curve. K I is given by Eq. (1a) (Ref. Reference Matoy, Schoenherr, Detzel, Pippan, Motz and Dehm25) and requires precise knowledge of beam dimensions, fracture load, and elastic modulus of the specimen material in the given orientation. This formula cannot be used if the crack deviates from its straight path and kinks at an angle instead, since this will violate mode I loading conditions.
 $$K_{\rm{I}} = {{P_{{\rm{max}}} l} \over {bw^{{\raise0.7ex\hbox{$3$} \!\mathord{\left/ {\vphantom {3 2}}\right.\kern-\nulldelimiterspace}\!\lower0.7ex\hbox{$2$}}} }}f\left( {{a \over w}} \right)\quad {\rm{,}}$$
 $$f\left( {{a \over w}} \right) = 1.46 + 24.36\left( {{a \over w}} \right) - 47.21\left( {{a \over w}} \right)^2 + 75.18\left( {{a \over w}} \right)^3 \quad {\rm{,}}$$
where P max is the fracture load, l, b, and w refer to beam dimensions, and a is the crack length as shown in Fig. 1(a). f(a/w) is the geometric factor Reference Matoy, Schoenherr, Detzel, Pippan, Motz and Dehm25 given by Eq. (1b).
B. Clamped beam bending
Beam dimensions should adhere to a l/w ratio between 4 and 8 and an initial a/w ratio between 0.3 and 0.5. A much shorter or longer starting crack length will not provide stable crack growth and also give rise to free surface effects. Reference Jaya and Jayaram29 The maximum principal stress that opens up the crack acts along the line connecting the notch tip and the indenter. Therefore, the indenter should ideally be positioned exactly across the notch for mode I loading but misalignments up to 5% of beam length are tolerable. The indenter tip should be sufficiently blunt to not cause indentation impressions or cracking. The test is no more valid if and when edge cracking initiates at the clamped ends. Maintaining larger l/w ratios prevents edge cracking. K I is obtained via extended finite element method (XFEM) simulations and has a sinusoidal dependence on a/w. Reference Jaya and Jayaram29 This is unlike the monotonic increase in K I that is seen as a function of a/w in other geometries. Though the general form of this dependence remains constant for this geometry, each case differing in sample dimensions has to be separately simulated for quantitative determination of K I in the absence of readily available analytical solutions.
C. Double cantilever bending
Beam dimensions should adhere to w = d/2 and (h + a) > 4w. Symmetry plays an important role in this geometry. The two arms should be of equal width (w). The flat punch indenter surface must be exactly parallel to the two cantilever heads to make contact with both the arms simultaneously. This ensures mode I loading. The flat punch width should ideally be larger than the total width of the two cantilevers (2d) together. K I is given by Eq. (2) (Ref. Reference Liu, Wheeler, Howie, Zeng, Michler and Clegg27) and requires knowledge of the coefficient of friction µ between the diamond tip and sample. The test is not valid if the crack kinks away from the straight path or fracture initiates elsewhere (e.g., in the cantilever arms). It is also not valid if plasticity results due to compression of the cantilevers which in turn requires that a certain condition is imposed on the total sample width depending on its K IC/σy ratio as shown by Liu et al. Reference Liu, Wheeler, Howie, Zeng, Michler and Clegg27
 $$K_{\rm{I}} = \sqrt 3 {{\left( {e - \mu h} \right)} \over {bd^{{\raise0.7ex\hbox{$3$} \!\mathord{\left/ {\vphantom {3 2}}\right.\kern-\nulldelimiterspace}\!\lower0.7ex\hbox{$2$}}} }}P_{{\rm{max}}} \quad {\rm{,}}$$
where P max is the fracture load and e = (d − w)/2. d, w, b, and h are beam dimensions as shown in Fig. 1(c).
D. Pillar splitting
Beam dimensions should adhere to an l/d ratio close to 1. Longer beams will give rise to buckling which renders the test invalid. This is the only geometry which does not require a notched sample. The indenter tip has to be positioned roughly at the center of the pillar, though minor misalignments will not affect the K IC measurement adversely. This positioning requires a viewing window from the top of the pillar, which is possible only if the indenter is titled by an angle with respect to the electron beam in an in situ test. K I is obtained using Eq. (3) (Ref. Reference Sebastiani, Johanns, Herbert, Carasitti and M Pharr28), which is independent of crack length and requires accurate knowledge of the E/H ratio and Poisson's ratio ν of the material and friction coefficient µ between the tip and the sample. The value of γ that appears in Eq. (3) is material specific and needs to be determined via FEM simulations using the cohesive zone model for each individual case and indenter geometry. As of now, these calculations are possible for a host of E/H ratios but only for isotropic, homogeneous materials indented by a Berkovich. Reference Sebastiani, Johanns, Herbert, Carasitti and M Pharr28 The energy for fracture in this geometry includes both crack initiation and propagation events, unlike other geometries which are prenotched. The effect of crack length (which is generated during indentation) and its relation to the pillar radius is not yet clear, but for a valid test, it has to be ensured that the edge cracking that initiates under the indenter tip should reach the pillar wall and split it open into three parts. If the cracking is restricted to within the pillar, this will resemble a typical indentation fracture toughness test on which Eq. (3) cannot be used.
 $$K_{\rm{c}} = {{\gamma P_{{\rm{max}}} } \over {R^{{\raise0.7ex\hbox{$3$} \!\mathord{\left/ {\vphantom {3 2}}\right.\kern-\nulldelimiterspace}\!\lower0.7ex\hbox{$2$}}} }}\quad {\rm{,}}$$
where P max is the fracture load, γ is the FEM simulated dimensionless constant for the given E/H ratio, and R is the pillar radius given by d/2, as shown in Fig. 1(d). A γ value of 0.305 was determined from FEM simulations by Sebastiani Reference Sebastiani32 for an E/H = 14.3 (Ref. Reference Li and Vlassak33) for Si(100). From the data available in Sebastiani, γ is seen to decrease with decreasing E/H ratio and is extremely sensitive to this ratio, while showing independence with respect to the aspect ratio of the pillar. A lower γ would be inference means higher fracture loads for a given fracture toughness and pillar radius of the material.
III. RESULTS AND DISCUSSION
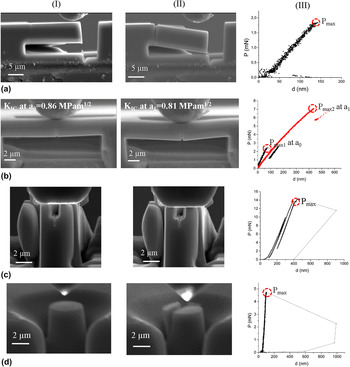
The samples before and after fracture along with the load–displacement curves are shown in Fig. 2. Si(100) is a single crystal and hence expected to show anisotropy in properties. Hence, it was ensured that the notch was held constant along (010) in all the test geometries requiring a precrack [Figs. 2(a)–2(c)]. Also, the P–d curves shown in Fig. 2-III(a,d) reinforce the fact that Si deforms in an ideally elastic–brittle fashion. Like for all microscale tests, the need to have a good load/displacement resolution as well as accurate determination of sample dimensions cannot be stressed enough. The minor differences seen in the average fracture toughness values obtained from individual geometries can be attributed to the difference in the stress state that each of them experience. The K IC results and advantages and limitations of each of the four geometries are reported and discussed below:
Snapshots of the samples (I) before and (II) after fracture and (III) the corresponding P–d curve. (a–d) refer to the four geometries used for fracture toughness testing.

A. Single cantilever bending
Single cantilever bending [Fig. 2(a)] is the most common fracture toughness test geometry that has been used at the small-scale till date. Reference Matoy, Schoenherr, Detzel, Pippan, Motz and Dehm25,Reference Di Maio and Roberts34–Reference Iqbal, Ast, Goeken and Durst38 Although the use of rectangular beams and straight cut notches has been the most commonly used, due to the straightforward analytical solutions for K I available for the same, there are instances of pentagonal or trigonal shaped beams, Reference Armstrong, Wilkinson and Roberts39,Reference Iqbal41 with bridge Reference Matoy, Schoenherr, Detzel, Pippan, Motz and Dehm25 or chevron Reference Mueller40 notches also being tested, using finite element solutions for K I. The bridge and chevron notches initiate real cracks in the system on loading and hence avoid “notch effects”. Notches can be machined both from the side and from the top, Reference Iqbal41 which gives more degrees of freedom in positioning along particular features of the microstructure. Though this geometry is not very commonly used in bulk cases, it is easy and simple to both micromachine and perform fracture experiments in such specimens. The advantage of this geometry lies in its ability to test a range of materials, boundaries, and interfaces, since such beams can be machined at any location with great ease, although restricted to the elastic–brittle regime. Though it is difficult to achieve pure mode I loading conditions due to asymmetric nature of bending of such a beam, the shear component can be minimized by increasing the l/w ratio (>4). Reference Timoshenko and Goodier31 But longer beams mean more FIB machining time and higher probability of the indenter sliding away as the beam deforms to larger displacements before failure. Also, this geometry is inherently unstable and crack growth is catastrophic in materials which do not show any R-curve. Therefore, one can only obtain the initiation fracture toughness from such tests. The fracture surface at the fixed end is clearly visible and can be used for post-examination studies due to the fracture running across the entire beam width, although the test beams cannot be retained after failure for the same reason. K I [see Eq. (1)] is very sensitive to an accurate measurement of the beam dimensions and the distance between the loading point and the precrack which is why in situ imaging becomes indispensable for this geometry.
For Si(100), a K IC of 0.76 ± 0.08 was found from this geometry.
B. Clamped beam bending
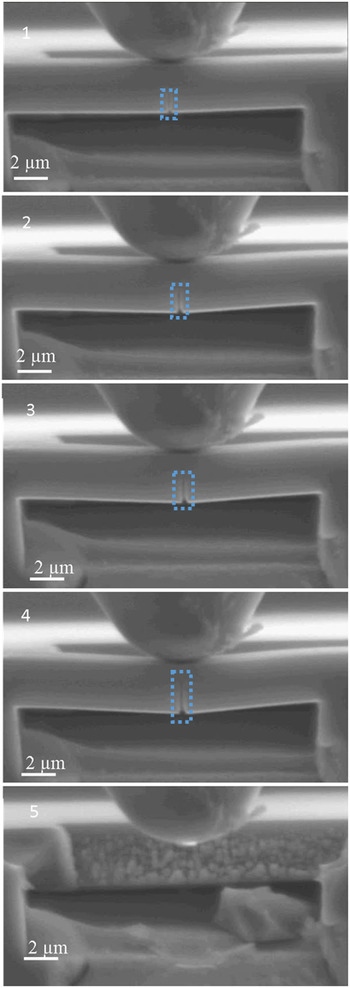
Clamped beam bending [Fig. 2(b)] was first demonstrated as a fracture test geometry recently on PtNiAl bond coats. Reference Jaya, Jayaram and Biswas26 Based on a modification over the classical three point bend test by clamping the ends instead of letting them free, this geometry offers pure mode I loading as well as controlled mixed mode loading by placing the indenter at fixed offsets from the notch position. The key advantage of this geometry over the single cantilever though is its ability to support stable crack growth, even in brittle systems with no R-curve. This can be seen more clearly from Fig. 3 where the crack is seen to grow and arrest in stages before complete failure ensues. The associated P–d curve [Fig. 2(b-III)] shows the first pop-in load at the first crack propagation event, and the next one at a higher load when the beam finally fractures completely. The reduced slope in the second loading cycle accounts for the decreased stiffness of the beam now containing a longer crack. Such controlled crack growth is important in the measurements of R-curve or fatigue behavior of materials Reference Li and Vlassak33 as well as in following crack trajectory and study of toughening mechanisms after the experiment. The good match in the slope of the unloading curve of the first loading cycle and the loading part of the second loading cycle shows that the beam undergoes pure elastic deformation before final fracture. The feature of stable crack growth also allows generation of real cracks from the FIB machined notch tip by careful loading so that the effect of a finite notch root radius, if any, can be discounted for. The almost constant value of K IC obtained at two different a/w ratios, one at the onset of the crack from the notch tip (0.89 MPa m1/2) [Fig. 2(b-I)] and the other for the extension of the crack tip [Fig. 2(b-II)] (0.81 MPa m1/2), coincides with the absence of an R-curve behavior. The two values also demonstrate that there is no undesirable effect of a notch root radius. This also reveals that FIB induced damage around the notch tip does not significantly alter the K IC measurements, since crack growth of over 500 nm clearly surpasses the expected length scale of the damage zone (which is around 10–15 nm) but the observed fracture toughness is not affected at all. Issues associated with possibility of edge cracking and plasticity at the clamped ends have already been addressed. Reference Jaya and Jayaram29 The primary drawback currently for this geometry is the lack of analytical formulation for K I since K I does not follow a monotonically linear relationship with increasing a/w ratio in this case. Reference Jaya and Jayaram29 Hence each test requires an FEM simulation to be run to extract the stress intensity factor. Also, the notch requires to be cut from the side, and hence this geometry cannot be tested in the bulk but only at the sample edge. Another disadvantage is the difficulty encountered with respect to positioning the crack plane along a particular microstructural feature, since mode I loading in this geometry requires the crack plane to be at the exact center of the beam. As a consequence, it is more challenging to test heterostructures in this geometry, especially specific interfaces, compared to single cantilever bending. Residual stresses are an issue that clamped beam structures need to account for as they are in contiguous contact with the rest of the sample. The value of residual stress must be taken into account in the FEM simulation, which in turn requires independent measurements, e.g., by x-ray diffraction, Reference Noyen and Cohen42 wafer curvature, Reference Brenner and Senderoff43 micro-Raman, Reference Ager and Drory44 static deflection of microcantilevers, Reference Fang and Wickert45 and pillar micromachining combined with nanoindentation. Reference Sebastiani, Bemporad, Carasitti and Schwarzer46 When appropriately accounted for, this can also be an advantage because this is one geometry where the effect of residual stress will be reflected in the fracture process, while in other test methods, the samples are free from such stresses and the crack is no more under the influence of it.
Various stages (1–5) of crack growth and arrest (see dotted rectangles in blue) in a Si(100) clamped beam, before complete failure ensues, showing stability of the geometry.

For Si(100), a K IC of 0.81 ± 0.1 was found from this geometry.
C. DCB
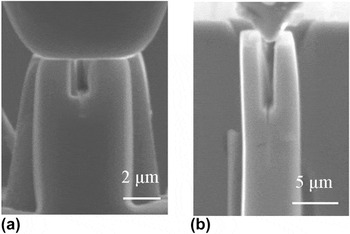
The DCB by compression using a flat punch [Fig. 2(c)] is one of the very recent geometries for fracture toughness testing, first demonstrated on CrN based hard, brittle coatings. Reference Liu, Wheeler, Howie, Zeng, Michler and Clegg27 The conventional DCB has been the geometry of choice at the macroscale for many materials and is known to be stable under displacement control. Several modifications like the tapered DCB and wedge loaded DCB have followed to improve the stability of this geometry. Reference Beres, Koul and Thamburaj47–Reference Qiao49 At the microscale, Liu et al. Reference Liu, Wheeler, Howie, Zeng, Michler and Clegg27 demonstrated that a compression loading from the top can be translated into a tensile loading on the crack plane when some critical aspect ratios with respect to beam dimensions are maintained. In the present work on Si, this geometry did not support any stable crack growth, and all the specimens fractured catastrophically after the initial crack opening. This could be possibly due to the compliant nature of the indenter testing system, which has been explained already in Sec. I. A large part of the energy during compression of the double cantilever geometry is stored in the load frame of the indenter. This stored energy is released spontaneously as the crack propagates, rendering the beam unstable and causing catastrophic failure. This is not an issue as much for single cantilever and clamped beam bending experiments because the cantilevers in those cases are much more compliant themselves. It might be possible to arrest crack growth by using tapered beams and longer cantilever arms but this was not explored in the present work. In the formulation proposed by Liu et al., Reference Liu, Wheeler, Howie, Zeng, Michler and Clegg27 this geometry completely avoids the measurement of the crack length and only requires fracture load as the input to calculate the K IC. This is the reason that a K IC measurement was possible despite the absence of any stable crack growth. In the present work, a value of 0.08 was assumed for the friction coefficient µ between the Si wafer and the diamond tip Reference Gatzen and Beck50 for the calculation of the stress intensity factor. Also, in Liu et al.’s tests on CrN coatings, Reference Liu, Wheeler, Howie, Zeng, Michler and Clegg27 plastic deformation of the supporting pillars was avoided by maintaining a fixed ratio between the cantilever arm lengths and width of the beam. These bring about more restrictions on beam dimensions compared to the single cantilever and clamped beam geometries. The main advantage of using a flat punch in compression instead of a wedge to open the two cantilevers (Fig. 4) is to avoid friction from playing a major role although contact stresses do play a role in both cases. The rubbing action produced by the wedge tip in contact with the side walls of the two cantilevers will require modeling, complicating the analysis further. Also, the wedge has to be exactly centered between the two cantilever arms to give rise to mode I loading. The positioning of the flat punch is not that critical. But unlike in a conventional pillar compression test, it is important to ensure that the flat punch surface touches the two cantilever heads simultaneously, i.e., the surface of the flat punch and the two cantilever heads need to be exactly parallel to each other. Any misalignment creates an asymmetry in the bending moment produced by the two cantilevers and hence cannot produce mode I loading. The symmetry of the crack plane with respect to the two cantilever arms is also crucial in this geometry, and minor, inadvertent beam shifts during FIB milling can pose a problem. Hence it is challenging to position the notch plane along a particular microstructural feature (e.g., interface type) in this geometry. The type of materials that can be tested using this geometry are restricted to brittle systems whose cleavage plane or columnar boundaries are oriented in the direction of the initial crack.
DCB initiated by (a) flat punch compression and (b) wedge opening.

For Si(100), a K IC of 0.89 ± 0.12 was found from this geometry.
D. Pillar splitting
Pillar splitting [Fig. 2(d)] is a novel geometry proposed by Sebastiani et al. Reference Sebastiani, Johanns, Herbert, Carasitti and M Pharr28 based on radial cracks produced by sharp indenters on brittle materials. This test geometry requires machining pillars with aspect ratios close to 1 and loading them at the center using a Berkovich/cube corner to produce radial cracks which split open the pillars into three equal parts. The geometry is simple, elegant, and easy to test. The formulation makes K I independent of crack length which is the main advantage of this geometry though it does not account for the ratio of crack length to pillar radius. The constant γ that appears in Eq. (3) needs to be calculated for a variety of materials with different E/H ratios and is presently done using an FEM formulation which assumes the material to be homogeneous, linear elastic, and isotropic. Reference Sebastiani, Johanns, Herbert, Carasitti and M Pharr28 The disadvantage is that γ is very sensitive to the materials' E/H ratio, whose value must be accurately known by other independent means. Sebastiani calculated a γ value of 0.305 (Ref. Reference Sebastiani32) assuming a Berkovich tip and isotropic elastic properties in the FEM simulations for K IC calculations, while in the present work, a cube corner was used and a single crystal with anisotropic elastic properties was tested. Despite not accounting for these differences, the value of K IC obtained by pillar splitting here is similar to the ones obtained from the other three geometries, with a difference of less than 10% compared to the average value. While the testing of homogeneous isotropic materials and transversely isotropic materials is straightforward, sufficient care needs to be taken in testing highly anisotropic materials, since crack propagation is not expected to be symmetric and to the same depth in all three directions. The crack lengths in all three directions in the present work were seen to be nearly equal, which would mean that Si is less sensitive to variations in the cracking direction as long as the indentation plane is kept constant. Ebrahimi and Kalwani showed that the measurements of indentation fracture toughness gave a constant value for a given plane, within the error bars of the measurement. Reference Ebrahimi and Kalwani7 Being very close to an indentation test method and the associated complex tri-axial stress field underneath, it is difficult to maintain mode I conditions while testing heterogeneous materials. Also, this test is valid for materials which are brittle enough to produce radial cracks, and not undergo substantial plastic deformation or phase transformations during indentation. Phase transformation in Si is usually only observed during unloading as a pop-out, during nanoindentation with a pyramidal tip. In the pillar splitting test, the pillar cracks catastrophically to such a large extent that not sufficient data points are recorded in the unloading curve due to the uncontrolled movement of the low-stiffness indenter. In any case, Pharr Reference Pharr51 demonstrated that below threshold loads of 5–20 mN for a Berkovich, no phase transformations could be detected in the nanoindentation unloading curves in the form of pop-outs. The fracture loads, in the present work, were lower than this threshold value. But care should be exercised when pop-in or pop-out signatures occur in the P–d curve without accompanying cracking.
For Si(100), a K IC of 0.75 ± 0.16 was found from this geometry.
E. Comparison of the four test geometries and further guidelines for microscale fracture toughness testing
The fracture toughness of Si(100) as obtained from the four different test configurations is given in Table I. These results are reported from five valid tests in each geometry. It is clear from Table I that the K IC obtained with less than 15% variation between different test methods is independent of the test geometry. The standard deviation within a given test method is less than 16%, indicating a good reproducibility of the material's fracture toughness for each geometry. Although FIB has become the most commonly used tool to machine samples in the small-scale mechanics community, there arise issues regarding the extent of ion implantation and damage that FIB causes in the material and whether that can alter the overall deformation and fracture mechanism. But as shown in the present work, the K IC of 0.75–0.89 MPa m1/2 obtained from the FIB micromachined specimen is the same as the broadly accepted value of K IC for single crystalline Si(100). Reference Ritchie11 This should be sufficient evidence that there is no effect of redeposition and Ga+ ion implantation damage, at least for microscale Si samples. This value is also proof that a notch root radius kept below 200 nm behaves like a real crack and does not lead to overestimation of fracture loads. In fact, this has already been shown by Wurster et al. Reference Wurster, Motz and Pippan37 and Iqbal et al. Reference Iqbal, Ast, Goeken and Durst38
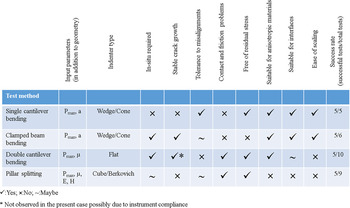
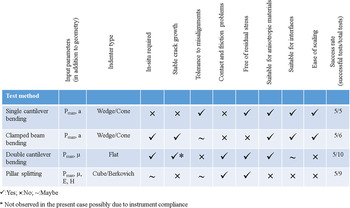
Table II summarizes the above four fracture toughness test geometries listing the advantages and limitations of each, to serve as a guideline for future users. Besides specific geometry issues highlighted in this table, there are other generic issues that crop up during small scale testing dealing with fracture. The almost constant value of K IC found for Si(100) from the four completely different geometries in the present work (Table I) suggests that the other reported values of K IC in the literature both at the bulk and small-scale require a re-look. Fracture toughness determination requires both exactness in estimation and minimization of error in terms of scatter in the data. Keeping up with standard geometries becomes nearly impossible at the small-scale, especially in testing thin wafers like that of Si. The reasons for under or overestimation of K IC are a consequence of the nonstandard geometry of the tests and the accompanying method of precracking or notching the specimens. As has already been stressed, the first and foremost condition in the application of fracture mechanics in the linear elastic regime is to maintain sample dimensions which are much larger than the plastic zone size of the sample. The other requirement of a valid K IC test is that of maintaining plane strain conditions in test geometries that have a starter notch. In the present work, both the conditions are satisfied. There is sufficient evidence that Si can exhibit room temperature brittle to ductile transition and plasticity when the sample dimensions are scaled down to the nanoregime (below ∼500 nm) due to either pressure induced phase transitions or dislocation activated amorphization. Reference Gerberich, Stauffer, Beaber and Tymiak52–Reference Oestlund, Malyska, Leifer, Hale, Tang, Ballarini, Gerberich and Michler54 For less brittle systems, one has to be more careful because the critical sample dimensions required to avoid plasticity will be higher. Mode I conditions need to be strictly adhered to in K IC measurements and this is only possible in the given geometries if the material is isotropic, homogeneous, or in case of heterogeneous, anisotropic materials, if the notch is positioned along the microstructural plane with the lowest fracture toughness, as within this study. Any kinking or branching of the crack will bring about mixed mode fracture and render the test invalid. In such cases, analytical formulations cannot be used anymore and FEM simulations are required to determine the K I and K II components. In bulk testing, microscopic kinks are accommodated as long as the crack travels in a straight path macroscopically. In small-scale testing, this is not straightforward since the intrinsic microstructure being probed is of a similar magnitude as the sample size. Hence, most measurements report a K C instead of a K IC.
General guidelines for choosing a fracture toughness test geometry at the micrometer scale.
An additional source of error comes due to the precracking procedures used. Reference Gludovatz, Wuster, Hoffmann and Pippan55,Reference Tsuchiya, Sakata and Taga56 Notching by DRIE can induce chemical effects. Indentation and scratch with sharp indenters and AFM tips can cause residual stresses and leave behind remnant impressions while ion slicing and FIB milling can induce Ga+ ion damage. All of these techniques of creating a precrack can affect the K IC of the material. In one of the first reported results on fracture in Si, Chen and Leipold Reference Chen and Leipold6 used a Knoop indenter to produce indentation cracks on single crystal Si with varying c/a ratios. They found a K IC of 1 MPa m1/2 on an average but also created a flaw length dependence of K IC. Though this was an attempt to use real cracks instead of notches in fracture toughness testing, it brings in issues of deformation and residual stresses beneath the indenter. Additionally, the variance in the shape and uniformity of the elliptical crack arising due to anisotropy in Si was not described in their results. Neither were any load–displacement curves shown for comparison. Using notches in place of precracks for fracture toughness studies has always been questioned due to the finite notch root radius that causes overloading of the specimen. Reference Jaya and Alam14 Work by Myers and Hillberry Reference Myers and Hillberry57 on the effect of notch root radius on fracture toughness values of single crystalline Si using four point bend geometry shows that overestimation by more than ∼30% occurs in cases where the notch radii are 80 µm and more. Notch toughness values of poly-Si reported in the literature vary between 1.4 and 4.5 MPa m1/2 depending on the notch root radii, which varied from 0.23 to 1 µm. Reference Sharpe, Yuan and Edwards58 In contrast, FIB machined notches (at lowest currents) have a notch root radius below ∼50 nm and are sufficiently small to behave like ideal cracks as seen from previous studies. Reference Wurster, Motz and Pippan37,Reference Iqbal, Ast, Goeken and Durst38 In the context of using FIB to machine notches at 30 keV and currents of ≤10 pA, the Ga+ ion implantation depth and resulting amorphous thin film formation are not expected to be more than 30 nm in a hard material like Si. Reference Rubanov and Munroe59 It is clear that the FIB damage does not affect the measured fracture toughness value since the clamped beam specimen gives the same fracture toughness value (within error bars) at the notch tip and the crack tip [Fig. 2(b)] as also the pillar splitting tests with no prenotch. With the specimen here being 2 orders of magnitude larger in dimension than the damage zone, and the plastic zone size of 200 nm itself being an order of magnitude larger than the expected point defect cluster size (≤10 nm), ion damage is not expected to alter the brittle fracture behavior of Si. Therefore, it can be conclusively stated that notching with a FIB at the lowest currents possible creates a notch in Si whose tip behaves very close to that of an ideal crack, thus enabling measurement of the true K IC.
Another important aspect of fracture toughness testing which is often ignored is the role of statistics. For example, Kahn et al. Reference Kahn, Tayebi, Ballarini, Mullen and Heuer60 carried out K IC measurements using sharp cracks produced by indentation on poly-Si MEMS chips (which also acted as the fracture device). Although their median K IC value is very close to earlier reported values (1.1 MPa m1/2), they report a wide scatter in their data ranging from 0.2 to 2.2 MPa m1/2, with a low Weibull modulus. The explanation they offered is that indentation cracks differ substantially in length and orientation due to stochastic effects. Chasiotis et al. Reference Chasiotis, Cho and Jonnalagadda61 carried out similar tests on poly-Si using indentation induced cracks and obtained a value of 1 MPa m1/2, and surprisingly a much lower scatter of 0.1 MPa m1/2. Unlike polycrystalline Si, single crystal Si wafers are homogeneous and of high purity and are expected to show a low scatter in the K IC data. In the present work, each test geometry showed different success rates but in general, geometries 1 and 2 showed more than 80% success. Geometries 3 and 4 showed less than 55% success. The low success rate of geometry 4 was due to the rapid catastrophic fracture and destruction of the pillar that occurred during loading. Geometry 3 had additional issues like the sample fracturing across the cantilever arms. Individual differences will also arise depending on the familiarity of the investigator with respect to a given geometry. Table II shows the number of samples that were found acceptable among the total number of samples tested. It was ensured that five valid tests were used from each geometry type for reporting the K IC results in Table I. Even with the small sampling size, the scatter is quite low, making the value of K IC obtained, acceptable. This is counter-intuitive since a smaller sampling size usually leads to a larger scatter. However, the present study shows that an optimum number of careful experiments accounting for actual sample dimensions and controlled crack lengths can yield correct results.
IV. CONCLUSION
Numerous small-scale test configurations have been recently developed for miniaturized fracture toughness measurements including the single cantilever bending, clamped beam bending, double clamped beam bending, and pillar splitting methods. When making a choice for a particular test geometry, one must give careful consideration about getting the true K IC of the material along with the ease, convenience, and suitability of the test for the given sample or device. The above described four geometries have been proven to be valid fracture toughness test geometries, giving an average fracture toughness of 0.80 MPa m1/2 for Si(100). This shows that any differences that are observed by future users on testing other materials may only be due to the inability of some of these test methods to capture the multiple microstructural complexities in them. Each one has limitations in terms of alignment, friction effects, and versatility in testing different types of materials which has been discussed in detail. Independence from test geometry is important in the determination of the real material property at any given length scale, particularly in the context of fracture toughness.
ACKNOWLEDGMENTS
The authors would like to gratefully acknowledge Dr Marco Sebastiani, Roma Tre, Italy for providing the γ value for calculation of K I in the pillar splitting experiment.