What would Israel’s economy have looked like without the 2000 Palestinian Intifada, also known as the Second Intifada, which persisted from 2000 to 2005? In this article, by examining this counterfactual question, we aim to make contributions to the public debate about the cost of the Israeli-Palestinian conflict to the Israeli economy, as well as to the broader academic literature on how to estimate the economic cost of conflict.
With regard to the debate in Israel, some observers and analysts of Israel tend to look at the country’s long-term growth trajectory and conclude that its economy grows unencumbered by its conflict with the Palestinians (Bard Reference Bard2011; Troy Reference Troy2013). Senor and Singer most forcefully advance this proposition in their influential book, Start-up Nation: The Story of Israel’s Economic Miracle (2009). They argue that Israel’s war economy spurs innovation and entrepreneurship, particularly in high-tech industries, which they claim have been the main drivers of Israel’s economic growth. Others, however, contend that proponents of the above view fail to consider the possibility that Israel’s economy could have grown even faster in the absence of the Israeli-Palestinian conflict. Stanley Fischer, the former governor of the Bank of Israel, argues that Israel suffers 4–6 percent less growth per year as a result of the conflict (Shavit Reference Shavit2007). Avishai (Reference Avishai2006, 2008, 2013) consistently supports this alternative view, pointing to the danger that continued conflict poses to Israel’s economy.
To provide an empirical foundation for this debate, it would be ideal to ask what Israel’s economy would have looked like in the complete absence of conflict. This is, however, a very difficult question to answer. Since Israel has been in conflict with its neighbors since its very founding, we have no data on its economic performance in a situation without any conflict. As an alternative, in this article, we focus on an instance of heightened conflict, the Second Intifada (2000–05), and estimate its effect on Israel’s economic performance. Even this, however, is a difficult empirical task because there is no country that is sufficiently similar to Israel but did not undergo a period of heightened conflict from 2000 to 2005.
More generally, it has been a fundamental methodological challenge for researchers to estimate the causal effect of a particular event or intervention, such as the passage of a law, the introduction of a new policy or the onset of conflict. When the unit of analysis to estimate the effect of an event or intervention—a “treatment,” in the terminology of experimental research—is an aggregated entity (that is, a region or country), it is usually difficult to find a single untreated comparison unit that is free of the event or intervention but is still sufficiently similar to the treated unit.
To address this methodological problem, Abadie and Gardeazabal (Reference Abadie and Gardeazabal2003) and Abadie, Diamond and Reference Abadie, Diamond and HainmuellerHainmueller (Reference Abadie, Diamond and Hainmueller2010, 2014) promote the applications of their recently developed statistical method, called the “synthetic control method.” They propose using data from multiple comparison units to construct a single, synthetic comparison unit that resembles the unit of interest before it experienced the event or intervention that is the object of study. We use their method to estimate the impact of the 2000 Palestinian Intifada on Israel’s economic growth.Footnote 1
In the following section, we first introduce the synthetic control method and review the existing literature pertaining to the Second Intifada’s impact on Israel’s economy. After establishing the context of our research, we specify our data and variables and undertake empirical tests. The results suggest that the per capita gross domestic product (GDP) of Israel during the Second Intifada was reduced by an average of about 2,003 US dollars (USD) per year (in 2005 USD). This amounts to about 8.6 percent of the 2000 baseline level. We conclude by discussing the significance of our research to the academic literature surrounding the economic cost of conflict and the Israeli public.
The Economic Cost Of Conflict
Over the past two decades, many economists and political scientists have attempted to quantify the economic impacts of conflicts on economies around the world,Footnote 2 but they typically have some important methodological problems. The synthetic control method, as detailed below, overcomes these challenges. In this section, we introduce this method and review the existing studies that estimate the cost of the Israeli-Palestinian conflict to Israel’s economy.
The Synthetic Control Method
Broadly speaking, there are two options for estimating the cost of conflict. The first is to pool many cases of conflicts and non-conflicts, and statistically estimate the average effect of conflict (vis-à-vis non-conflict, using various indicators) on outcome variables (for example, Collier Reference Collier1999; Blomberg, Hess and Orphanides Reference Blomberg, Hess and Orphanides2004; Murdoch and Sandler Reference Murdoch and Sandler2004; Nitsch and Schumacher Reference Nitsch and Schumacher2004; Gaibulloev and Sandler Reference Gaibulloev and Sandler2011; Meierrieks and Gries Reference Meierrieks and Gries2013). Despite its popularity in the literature, this approach—which typically uses cross-national and time-series data—has an important shortcoming: it disregards the fact that every conflict is substantially different. It would be difficult to interpret what the estimated “average” effect actually means when all conflicts are inherently context specific and heterogeneous.
An alternative approach is to focus on individual cases of conflicts (for example, Cranna and Binda Reference Cranna and Binda1995; Lopez and Wodon Reference Lopez and Wodon2005; Futehally and Waslekar Reference Futehally and Waslekar2009). An in-depth examination of a specific case provides rich information about the process in which conflict affects policy making and economic behavior. But if the goal is to estimate the causal effect of a specific event, we need to compare the outcome variable of the “treated” case with that of a comparable “untreated” case, in which the pre-treatment conditions are similar to the treated case. In practice, however, finding such a comparable case is difficult, if not impossible. Many case-oriented studies on the impact of conflict do not even use a comparison unit.
Instead of examining a pair of cases (that is, a case with conflict and a case without it), one may suggest using cross-space (for example, cross-national), time-series data with a treated case and multiple untreated cases and applying a difference-in-differences (or a comparative interrupted time-series) research design. This regression-based, parametric approach, however, weights all untreated cases in the dataset equally when creating the comparison unit for the treated case.Footnote 3 For example, in the case of the Israeli-Palestinian conflict, if we use Organisation for Economic Co-Operation and Development (OECD) countries as the cases without a major escalation of conflict in 2000, we implicitly assume that all OECD countries are equally important for creating the counterfactual of Israel had the Second Intifada not occurred. While Israeli newspapers often compare Israel’s economy to the OECD average (for example, Bassok Reference Bassok2011), this comparison is questionable because Israel’s economy is more similar to smaller OECD economies than larger ones.
To address these methodological limitations, Abadie and Gardeazabal (Reference Abadie and Gardeazabal2003) and Abadie, Diamond and Reference Abadie, Diamond and HainmuellerHainmueller (Reference Abadie, Diamond and Hainmueller2010, 2014) suggest making a counterfactual “synthetic control” case. Specifically, based on constrained optimization, they suggest generating the weighted average of an outcome variable for a “donor pool,” a set of similar units in which an event or intervention of interest did not occur.Footnote 4 If we can successfully make such a synthetic control case, which serves as a counterfactual for the specific unit of interest, an outcome variable’s trends should be similar between the treated case and the synthetic control case before an event or intervention of interest occurs. If the event or intervention does indeed have a causal effect on the outcome variable, the trends should then diverge after that.
Abadie, Diamond and Reference Abadie, Diamond and HainmuellerHainmueller (Reference Abadie, Diamond and Hainmueller2010, 2014) demonstrate the validity of this approach by examining the impact of a large-scale tobacco control program that California implemented in 1988 on annual per capita cigarette sales in California, as well as the impact of German reunification in 1990 on West Germany’s economic growth. In recent years, the number of studies applying this method has grown rapidly, particularly in the field of economics. Our article builds on this literature, particularly on the studies of Abadie and Gardeazabal (Reference Abadie and Gardeazabal2003) and Montalvo (Reference Montalvo2011) in quantifying the economic cost of conflict. Abadie and Gardeazabal (Reference Abadie and Gardeazabal2003) use a terrorism outbreak in the late 1960s to measure the economic cost of conflict in the Basque Country in northern Spain. They create the synthetic Basque Country by drawing from other regions in Spain. Montalvo (Reference Montalvo2011) takes the same approach to study the electoral impact of the March 2004 terrorist attacks in Madrid. Our study applies this technique to the case of the Second Intifada and Israel’s economy.
The Case of Israel and the 2000 Palestinian Intifada
The Second Intifada broke out in the fall of 2000 and was the second major Palestinian uprising against Israel’s occupation of Palestinian territory. The immediate trigger appeared to be Israeli leader Ariel Sharon’s visit to the Temple Mount in the Old City of Jerusalem, one of the holiest sites in Judaism and Islam. His visit came on the heels of a July 2000 summit at Camp David, at which US President Bill Clinton failed to facilitate a peace agreement between Israeli Prime Minister Ehud Barak and Palestinian National Authority Chairman Yasser Arafat. The breakdown of negotiations at the summit capped off the peace process of the 1990 s, which included the failed implementation of the Oslo Accords that set out a framework for creating an independent Palestinian state. The Palestinian uprising grew largely out of frustration with the lack of progress toward the realization of that goal.
The Second Intifada was far more violent than the previous uprising (1987–93) and involved Palestinian terrorist attacks in Israel and Israeli military crackdowns of Palestinian demonstrations. The violence largely subsided after the Sharm el-Sheikh Summit in February 2005, when Israeli Prime Minister Ariel Sharon and Palestinian National Authority President Mahmoud Abbas agreed to stop all acts of violence and reaffirmed their commitment to peace.
There are several previous studies on the economic cost of the Israeli-Palestinian conflict to Israel. The Adva Center, a think tank in Tel Aviv, published a report (Swirski Reference Swirski2012) that discussed the specific economic consequences of Israel’s occupation of Palestinian territory (for example, increased defense spending and government incentives to West Bank settlers), but the report makes no statistical estimate of the counterfactual, opportunity cost of conflict. Some researchers use more rigorous statistical methods to calculate the impact of terrorism and conflict on Israel’s economy (Fielding Reference Fielding2003; Eckstein and Tsiddon Reference Eckstein and Tsiddon2004; Morag Reference Morag2006). Their studies, however, have the methodological problems discussed earlier. Consequently, it is difficult to interpret the causal effect of conflict on the Israeli economy, which fundamentally requires a valid counterfactual.
A notable exception is Persitz’s (Reference Persitz2006) working paper, which builds on the recent literature on causal inference and undertakes counterfactual analysis. Specifically, as in our study, he constructs a synthetic Israel that did not undergo a Second Intifada. He finds that the average Israeli citizen’s income was 12.2 percent lower in the first three years of the Second Intifada. Due to data unavailability at the time of writing his paper, however, Persitz only extends his research to 2003. Yet the full impact of the Second Intifada can only be captured by analyzing Israel’s economy through 2005, the end of the uprising. More importantly, he does not undertake the rigorous placebo studies and the sensitivity check proposed by Abadie, Diamond and Reference Abadie, Diamond and HainmuellerHainmueller (Reference Abadie, Diamond and Hainmueller2010, 2014). We improve Persitz’s analysis by using a longer period of investigation and undertaking proper methodological tests.Footnote 5
Israel Versus Synthetic Israel
We now turn to statistical analysis of the impact of the Second Intifada on Israel’s economy. In this section, we first introduce the data and variables we use.Footnote 6 We then show the results of our analysis, which suggest that the economic cost of conflict for Israel was substantial.
Data and Variables
To calculate the economic cost of conflict, we use per capita GDP in 2005 USD in purchasing power parity, which is the most widely used variable that summarizes the overall economic performance of a country. We prefer to use this variable, which measures the level of economic development, rather than one that measures the speed of economic growth, because it is relatively easier to construct a synthetic control when using such a slow-moving variable as compared to fluctuating variables.Footnote 7
The period of investigation is 1980 to 2005, which is divided into pre-treatment (1980 to 1999) and post-treatment periods (2000 to 2005) including the year of the onset of the Second Intifada. We follow Abadie, Diamond and Reference Abadie, Diamond and HainmuellerHainmueller’s (Reference Abadie, Diamond and Hainmueller2010) suggestion to incorporate a sufficiently long pre-treatment period in order to improve the accuracy of the estimation.Footnote 8 We do not extend the post-treatment period beyond 2005, because then the treatment effect would capture the effects of the conflict itself and post-conflict factors.Footnote 9
To make the appropriate synthetic Israel, we need to choose predictors that are important for describing Israel’s economic profile and for predicting its post-treatment growth trajectory. Our set of predictors is similar to that of Abadie, Diamond and Reference Abadie, Diamond and HainmuellerHainmueller (2014), who also use per capita GDP as the outcome variable.Footnote 10 First, since Israel has a trade-dependent open economy, we use exports as a percentage of GDP, imports as a percentage of GDP and a measure of openness to trade. Second, we use consumption and investment shares of GDP, which help describe Israel’s economy. Third, we use average schooling years (for both men and women). The level of education is an important source of economic growth, particularly for countries with limited natural resources, such as Israel. Finally, we use a lagged outcome variable: the average value of per capita GDP during the pre-treatment period. All of these variables are essential in describing each country’s level of economic development and growth trajectory during the pre-treatment period. There may exist some other relevant predictors not included in our model, but the predictors we include are sufficient to capture, to a large extent, unobserved heterogeneity in the determinants of GDP per capita and their trajectories during the pre-treatment period.Footnote 11
A remaining question is which countries we should include in a “donor pool” to construct the synthetic Israel. One could simply add as many countries as possible, but this approach may give unreasonably large weights to some countries that happen to be similar in some respects to Israel (measured by predictors) during the pre-treatment period but do not share many economic characteristics with Israel. To make sensible comparisons, we limit our donor pool to 21 OECD countries.Footnote 12 We exclude some OECD countries that are clearly dissimilar to Israel. Specifically, we drop a country if its per capita GDP (in 2005 USD, in purchasing power parity) during the pre-treatment period was 50 percent larger or 50 percent smaller than that of Israel.Footnote 13
Results
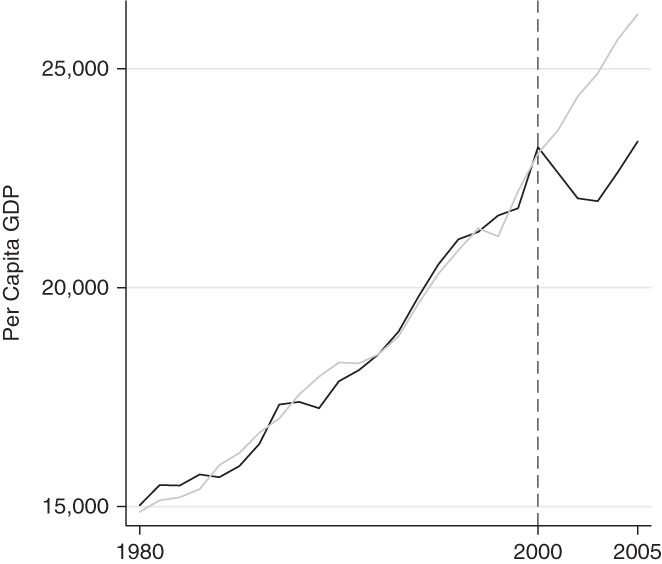
Figure 1 shows the trajectories of per capita GDP for Israel (the black line) and the synthetic Israel (the gray line), which is generated via the synthetic control method.Footnote 14 As expected, per capita GDP was similar between the factual and counterfactual cases up until 2000. Importantly, it started to diverge after 2000, with the synthetic Israel’s economy growing much faster than Israel’s economy.
Comparing Israel and synthetic Israel Note: The dark and gray lines show the growth trajectories of Israel and the synthetic Israel, respectively.

More specifically, in 2000, the per capita GDP was almost exactly the same at about USD 23,000 (in 2005 purchasing power parity) for both Israel and the synthetic Israel. From 2001 to 2003, however, Israel experienced negative economic growth, which we contend is due to the Second Intifada. Israel’s per capita GDP remained almost unchanged from 2000 to 2005, increasing slightly from USD 23,213 to 23,340. By contrast, per capita GDP for the synthetic control continued to increase during this period, starting at USD 23,067 in 2000 and reaching USD 26,245 by 2005. On average, Israel’s per capita GDP during the Second Intifada was reduced by about USD 2,003 per year. This is equivalent to about 8.6 percent of the 2000 baseline level, which is a substantial reduction.Footnote 15
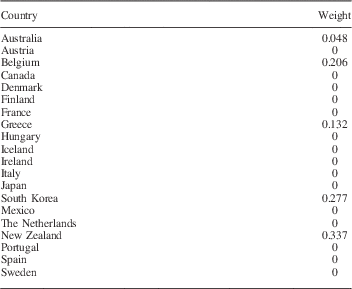
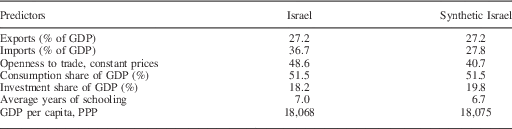
Table 1 shows the list of countries used to make the synthetic Israel, with the weights in parentheses: New Zealand (0.337), South Korea (0.277), Belgium (0.206), Greece (0.132) and Australia (0.048). This composition is reasonably consistent with the goal of creating a synthetic Israel that looks similar to Israel, as the countries receiving the largest weights are small economies. Table 2 shows that the average values of lagged outcome variables are indeed almost identical for Israel and the synthetic Israel during the pre-treatment period. All the other predictors are also similar between Israel and the synthetic Israel. These results also point to the validity of our synthetic control as a comparison unit for Israel.
Weights for Synthetic Israel

Note: The weights are assigned using the synthetic control method.
The Means of Predictors During the Pre-Treatment Period

Note: All values are averages for the pre-treatment period of 1980–99. See Table 1 for the weight used to measure the weighted averages for the synthetic Israel. The data were taken from Teorell et al. Reference Teorell, Charron, Dahlberg, Holmberg, Rothstein, Sundin and Svensson2013.
To guarantee that the synthetic control is untreated, we have to ensure that there were no significant spillover effects of the Second Intifada on the countries that constitute the synthetic control; namely, New Zealand, South Korea, Belgium, Greece, and Australia. None of these countries are neighbors with Israel. Furthermore, Israel was not a significant trading partner to any of these five countries.Footnote 16 Thus any spillover effect of the Second Intifada, if it existed, would not be substantial.
Given the results of our statistical analysis, we are inclined to believe that the 2000 Palestinian Intifada had negative effects on Israel’s economy and held back its growth. Strictly speaking, however, our analysis only shows that something that happened in 2000 had such negative effects. Alternatively, some may argue that the collapse of the “dot-com bubble”—a speculative bubble that drove the rapid growth in the economies of industrialized nations from 1997 to 2000—also contributed to the divergence in the per capita GDP of Israel and the synthetic Israel. However, regardless of the dot-com bubble’s effect on Israel’s economy, it should not complicate our causal inference. The dot-com bubble affected not only Israel but also the OECD countries that are used to make the synthetic control. Therefore, the effects of its collapse are already incorporated into the synthetic Israel. In sum, we interpret that the gap between the post-2000 growth trajectory of Israel and its synthetic counterpart is due to heightened conflict associated with the Second Intifada.
Conclusion
Building on the existing literature on measuring the economic cost of conflict and the statistical methods for causal inference, this article quantifies the damage that the Second Intifada inflicted on Israel’s economy. As described in the previous section, we found that the trajectories of the economies of the real and synthetic Israel were almost identical up to 2000 but diverged afterwards. As a result, Israel’s economy lagged behind that of the synthetic Israel during the post-treatment period.
Our statistical analysis complicates the view that the Israeli economy benefits from continued conflict. If Israel were at peace with the Palestinians, it could shift defense spending toward more productive endeavors, such as infrastructure spending and investments in education. Israel could have a smaller standing army, which would allow the labor force to expand. The stability of peace would cause a tourism boom in Israel. Perhaps most of all, peace would boost investment by removing the uncertainty caused by conflict and terrorism.
We hope this research contributes to the literature on the economic impact of conflict. Specifically, following some relevant previous studies (Abadie and Gardeazabal Reference Abadie and Gardeazabal2003; Persitz Reference Persitz2006; Montalvo Reference Montalvo2011), we demonstrated the validity of applying the synthetic control method to estimate the opportunity cost of conflict. We created a reasonable proxy for the counterfactual of Israel’s economy without the Second Intifada and compared the factual and counterfactual trends. This method should be applied to other cases of conflicts to further improve our understanding of the consequences of war and peace.
We also hope that this research will help academics, analysts and the public appreciate the economic benefits of Israeli-Palestinian peace. This article quantifies the economic impacts of the Second Intifada to show that Israel’s economy suffers greatly at the hands of the Israeli-Palestinian conflict. As such, Israel would benefit from a final-status agreement that sets its economy back on track for faster growth. In short, our research suggests that peace pays.