Direct democratic systems face a problem not found in pure representative democracies: what should the outcome be when voters simultaneously approve two or more contradictory measures? In many systems, the measure with most votes wins out. This rule offers any ballot proposal’s opponents a powerful tactic: to qualify a ‘counter-proposal’ on the same subject and draw support away from the original proposal, or split the electorate so that both proposals fail. For example, California’s famous Proposition 13, which kick-started the latest wave of initiative usage in 1978, faced the more moderate Proposition 8, sponsored by the state legislature; in 1988, Proposition 103 on auto insurance reform faced four different competitors; and Proposition 79, to provide prescription drugs for poorer Californians, competed with the industry-sponsored Proposition 78 in November 2005. These are some of the highest-profile and most expensive initiative campaigns in recent years. Counter-proposals are an important part of California’s direct democratic landscape, adding to an arsenal of tools that opponents of a direct democratic measure can use to prevent its being passed and implemented.Footnote 1
When a pair of competing proposals is on the ballot, the voter faces a difficult choice. Even if she knows the content of each proposal, she must decide whether to vote for one, none or both. Suppose that the voter prefers both proposals to the status quo, but most prefers the original proposal. On the one hand, voting for only the original proposal may help it to beat the counter-proposal, but there is the risk that both proposals may fail. On the other hand, voting for both proposals increases the chance that the counter-proposal will pass, but also increases the chance that it will beat the original proposal. The optimal way to vote depends on the probabilities of being pivotal between the original proposal and the status quo, between the counter-proposal and the status quo, and between the two proposals. So, it depends on how others plan to vote.
The voting behaviour literature raises the question of whether voters will be able to achieve this level of sophistication. First of all, how will rationally ignorant voters find out the content of proposals? If they achieve this, how will they co-ordinate with other voters to make an optimal choice? To these challenges to voter competence, optimists may reply that cues and heuristics will help voters make the right decision without having to think too hard.Footnote 2 If this account is correct, competing direct democratic proposals create a particularly demanding choice situation for voters. Direct democratic votes are often not very salient, so voters may pay them little attention and rely more than usual on heuristic rather than systematic information processing. Strategic voting on competing proposals may require voters to vote yes on both of two apparently opposed measures, which arguably requires more political knowledge and sophistication than the relatively simple task of voting for one’s most preferred of the top two candidates in a multi-candidate election. The key heuristic of party identification is often unavailable in ballot initiative votes, because they may be proposed by any individual or group.Footnote 3 Worse, even if the ideology of the proposer is known to voters, in the case of competing proposals this cannot be mapped to the content of the proposal. A simple example will show why. First, consider a voter with ideal point V facing a status quo SQ and an original proposal P1, proposed by an interest group whose ideal point G is known to him. In this situation, the voter can at least infer on which side of the status quo the proposal lies. G will never propose P1 on the opposite side to SQ from G: this could only make the group worse off. See Figure 1.
Simple vote choice

Now consider a pair of competing proposals, shown in Figure 2. Suppose that the voter already knows the location of P1. A conservative group C, on the opposite side of the status quo from the voter and the proposal, puts a counter-proposal on the ballot. It would like to propose and pass its own ideal point, but this may not be feasible. Instead, it may have to propose a compromise P2, which is worse for it than the status quo, but better than P1. Now the link between the conservative group’s ideal point C, and its proposal location P2, is broken: they may be on opposite sides of the status quo.
Complex vote choice

For all these reasons, competing direct democratic proposals offer a hard test for theories of strategic voting. This article has two components. In the theoretical component, I show the serious consequences if voters fail that test. For, even under the optimistic ‘complete information’ assumption that voters have precise knowledge of the content of proposals, if voters are naïve, counter-proposals can be used to block all possibility of policy change via the direct democratic route. However, if voting is strategic, counter-proposals can actually make the agenda-setting process more competitive, and thus benefit direct democracy by bringing outcomes closer to the median voter.Footnote 4
My empirical tests then examine four sets of competing proposals in California. Using data from opinion polls close to the election, I find evidence for strategic voting in some elections. I hypothesize that voters’ strategies are indeed influenced by cues from elites: when campaigns are highly polarized, strategic voting is less likely. Nevertheless, if enough voters can achieve sophisticated voting behaviour, the direct democratic process will not be blocked by counter-proposals.
The article is organized as follows. The next section describes counter-proposals in more detail, and briefly reviews the literature on counter-initiatives and voter sophistication. I then develop a spatial model of counter-proposals, which treats interest groups as rational but allows various assumptions about voter behaviour.Footnote 5 I find that if ‘naïve’ voters support only their most preferred option, a counter-proposal can split the voters and ensure that both proposals fail. But if voters are rational, the threat of the counter-proposal brings outcomes closer to the median voter. The empirical sections test these competing predictions using polling data from California. The results show that at least some voters are sophisticated. However, the level of sophisticated behaviour varies between elections. The section ‘Heuristics for Sophistication’ examines what drives this variation. Finally, I draw practical and theoretical conclusions for direct democratic institutions and for the study of voter competence.
Counter-Proposals In The Literature
As stated above, in a direct democracy voters may vote simultaneously for measures with conflicting provisions. There are different ways to resolve or prevent this. In Switzerland, when a popular initiative faces a counter-proposition from the legislature, votes are taken on both and, if both pass, only the one with most votes is implemented. Until 1987, voters could only vote ‘Yes’ on one out of the two proposals: support would often be split so that both failed. Since 1987, voters have been able to vote ‘Yes’ on both propositions and to choose one as their first preference if both pass. In the United States, Washington State allows the legislature to offer an alternative to an initiative. Voters choose first whether they would prefer either of the two to the status quo, and then choose one of the two measures; if a majority votes for change, then the most popular proposal passes.
Thirteen US states explicitly use the system explored in this article.Footnote 6 Their constitutions lay down that if the provisions of two simultaneously passed ballot proposals conflict, those of the proposal with more votes will take effect. This rule does not completely specify the system. The courts or Constitution must also rule on what counts as conflicting provisions. Narrow or broad interpretations of conflict are possible. For example, in 1990 the California Supreme Court ruled that when proposals lay out different ‘comprehensive’ schemes of regulation on the same topic, the proposals conflict and, therefore, the proposal with fewer votes could be invalidated as a whole.Footnote 7 Previously, only the specific provisions that directly contradicted one another were counted as conflicting. This made the counter-proposal tactic less useful, as a counter-proposal would have to be drawn up specifically so as to contradict each provision of the original proposal. However, both before and after the 1990 ruling, some ballot proposals included provisions that explicitly invalidated other measures on the same issue if those measures passed with fewer votes.
There is a small list of literature specifically on counter-proposals. Dubin, Kiewiet and Noussair develop a choice model for counter-proposals: rather than a full Nash equilibrium, they model a ‘first-order strategy’ for groups of voters who assume that other groups will vote sincerely.Footnote 8 They find evidence for strategic voting by showing that aggregate support for a more moderate proposition sometimes decreases as support for change increases, because extremists prefer to avoid a compromise. Gilbert and Levine examine counter-proposals if voters vote sincerely for all proposals they prefer to the status quo.Footnote 9 Banducci provides the most comprehensive examination to date.Footnote 10 As well as examining the effect of competing proposals on voter information, she examines voter choice over counter-proposals, and sees voting yes on both proposals as normally irrational. However, I show below that rational voters may vote ‘Yes on both’ in equilibrium. Banducci provides important evidence about voter behaviour in the presence of counter-proposals. Reversals of majority opinion during the campaign are more likely for competing sets of proposals than for initiatives which face no counter-proposal; initiatives which face a counter-proposal are more expensive and more likely to fail. The influence of ideology on voting is strong for original initiatives but weaker for counter-proposals, a finding supported by Bowler and Donovan in their examination of California’s competing propositions 131 and 140.Footnote 11 Banducci explains this by suggesting that counter-proposals are the subject of mixed messages from elites, who only support them in order to defeat the original initiative, and thus confuse voters. It might alternatively be that counter-proposals get most support from the centre ground, so that the link between ideology and support is non-linear.
Counter-proposals get a similarly bad press in more general work. Dubois and Feeney, writing shortly after the 1990 California election, worry about the number of competing proposals on the ballot, and recommend preventing proposals from changing the rules governing their own effect (as many counter-proposals do by including measures to override competing proposals).Footnote 12 The California Commission on Campaign Finance Reform sees counter-proposals as ‘a tactic to confuse voters’.Footnote 13 Donovan, Bowler, McCuan and Fernandez categorize them as a tactic used by ‘narrow’ interest groups competing against one another.Footnote 14 Magleby sees counter-proposals not only as designed to confuse and fatigue voters, but also as compromises which move ‘part way towards the objective of the original initiative’.Footnote 15 Nonetheless, some of the same authors recommend counter-proposals from the legislature as a way to moderate direct democracy’s excesses.Footnote 16 This article moderates the negative view of counter-proposals by offering a more nuanced theory. When voters are naïve, counter-proposals do indeed split the electorate and frustrate the democratic will. If (some) voters can make sophisticated voting choices, however, counter-initiatives can actually bring outcomes closer to the median voter.
To understand which of these outcomes occurs, therefore, we need to understand how voters actually make their minds up in these elections. Perhaps the best-known contribution to the literature on voting behaviour in this context is Lupia’s claim that ignorant voters can use the support or opposition of known individuals or groups for a ballot proposition, to determine whether they should support it themselves, thus overcoming the lack of cues from partisanship or retrospective evaluation.Footnote 17 Although Lupia’s study examined voting on five competing insurance initiatives, his theory did not examine the strategic choice situation directly, instead focusing simply on whether less knowledgeable voters could emulate more knowledgeable ones. However, scholars within the voting-behaviour tradition have sought heuristics that enable strategic voting more generally. Duch and Palmer suggest that charismatic major-party leaders can act as a co-ordination device for strategic voting, while Forsythe et al. suggest that electoral history can do the same, a claim supported by Gschwend’s analysis of German elections.Footnote 18 Neither history nor party leaders are available in direct democratic votes. This raises the question: can voters vote sophisticatedly on ballot proposals? This article shows that at least some of them can. It also suggests that campaigns themselves can provide cues on how to vote, and the nature of these cues can explain when the electorate as a whole succeeds and fails to vote sophisticatedly. Some work on representative elections claims that strategic voting (‘ticket-splitting’) is encouraged, albeit inadvertently, by party campaigns.Footnote 19 On my account, interest groups can actively and deliberately discourage strategic voting by framing two proposals as competing.
When competing propositions are on the ballot, a voter may want one proposition to pass if the other fails, but to fail if the other passes. In technical terms, counter-propositions induce non-separability in voter preferences over ballot results, even when preferences on the underlying policy dimension are separable. Lacy and Niou show that naïve voting with non-separable preferences can lead to universally disliked outcomes and/or manipulation by an agenda setter.Footnote 20 I confirm this result in a specific setting, but disagree with their resulting pessimism about direct democracy. Voting behaviour in elections need not be naïve: instead, voting strategies may depend on cues from political elites.
The Formal Model
Our model is as follows. The status quo is SQ. An interest group G puts proposition P1 on the ballot. We treat the alternatives SQ and P1 as points on a line, and assume that voters know what the alternatives are, have an ideal policy point on the line, and prefer outcomes closer to that point (utility functions are symmetric and single-peaked over the real line). The interest group wants policy to be as high as possible. If counter-proposals are not possible, the highest policy they can achieve is determined by the median voter, whose ideal point is MV. Let MV′ be the point as far away from MV on the right as SQ is on the left: the median voter is indifferent between MV′ and SQ. If P1 is to the right of MV′, the median voter and the half of the electorate to her left will prefer SQ. So the highest proposal that will pass is located at MV′. The interest group sponsors P1 = MV′, and this is the outcome.Footnote 21
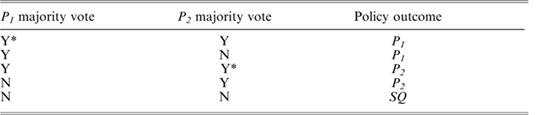
To examine the effect of counter-proposals, we introduce a second ‘conservative’ interest group C, which may sponsor a counter-proposal P2. See again Figure 1. The conservative group wants policy to be as far to the left as possible.Footnote 22 The conservative group decides whether to sponsor after learning G’s decision. This fits the pattern of past counter-proposal campaigns. Both propositions are on the same side of the status quo as the median voter.Footnote 23 Table 1 shows how election returns translate into outcomes.
Election Results and Policy Outcomes

*Indicates the proposition receiving most ‘Yes’ votes.
I examine two models. In the first, voters are naïve: they vote only for the outcome they most prefer. In the second, voters are sophisticated and vote to maximize their utility. Voters in both models are sincere, following Brams’ definition that a sincere voter who votes for option X must also vote for all options she strictly prefers to X.Footnote 24 An alternative model of naïve voting would assume that voters vote for any proposal they prefer to the status quo. Under this assumption, a P2 placed just to the right of the status quo is guaranteed to beat P1, as it will be supported by a superset of the supporters of P1 and so will pass with more votes. Thus, the direct democratic route to substantive change is blocked. This model does not resemble reality: empirically, as we shall see, ‘double-yes’ voting is rare.
Naïve Voters
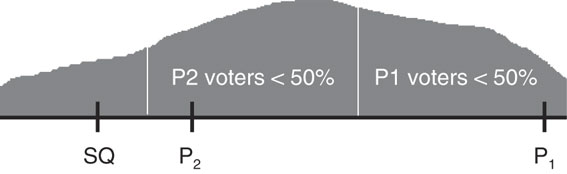
If voters only vote for their preferred proposition, then change will be limited by the costs of the conservative group. The intuition is straightforward. So long as some voters prefer the status quo to any change towards the median voter, the remaining voters can be split into two equal-sized groups by an appropriately placed counter-proposal. As these groups each comprise less than half the electorate, both proposal and counter-proposal fail. This is illustrated in Figure 3.
Proposition 1: If voters are naïve, no change from the status quo occurs when counter-proposals are possible.
Splitting naïve voters with a counter-proposal – equal numbers of voters support P2 and P1, so that neither proposal passes

proof: see Appendix A.Footnote 25
In short, if voters are naïve, counter-proposals frustrate substantive reform. If we assume that voters randomize between proposals that are located at the same point, then the conservative group can block change simply by placing P2 = P1. Even if voters co-ordinate when faced with two identical proposals, any change can be blocked, although this might involve a counter-proposal to the right of the original proposal.
Sophisticated Voters
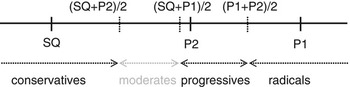
Voters’ possible preference schedules, over real-world outcomes and hence over election returns, are as shown in Table 2. Other schedules are ruled out by single-peakedness. We give voters with each preference schedule an arbitrary but convenient label. For example, ‘conservatives’ rank the status quo SQ above P2 and P2 above P1; therefore, they most prefer ‘No’ on both proposals (NN), followed by either ‘Yes’ on the counter only (NY), or ‘Yes’ on both with the counter gaining more votes (YY*), both of which mean that P2 is the outcome; their least preferred options are the two outcomes YN and Y*Y which lead to P1.
Voters’ Preferences over Policy Outcomes and Election Results

Note: AφB means that voters in this group strictly prefer A to B. A∼B means that voters in this group are indifferent between A and B.
Only for moderates, who want P2 to pass and P1 to fail in all circumstances, is voting straightforward.Footnote 26 Other voters’ preferences are non-separable: for example, conservatives will want P2 to beat P1 if they expect a ‘Yes’ on P1, but will want P2 to fail if P1 does so too. Figure 4 shows the intervals containing the ideal points of the four voter blocs.
Sophisticated voter blocs

I assume that voters in each of the four blocs co-ordinate as if they made up a single unitary actor. The idea behind this is that voters in each bloc take cues on how to vote from elites who share their preferences. For example, voters may take advice from newspapers, which regularly run editorials recommending a ‘Yes’ or ‘No’ vote on a particular proposal, or from bodies like the National Organization of Women or Americans for Democratic Action, which produce voter guides to the proposals on the ballot, or from elected politicians who come out for or against a particular proposal. Assuming that voters are individually rational would complicate the analysis without leading to substantially different results.Footnote 27
The sophisticated voting game has multiple equilibria and is less intuitive than naïve voting. However, its results are more optimistic. Voter sophistication prevents the conservative interest group from splitting the electorate. At the same time, the interest group G is constrained to propose P1 closer to the median voter by the threat of a counter-proposal.
Proposition 2: When voters are sophisticated and counter-proposals are possible, the outcome of a direct democratic campaign will be strictly closer to the median voter’s ideal point than the status quo.
proof: see Appendix A.
The argument is best illustrated with a pair of examples. First, suppose that the original interest group proposes P1 = MV. Then, any counter-proposal to the left of P1 will fail, as an absolute majority of voters will be in the ‘radicals’ group that prefers P1 to either the status quo or the counter-proposal. This group can then simply vote YN to achieve its most favoured outcome. However, suppose that P1 is placed so that the median voter is indifferent between it and the status quo: P1 = MV′. Then consider a counter-proposal at the median voter’s ideal point: P2 = MV. Now, the conservative, moderate and progressive groups prefer P2 to P1, and these are a majority of the voters. There is then a voting equilibrium in which all three groups vote NY and P2 passes, beating P1. Neither of these examples shows equilibrium behaviour by the interest groups: in equilibrium, the original interest group proposes P1 to the right of the median voter, but not so far as to generate a successful counter-proposal. As a result, P1 is closer to the median voter than the status quo.
So, if votes are cast in a sophisticated way, then the threat of counter-proposals does not block substantive change by the initiative process. Instead, initiatives are moderated towards the median voter.
Empirical Tests
My models generate predictions about counter-proposal outcomes. Strictly, both models predict no counter-proposals in equilibrium. This unrealistic prediction is driven by the assumption of complete information. If we allow that interest groups may be mistaken about voter opinion, then some counter-proposals will occur. The naïve model then says that the counter-proposal can usually be written to cause both competing proposals to fail. The sophisticated model says that the counter-proposal will not make both proposals fail (unless both interest groups have completely misestimated the voters’ preferences) but will normally pass with more votes, or pass while the original proposal fails. Table 3 collates the results of all pairs of competing proposals in California since the introduction of the initiative.
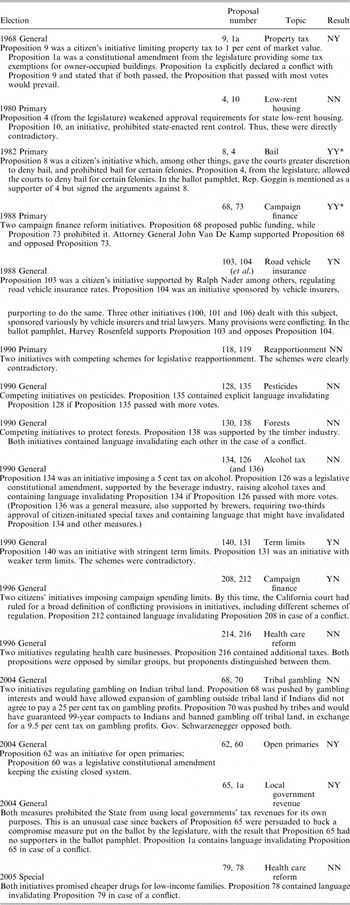
Californian Competing Proposals, 1939–2007

Notes: Where more than two competing proposals existed, this was only counted as one pair (all the counter-proposals always passed or failed together). The competing proposals are listed in Appendix 1.
Clearly, neither naïve voting nor sophisticated voting explains all the results. Although the modal outcome is that both competing initiatives failed (as naïve voting would predict), half of the cases show one or the other initiative succeeding. In addition, there are two cases in which both initiatives got a majority of the vote. This clearly could not happen unless at least some voters were voting ‘Yes’ on both initiatives. So there is some prima facie evidence of sophisticated voting from the macro-level data. However, perhaps voter ignorance, rather than sophistication, explains YY voting: maybe YY voters simply did not realize that the relevant ballot measures were in conflict, or they did not understand the consequences if both passed. There may also have been competing proposals which do not fit our model – for example, if rival proposals for change are put forward by two groups who favour different degrees of reform, or by groups with different preferences over a multidimensional issue space. One important issue is that the court decision giving a broad interpretation to ‘competing’ proposals was given in 1990. Arguably, before the ruling, the legal situation was unclear and voters may have been uncertain about the outcome if both proposals passed. However, as stated, some initiatives contained language explicitly invalidating their rivals wholesale if they passed with more votes (examples include Proposition 1a in 1968 and Proposition 104 in 1988).
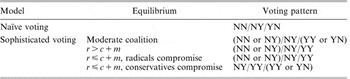
To detect sophisticated voting, I therefore examine individual voting intention data in a subset of proposal pairs which clearly match the model conditions. The sophisticated model allows multiple equilibria. For testing, we assume that when a group could vote in different ways without affecting the outcome, members of the group will vote in any undominated way, as there is no pay-off to effort spent on co-ordination. Predicted voting patterns from the voting game are shown in Table 4.
Predicted Voting Patterns

Sophisticated models predict YY voting by groups of voters defined by the underlying policy dimension: either a group of voters in the middle of the policy spectrum, or all voters to the right of some cut-point. The naïve model predicts no YY voting. However, if some voters are unaware that proposals are competing, then, of this uninformed group, more extreme voters will vote YY. Thus, on this slight extension to the naïve theory, YY votes should be found among more extreme and less informed voters. On the sophisticated theory, voters’ levels of information should not be relevant; in some equilibria, more extreme voters vote YY, while in others, moderate voters vote YY. To sum up: if YY voters are more moderate than YN voters, then this is evidence against naïve voting. If YY voters are less informed than YN voters, this is evidence against sophisticated voting. If YY voters are more extreme than YN voters, this is compatible with either theory.
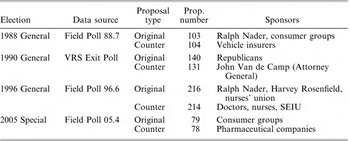
I select contests in which (1) voters are likely to have known the consequences of both initiatives passing – thus, contests after the 1990 court decision, or in which one or more proposals contained explicit language invalidating its rivals; (2) it is possible to identify the original proposal and the counter-proposal by examining the backers of each proposal; (3) the contest clearly fits the model of one proposal’s supporters aiming for policy change while the other group would ideally prefer no change at all; and (4) we have reasonably adequate data on underlying policy preferences. The chosen contests are listed below in Table 5.
Competing Proposals Tested

In 1988, Proposition 104 contained language invalidating other propositions on road vehicle insurance if they passed with fewer votes (including Proposition 103). In the 1990 general election, a VRS exit poll with a large sample size allows us to find significant predictors of voting behaviour on two rival initiatives relating to term limits. In 1996, the Field poll asked respondents’ opinions of Ralph Nader, backer of Proposition 216, and about support for government intervention more generally. In 2005, only demographics are available.
I used, as independent variables for all the regressions, demographics, including ethnicity, income, education, religion, age and, where possible, employment, unionization, home ownership and marital status. Each of these demographics has been found to predict votes in some, though not all, initiative elections.Footnote 28 I also always included party allegiance and liberal–conservative ideology, which are known to be good predictors of ballot measure voting.Footnote 29 Where possible, I also included measures for support for change on the proposal’s topic. In 1988, I included support for two other ballot measures that were likely to be linked to support for government intervention: a proposal to establish a fund for homelessness and to restore funding for Cal-OSHA, the state’s occupational safety and health plan. In the 1990 general election, I expected religious attendance, Protestantism, and concern over political ethics (measured by belief that ethics mattered in the choice of state governor) to be predictors, as well as residence in a state seat which was uncontested, and in an uncontested seat occupied by someone of the ‘opposite’ party to the respondent. I expected support for Pete Wilson, who had come out in favour of term limits, to predict support for change; similarly, as President Bush had supported term limits, I expected support for Bush to be relevant. In 1996, approval of Ralph Nader was expected to predict support for the original Proposition 216, sponsored by him; I also expected general support for government intervention to predict support for Proposition 216, as the proposition increased regulation of health care providers and imposed extra taxes.
Results
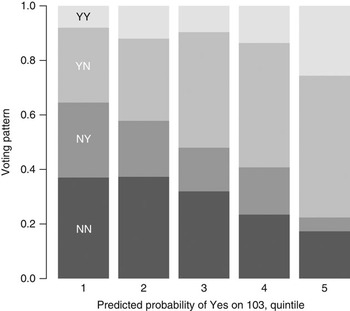
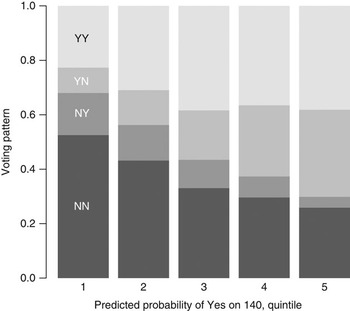
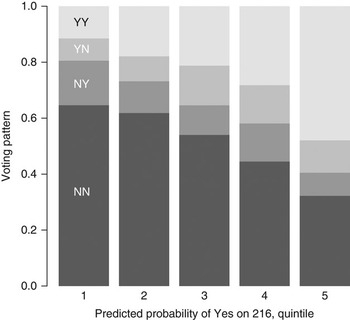
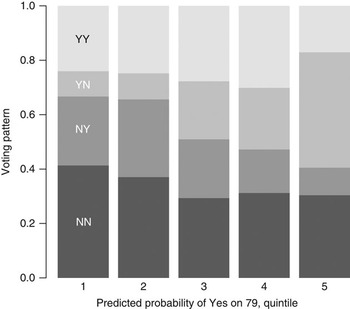
To explore whether YY voting can be predicted by underlying preferences, I first run a set of logit regressions on the vote on the original proposal.Footnote 30 Theories of naïve and sophisticated voting agree that voters to the right of some cut-point vote ‘Yes’. The independent variables, multiplied by their estimated slopes, are the best linear predictor of the logged odds of a ‘Yes’ vote, and thus provide a rough measure of underlying preference. I then plot voting patterns against this predicted probability. Both theories predict that NY voting should be related to ideology, usually in a non-linear way: conservatives vote NN and radicals vote Y on the first initiative, while those in the middle are more likely to vote NY. Both theories also predict that YY voting should be related to ideology: naïve voting predicts a positive relationship as uninformed extremists vote YY instead of YN; sophisticated voting predicts either a positive relationship or a non-linear relationship in which relatively centrist voters choose YY while extremists choose YN. Figures 5–8 divide voters into quintiles by their predicted probability of a ‘Yes’ vote on the original proposition, and show the actual voting patterns in each quintile.
Voting patterns, Propositions 103 and 104, 1988

Voting patterns, Propositions 140 and 131, 1990

Voting patterns, Propositions 216 and 214, 1996

Voting patterns, Propositions 79 and 78, 2005

The pictures show a clear relationship between YY voting and predicted probability of voting ‘Yes’ on the original proposal – unsurprisingly, as YY voters helped generate the predicted probabilities in the original regression. More interestingly, in the case of Propositions 131 and 140, the ratio of YN to YY voting increases with the predicted probability. That is, among ‘Yes’ voters on the original proposal, those with higher predicted probabilities of voting ‘Yes’ on the original proposal were more likely to vote ‘No’ on the counter-proposal. This is what would happen in a sophisticated equilibrium where more moderate voters were voting YY while more extreme voters chose YN. The same is true for Propositions 78 and 79 in 2005. In 1996, however, the reverse holds: more extreme voters are relatively more likely to choose YY than YN. The pattern in 1998 for Propositions 103 and 104 is less clear. It seems that in some cases at least, moderates are voting YY as the sophisticated voting theory would predict.
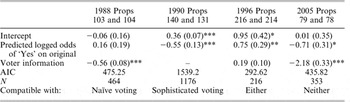
For a more formal test, I run a second round of logistic regressions, this time including only voters who voted ‘Yes’ on the original proposal. The dependent variable is the vote on the counter-proposal: in other words, we are comparing YY voters to YN voters. As an independent variable, I include the predicted logged odds of voting ‘Yes’ on the original proposal. This, again, gives a rough measure of the underlying ideological position. I also include variables measuring the voter’s levels of information about the proposals and interest in them. Naïve voting predicts that ideological position should be positively related to voting Yes on the counter-proposal, and negatively related to levels of interest and information. Sophisticated voting predicts that ideological position may be positively or negatively related to voting ‘Yes’ on the counter; interest and information should not be significant.
Results are reported in Table 6. There is some evidence to support both naïve and sophisticated models. In 1988 and 2005, voting YY was clearly linked to lack of informationFootnote 31 but in 1990 and 2005, voting YY was negatively correlated with our measure of the voter’s ideal point: in other words, among those who voted ‘Yes’ on the original proposal, more centrist voters were more likely to vote ‘Yes’ on the counter, as the sophisticated voting model predicts.
Regressions of Counter-Proposal Vote on Voter Ideal Point and Information Level among ‘Yes’ Voters on Original Proposal

Notes: Weighted logits. ‘Voter information’: 1988, total number of vehicle insurance propositions recognized; 1996, total number of ballot propositions recognized; 2005, voter could identify backers of both propositions. *Significant at 5 per cent, **significant at 1 per cent, ***significant at 0.1 per cent.
The simplest interpretation is that in the real world, some YY voters are unaware of the strategic situation, while others are deliberately choosing to support both measures against the status quo. Also, the numbers of each kind of voters vary in different elections.
Heuristics For Sophistication
As not all initiatives are defeated by counter-initiatives, even when they face determined and organized opposition, the naïve model of voting cannot capture the whole truth about counter-proposals. By contrast, as pairs of competing proposals often do fail, it seems likely that counter-proposals do sometimes succeed in splitting the voters. The data support a mixed interpretation in which there are some of each kind of voters. This raises the question: what determines whether voters act naïvely or strategically? In the absence of cues from past performance, electoral history or party allegiance, one possible source of information is the campaigns themselves. For example, in the 2005 vote on competing health care initiatives, the website supporting Proposition 79 contained prominent pages attacking Proposition 78, while the ballot pamphlet’s supporters of Proposition 78 were also the opponents of Proposition 79, and advertisements were aired supporting 78 and simultaneously opposing 79. Thus, the two propositions were presented to voters by both sides as opposites. Both failed. I suggest that voters accepted the frame proposed by both sides in the campaign, in which initiatives were seen as mutually opposed. Within this frame, voting YY made no sense: to support 78 was to be against 79, and vice versa.
By contrast, consider Propositions 8 and 4 in 1982. These dealt with bail; Proposition 8 restricted bail greatly, and would have forced judges to deny bail for violent crimes, while Proposition 4, a compromise from the legislature, allowed judges to deny bail for some violent crimes. However, the two proposals were not framed as opposites. In the ballot pamphlet, opponents of Proposition 8 make a single cursory mention of Proposition 4; otherwise, there are no cross-references between them. Nor did media reports paint the initiatives as rivals. The naïve voters in the model in an earlier section would have voted for either one or the other proposal, and could at best have co-ordinated to ensure that one passed. In fact, both passed.
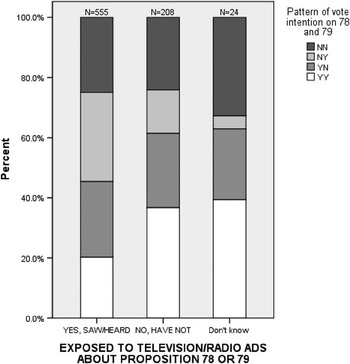
To test the theory that voters take cues from the oppositional or mutually supportive nature of the campaign, I examine the effect of having viewed television advertisements for Propositions 78 or 79 on vote choice. If the campaigns encouraged voters to view proposals as mutually exclusive and opposing, then voters who had seen campaign advertising on television would be more likely to vote either YN or NY, and less likely to vote YY, than those who had not. Figure 9 shows the simple bivariate relationship between vote and advertisement exposure.
Voting patterns by exposure to television advertisements, Propositions 78/79, 2005

As expected, those who had seen the television advertisement were more likely to vote either YN or NY. On the face of it, the television advertisements (overwhelmingly funded by the pro-78/anti-79 camp) worked by converting YY voters into YN voters. A simple logit regression, with dependent variable ‘vote intention NY or YN’, and controlling for awareness of the proposition, knowledge about the backers of each proposition and education levels, shows the coefficient on exposure to the television advertisements positive and significant as expected, (p = 0.033; model Nagelkerke R 2 = 0.116). Coefficients for knowledge about the backers of each proposition and awareness of the proposition were also positive and significant. Although data limitations prevent a more in-depth investigation into the causes of naïve voting, there is reason to believe that, at least in this case, the campaign polarized voters.
Supporters of the counter-proposal who seek to block all change have an incentive to polarize the campaign, but why do supporters of the original proposal fall into this trap? There are many possible reasons, though they are beyond the scope of the formal model. Being associated with a successful initiative may bring ego or reputational benefits. The initiative itself may reward its backers directly, perhaps by creating bureaucratic positions which they are likely to fill. Lastly, backers of the original proposal may be optimistic about its chances of winning and may therefore weigh the advantage of winning with their more radical proposal more highly compared to the benefit of getting at least some change if the counter-proposal passes.
Conclusion
Most direct democratic elections are straightforward: voters need only decide whether they prefer a proposed change to the status quo. Counter-proposals, in contrast, offer a demanding test of voter sophistication. Voters must gauge their preferences over competing proposals without the usual cues of party affiliation, and without being able to infer the content of a proposal from the preferences of its backers. They must also co-ordinate with other voters to translate their preferences into outcomes, for example by taking advice on how to vote from the media or from independent organizations such as the National Organization of Women. Given the obstacles they face, it is not surprising that sometimes voters fail to co-ordinate and conservative groups succeed in splitting their opponents; but as voters regularly pass initiatives against organized and well-funded opposition, they cannot always fail at this task. My analysis finds that at least some voters make sophisticated tactical choices in votes on competing ballot measures: some relatively moderate voters vote ‘Yes’ on both the proposal and the counter-proposal. This is startling confirmation that voters can indeed act sophisticatedly, even in a quite low-information environment. Although the historical and party cues available during representative democratic campaigns may make strategic voting easier, they are not necessary for it.
However, voters are not so sophisticated as to be impervious to campaigning. The nature of the campaign mediates vote choice, and polarized campaigns can push voters towards the naïve voting paradigm in which competing proposals are seen purely as rivals. This provides evidence in a new context for the idea that strategic voting is affected by party messages. Moreover, while existing work assumes strategic voting is encouraged inadvertently by campaigns aiming to make their candidates more prominent, the examples here suggest that it can be manipulated deliberately: campaigns can polarize the debate so as to discourage strategic ‘double-Yes’ voting. Future research could ask whether similar tactics work in representative campaigns.
Practically, the results here should assuage the worry of Lacy and Niou that voters will be unable to cope when issues are linked.Footnote 32 They also suggest that counter-proposals may not always deserve their bad press. They have the potential to confuse and divide voters. But if the circumstances are right, they can also offer reasonable compromises. Policy makers should consider ways of explaining the voting situation better, to avoid manipulation by interest groups. For example, in California’s ballot pamphlets, the Legislative Analyst could discuss groups of competing initiatives together explicitly and explain how votes translate into outcomes.
More broadly, this work supports a cautiously optimistic view of voter capabilities. Voters are not immune to manipulation and framing by interest groups. They can be fooled some of the time; but some voters can also figure out how to express their interests at the ballot box, even when the best choice depends on other voters’ actions, when party cues are absent, when a proposal’s content cannot be inferred from its supporters, and when campaigns may be actively misleading. So, they cannot all be fooled all of the time.
Appendix 1:
Competing Proposals, 1939–2007

Notes: Competing propositions were found by examining ballot pamphlets for clearly contradictory provisions – provisions that could not simultaneously have been implemented. After 1990, this includes different schemes of regulation for a subject area, which could not have been practicably implemented together. In practice, the boundaries of this definition are not clear-cut: for an alternative, more inclusive list, see Gilbert and Levine, ‘Less Can Be More: Conflicting Ballot Proposals and the Highest Vote Rule’.
*Indicates which proposition gathered most votes. Y*Y: original proposition; YY*: counter-proposition.