Implications
The production rates of tropical livestock estimated at the sub-national or national levels are generally given without any confidence intervals (CIs), whereas many of the input data used for these estimations are very uncertain. The present article is a first attempt at integrating various sources of knowledge and data for estimating the CIs of such rates for cattle herds in African drylands. Face to the large CIs, this article demonstrates the need for increasing the knowledge on herd performances and, by determining the most contributing variables to the outputs variances, helps orientate the research efforts for data collection.
Introduction
In Sub-Saharan African countries (SSA), the estimation of livestock production remains a challenge, whereas this production is considered as an important source of revenue for the households and the countries (Alary et al., Reference Alary, Corniaux and Gautier2011; Pica-Ciamarra et al., Reference Pica-Ciamarra, Tasciotti, Otte and Zezza2015). The information required for the calculations, mainly the animal population sizes and the mean herd performances (the reproduction and mortality rates, the live and meat weights and the milk yields), are generally very uncertain (Lesnoff et al., Reference Lesnoff, Corniaux and Hiernaux2012; Carletto et al., Reference Carletto, Jolliffe and Banerjee2015). The population sizes are frequently defined based on the official statistics available from the national services or FAOSTAT and the herd performances based on literature reviews or expert opinions. At present, these estimates are affected by large uncertainties due to a lack of national livestock censuses and due to the scarcity of reliable on-farm data on herd performances. Nevertheless, in the past, to the knowledge of the author, these uncertainties have never been taken into account in the calculations of livestock animal productions at the sub-national (e.g. administrative regions) or national scales.
Based on a state-of-the-art of the current knowledge and a set of available data on the herd performances, this article presents an approach for uncertainty analysis on the estimations of annual livestock productivity rates. As an example, the article focuses on the productivity of cattle populations of the West and Central African drylands, where production is dominated by traditional low-input husbandry systems. Drylands are defined in the article as the areas having an annual rainfall lesser or equal to 1000 mm/year, generally classified as arid or semi-arid areas (Seré and Steinfeld, Reference Seré and Steinfeld1996). This corresponds for instance to countries such as Niger, or the north and central parts of Burkina Faso, Mali and Senegal. The productivity rates considered in the article were calculated in animal numbers and meat weights, using a simple herd growth model (Lesnoff, Reference Lesnoff2014). The uncertainty analysis had two main objectives: first, to calculate (by uncertainty propagation) confidence intervals (CIs) for the productivity rate estimates and second to determine (by global sensitivity analysis) which among the input variables of the herd growth model contributed the most to the output variances.
Material and methods
Productivity rates
The productivity rates considered in this article are defined as follows. For a given livestock population and a 1-year time interval (t, t+1 year), the population size at the end of the year can be calculated as follows:
 $$N(t{\plus}{\rm 1 year})=N(t){\plus}b-d-o{\plus}i$$
where b, d and o are the number of births, the natural deaths and the offtake (slaughtering, sales and gifts) that occurred over the year, respectively, and i is the number of eventual animal intake (e.g. purchases). After re-arrangement, this equation becomes b−d=o net+ΔN, where o net=o−i is the net offtake and ΔN=N(t+1 year)−N(t) the stock variation. The quantity Q=b−d, or equivalently Q=o net+ΔN, represents the overall 1-year production of the population in animal number. As it corresponds to the number of animals that can be harvested without decreasing the initial stock (ΔN=0 if o net =b−d), Q can also be referred to as the sustainable offtake for the population (Lesnoff, Reference Lesnoff2014). The stock variation ΔN becomes negative if the harvest o net overpasses the sustainable offtake and, inversely, becomes positive if the sustainable offtake are under-used. Compared with b−d, the quantity o net+ΔN has the advantage to be easily expressed in other units than animal numbers, for instance by weighting the animal numbers by live or meat weights or financial values.
In this article, two production rates were defined from the overall production Q. The first rate was the productivity rate in animal numbers (RN) defined by
 $RN=Q/\bar{N}$
, where Q=o
net+ΔN and
 $$\bar{N}$$
is the average population size over the year. A value of RN=0.15 animal/animal-year means, for instance, that the sustainable offtake for a population of 1 million animals in average over the year is expected to be 150 000 animals. The second rate was the productivity rate in meat weight (RW), defined by RW=Q
w
/
 $$\bar{N}$$
, where Q
w
was calculated as Q but weighting the animal numbers (by sex and age class) by their meat weight equivalents.
Herd growth model
The rates RN and RW were calculated by running a herd growth model over 1 year. The herd growth model is a discrete time population matrix model (Caswell, Reference Caswell2001) using a 1-month time-step and splitting the population by sex and 1-year age class. The 1-month dynamics are given by x (t+1 month)= B × x (t), where x (t) is the population-state vector, describing the animal numbers by sex and age class living in the population at time t, and B is the 1-month projection matrix containing 1-month demographic rates (i.e. calving, mortality and net offtake) by sex and age class. The net offtake corresponds to the animal exits from the population (e.g. slaughtering and sales) minored by eventual animal intake (e.g. purchases). The 1-year dynamics are given by x (t+1 year)= A × x (t), where A = B 12 is the 1-year projection matrix.
If the projection matrix A is assumed to be constant over the years, such a matrix model has the property to converge to a steady state (Caswell, Reference Caswell2001). At the steady state, the annual multiplication rate of the population m(t, t+1 year)=N(t+1 year)/N(t) is a constant scalar λ, and the population structure m(t)= x (t)/N(t) is a constant vector v . From theoretical results of population matrix models (Caswell, Reference Caswell2001), the rate λ is the dominant eigen-value of A and the structure v is the corresponding right eigen-vector after its components have been standardized to sum to 1. In this article, the productivity rates RN and RW were estimated assuming this steady state. This hypothesis represented an average situation with no important demographic shock such as droughts that can strongly affect the herd performances in dryland areas.
The calculations were as follows. Given a set of 1-month demographic rates (matrix
B
) and an initial population vector
x
(0)=N×
v
, the dynamics over the year were given by
B
12×
x
(0)=
A
×
x
(0)=λ×
x
(0). For each month i, the model calculated by sex and age class the sum of the stock variation of the population and the net offtake (i.e. o
net,i
+ΔN
i
), first in animal numbers and second (after multiplication by meat weights per animal by sex and age class) in meat weight equivalents. Subsequently, the 12 1-month productions were summed over the year to get Q and Q
w
. The rates RN and RW were calculated by dividing Q and Q
w
by the mean population size over the year
 $$\bar{N}$$
obtained from the herd growth model. The herd growth model was programmed with the package mmage (Lesnoff, Reference Lesnoff2014) using the R statistical software (R Core Team, 2014).
Input variables
The input variables considered for the uncertainty analysis are listed in Tables 1 and 2. They are the demographic rates (calving, mortality and net offtake rates), the animal longevities (maximum ages) in the population and, for meat productions, the animal live weights and the dressing-out rate. The dressing-out (or carcass performance) rate is the proportion of meat that can be obtained from the live weight of a slaughtered animal. In total, there were 15 and 22 input variables for RN and RW, respectively. The initial population size N used to define the initial population vector
x
(0) in the herd growth model had no importance for RN and RW as both rates are divided by
 $$\bar{N}$$
and was set to an arbitrary number of 1000 animals.
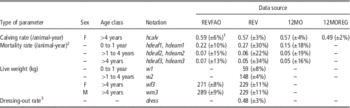
Summary of the Gaussian conditional probability distributions for the calving and mortality rates, the live weights and the dressing-out rate for the different data sources

The conditional probability distributions of the other input variables are described in the text for the female and male animal longevities (noted amaxf and and amaxm, respectively) and in Table 2 for the net offtake rates.
1 Estimated conditional mean θ k of the parameter depending on the data source, with in brackets the percentage of relative variation corresponding to the Gaussian 95% confidence interval of the mean (i.e. 100×u/θ k where u=1.96×γ k and γ k is the standard error of θ k estimated from the data source).
2 Notation relates to the sex of animal (e.g. hdeaf1 for female, heam1 for male).
3 The meat equivalent (kg) of a given live weight w (kg) was calculated by dress×w.
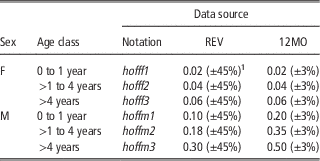
Summary of the Gaussian conditional probability distributions of the net offtake rates (/animal-year) for the different data sources

F=female; M=male.
The REV and 12MO net offtake rate estimates corresponded approximately to mean female proportions of 0.67 (standard error γ=0.023) and 0.74 (γ=0.005), respectively.
1 Estimated conditional mean θ k of the parameter depending on the data source, within brackets the percentage of relative variation corresponding to the Gaussian 95% confidence interval of the mean (i.e. 100×u/θ k where u=1.96×γ k and γ k is the standard error of θ k estimated from the data source).
In the literature and in many surveys, herd performance variables are not available for the monthly time steps and the annual age classes defined in the herd growth model used in this study. They are generally available for yearly time steps and more aggregated age groups. This article follows this type of categorization for defining the input variables of the uncertainty analysis. The input demographic rates were annual rates (as well as the live weights) and were defined for the following age groups: 0 to 1 year (juveniles), >1 year to 4 years (sub-adults) and >4 years (adults) (Tables 1 and 2). Before each run of the herd growth model, monthly demographic rates were derived from the annual rates, and the age-group input variables were allocated to the relevant 1-year age classes of the model.
The age at which calving starts is known to have an effect on the herd productivity. Nevertheless, this variable has not been considered as an additional input for the uncertainty analysis. Calving before the age of 4 years is negligible in traditional dryland systems. For simplification, in the herd growth model, the possible variations of the age of first calving after 4 years of age have been integrated in the adult female calving rate defined for the adult females (for instance, a delay in the first calving decreases the calving rate).
Uncertainty propagation
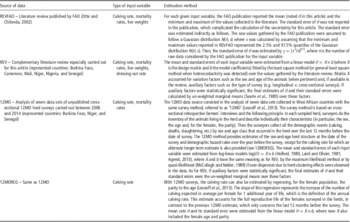
The uncertainty propagation study consisted of estimating the 95% CIs of the productivity rates RN and RW by simulating randomly the input variables from probability distributions described in this section. The herd growth model generated empirical distributions for RN and RW, which are summarized by their means and 2.5% and 97.5% quantiles. The probability distributions of the input variables were estimated from five possible data sources depending on the variable (Table 3): two corresponded to literature reviews (noted REVFAO and REV, respectively), two corresponded to the analysis of unpublished recent data sets available to the author (noted 12MO and 12MOREG, respectively) and one corresponded to the expert opinion (noted EXP). All the data sources concerned traditional husbandry systems of West and Central African drylands and periods without environmental shocks such as droughts. Data on improved farming systems or research stations were not considered.
Calculation of the mean and standard error of the herd performance input variables depending on the data source

A two-step Monte Carlo procedure following a hierarchical multi-model inference approach (Burnham and Anderson, Reference Burnham and Anderson2002; Hooten and Hobbs, Reference Hooten and Hobbs2015) was used for accounting both the within- and between-data sources variability of the input variables. Let us, for instance, note θ k , the mean estimate of a given input variable calculated for the data source k, and K the number of available data sources for this variable. For simulating a value, the first step of the procedure consisted of sampling a data source k within the K possible sources. As no information was available for favoring one data source compared with the others, all the data sources had the same probability 1/K to be selected. The second step consisted in sampling a value from the probability distribution of θ k for the selected source. In this article, the probability distribution of θ k is referred to as a conditional distribution. The conditional probability distributions of the calving rate, the mortality rates, the live weights and the dressing-out rate were assumed to be Gaussian Normal(θ k , γ k ), where γ k was the standard error of the mean θ k estimated from the data source. The calculations are described in Table 3, and the results are shown in Table 1. The conditional probability distributions of the net offtake rates were also assumed to be Gaussian N(θ k , γ k ). Nevertheless, their estimation was more difficult as too sparse data were available: for instance, no data describing the net offtake by sex and age class were found in the literature, and the 12MO data source alone was considered as an inadequate representative of the situations met in drylands for the net offtake. In this article, the conditional distributions of the net offtake were estimated indirectly from expected sex structures (i.e. the proportions of females in the population) for which data were available from the data sources REV and 12MO. Using the fact that the female proportion is highly correlated to the net offtake rates (Matthewman and Perry, Reference Matthewman and Perry1985; Lesnoff et al., Reference Lesnoff, Corniaux and Hiernaux2012) – for instance, an increase in female offtake rates necessarily decrease the female proportion – the mean net offtake rates θ k and s k were preliminarily calibrated in the herd growth model to obtain the conditional distributions of the female proportion estimated for REV and 12MO. The results are presented in Table 2. Finally, the conditional probability distributions of animal longevities (integers representing the numbers of years of life) were defined using expert opinion as only 12MO age class data were available, and information based on memory recalls becomes more and more uncertain when the age of the animal increases. The distributions were assumed to be discrete triangular distributions, with the female maximum age varying between 13 and 17 years (with a mean of 15 years) and the male maximum age varying between 7 and 11 years (with a mean of 9 years). When all the input variables of the herd growth model were set to their marginal mean estimate, the simulated population was in demographic equilibrium (λ=1).
The replication of this two-step procedure generated the final probability distribution of each input variable mixed over the K data sources, referred to as a marginal distribution in the article, and which had generally a multi-modal form (each mode corresponding to a data source). Following the marginal distributions, the input variables were simulated independently using a replicated Latin-hypercube design (Stein, Reference Stein1987) that enables to improve the convergence of the output probability distribution estimates (Faivre et al., Reference Faivre, Ioos, Mahévas, Makowski and Monod2013). The replicated Latin-hypercube design was carried out with the package lhs (R Carnell) of the R software (R Core Team, 2014). The number of replications was 28 800, which was checked to be sufficient to stabilize the outputs. For each replicate, the herd growth model was run, and the rates RN and RW were calculated.
Sensitivity analysis
A preliminary exploration of the simulation results showed strong linearity between the outputs RN and RW and the input variables. This motivated the use of the standardized regression coefficients (SRC) method for estimating the contributions of the input variables to the output variances (Saltelli et al., Reference Saltelli, Chan and Scott2000; Faivre et al., Reference Faivre, Ioos, Mahévas, Makowski and Monod2013). A linear regression model
 $$y_{[l]}=\beta _{0} {\plus}\mathop{\sum}{_{{j={\rm 1}..{\rm 12}}} } \beta _{\it j} {\times}z_{{i[l]}} $$
(where y [l] is the output for replication l, z j[l] the value of the input variable j and β j the regression coefficients) was fitted for RN and RW over the sample corresponding to 28 800 replications. The contributions to the output variances were estimated by the squared SRC calculated as follows:
 $$(b_{i} {\times}s_{i} /{\rm s})^{{\rm 2}} $$
where b j is the least square estimate of β j , and s j and s are the estimated standard deviations of z j and y, respectively.
Comparison with FAOSTAT estimates
Rates RN and RW estimated in this article were compared with rates estimated from national data reported in the FAOSTAT database (FAOSTAT, 2015). The FAOSTAT RN and RW rates were calculated each year for the time period 1961 to 2012 for six Sahelian countries (Burkina Faso, Chad, Mali, Mauritania, Niger and Senegal) using the data on animal numbers and productions provided on the FAOSTAT website. Some extreme values of the FAOSTAT rates were observed for particular countries and years – for instance, extreme low values due to the droughts during 1973 to 1974 and 1983 to 1984 – or doubtful outliers. For more robustness, the rates were summarized by trimmed means (i.e. calculated after excluding 7.5% of the data at each end of the distribution) and medians instead of simple means.
Results
Uncertainty propagation and comparison with FAOSTAT
From all the data sources, the mean RN was estimated to be 0.127 animal/animal-year with a 95% CI of (0.091, 0.163), and the mean RW to be 11.7 kg/animal-year with a 95% CI of (8.8, 14.7). This corresponded to relative variations around the mean of about ±29% and ±25%, respectively. The mean and median RN estimated by country from the FAOSTAT data were higher than the present mean estimate except for Senegal (Figure 1). Niger showed particularly high FAOSTAT values with a trimmed mean and a median (0.20 animal/animal-year and 0.22 animal/animal-year, respectively) outside of the 95% CI calculated in this study. This over-estimation pattern was even higher for the rate RW, for which all the countries had FAOSTAT trimmed means and medians higher than the upper limit of the 95% CI (Figure 1).
Summary of the FAOSTAT rates RN and RW estimated for six Sahelian countries for the time period 1961 to 2012 (circles=trimmed means; crosses=medians). The three dotted vertical lines represent the mean and the limits of the 95% CIs of the rates estimated in this article.

Sensitivity analysis
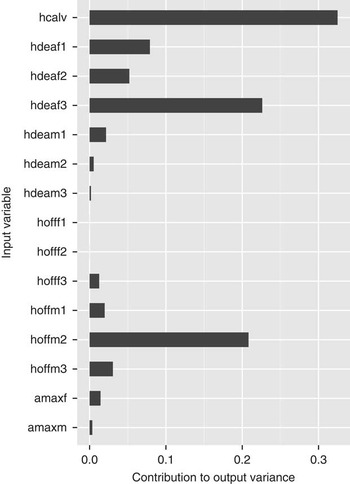
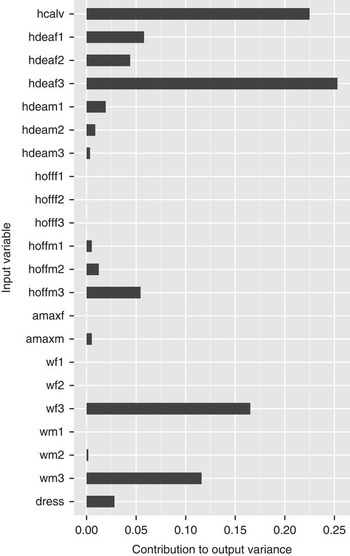
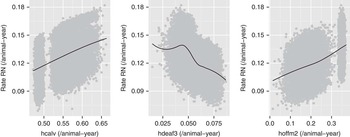
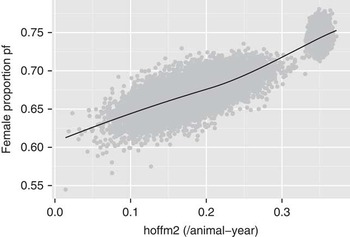
The adjusted coefficients of determinations (R 2) of the linear models fitted for RN and RW were higher than 0.99, indicating a very good fit of the SRC linear models to the simulated data. The contributions of the input variables to the output variances are presented in Figures 2 and 3. The three most contributing variables to the RN variance were by order of importance the calving rate hcalv, the adult female mortality rate hdeaf3 and the sub-adult male offtake rate hoffm2 (Figure 2). They accounted for almost 76% of the variability; Figure 4 illustrates their effect on RN. Another contributing factor but with lower importance was the juvenile female mortality hdeaf1. As a remark, the contribution of the offtake rate hoffm2 was due to an indirect effect of the population sex structure. In fact, increasing the male offtake, particularly for sub-adults, necessarily increases the female proportion pf (Figure 5), which is known to have the consequence of increasing the productivity rates RN (Lesnoff et al., Reference Lesnoff, Corniaux and Hiernaux2012). For RW, the same pattern as for RN was observed (except that hdeaf3 showed more importance), but three additional factors had a high contribution (Figure 3): the adult live weights (wf3 and wm3) and, to a lesser extent, the dressing-out rate dress.
Contributions of the input variables to the RN variance estimated by the standardized regression coefficients (SRC) method.

Contributions of the input variables to the RW variance estimated by the standardized regression coefficients (SRC) method.

Variation of the productivity rate RN with the calving rate hcalv, the adult female mortality rate hdeaf3 and the sub-adult male offtake rate hoffm2 (the black line is a non-parametric smooth of the data).

Variation of the female proportion in the population pf with the sub-adult male offtake rate hoffm2 (the black line is a non-parametric smooth of the data). The proportion pf is a result of the herd growth model.

Discussion
The mean sustainable offtake estimated in this article (RN=0.13 animal/animal-year) is consistent with usual guess estimates of 10% to 11% for the average offtake rate at the country level for drylands (Sarniguet et al., Reference Sarniguet, de Mieulle, Blanc and Tyc1975; Pradère and Sidibe, Reference Pradère and Sidibe1989; Pradère, Reference Pradère2007). This would correspond to an average population growth rate of 2% to 3%/year, which is a realistic hypothesis compared with the human population growth in SSA countries. In contrast, if this estimate is taken as the reference, the sustainable offtake reported by FAOSTAT between 1961 and 2011 may be overestimated (in average) for most of the countries considered in this article, especially for Mali and Niger that had median RN of 0.16 animal/animal-year and 0.22 animal/animal-year, respectively. This overestimation may be even more important for meat production: the FAOSTAT median RW were all higher than the 95% CI upper limit estimated in this article for the mean RW. This was not only due to the overestimation of the productivity in animal numbers (RN) but also, and essentially, due to a possible overestimation of the mean animal live weights that multiply the animal numbers to get RW. Considering for instance a dressing-out rate of 0.47, the mean live weight per produced animal calculated from FAOSTAT varied between 0.94 tropical livestock unit (TLU)/animal and 1.11 TLU/animal (1 TLU=250 kg of live weight) depending on the countries, whereas in this article it was ∼0.70 TLU/animal.
Based on the information considered in this article, the uncertainty for RN and RW was large (CIs of about ±30% and ±25% around the mean, respectively). To the best of the author’s knowledge, this study is the first attempt of integrating the variability of various data sources on productivity estimates of cattle herds in the African drylands, and it was not possible to compare these results with other studies. The large CI ranges that were estimated indicate, first, that productivity rates based on literature data or expert estimations of the herd performances should be considered with caution and, second, that research efforts should be undertaken in future to decrease the knowledge gaps. As already recommended in the past (Lesnoff et al., Reference Lesnoff, Corniaux and Hiernaux2012), the last point could be progressively achieved by implementing multi-year on-farm herd monitoring surveys in selected pilot areas accounting for the time and the spatial variability of the herd performances. Long-term herd monitoring surveys were implemented in the 1980s in Sahelian countries – for instance, on cattle in Mali (Wagenaar et al., Reference Wagenaar, Diallo and Sayers1986; Wilson, Reference Wilson1986) and on small ruminants in Senegal (Faugère et al., Reference Faugère, Merlin and Faugère1991; Tillard et al., Reference Tillard, Moulin, Faugère and Faugère1997) – and highly valuable data and knowledge were obtained. Nevertheless, such protocols have been replaced by slighter methods, in particular cross-sectional surveys based on farmers’ interviews and their memory recall of the short- or long-term herd demography such as 12MO, which are less expensive but provide less reliable data. The present study assumed the same level of confidence for all the data sources (each source had the same probability 1/K to be selected in the two-step Monte Carlo procedure). Other hypotheses could be considered in the future for estimating the sensitivity of the results to the probability distribution representing these confidence levels. In particular, if gold-standard herd monitoring data are available in the data sources, less confidence could be given to short-term and retrospective data such as 12MO whose biases remain little known.
The sensitivity analysis methods are powerful tools for identifying the important input variables of a model, and therefore orientating the research efforts for data collection (Saltelli et al., Reference Saltelli, Chan and Scott2000; Faivre et al., Reference Faivre, Ioos, Mahévas, Makowski and Monod2013). The SRC method used in this article was very simple to implement. The high R 2-values estimated for the fitted linear models confirmed the strong linearity preliminarily observed between the input and output variables, as well as the pertinence of this method for this study. Complementary calculations (not detailed in the article) showed that the input variables’ contributions to the output variances were very close to those given by other sensitivity analysis methods, in particular the ANOVA factorial decomposition method (Faivre et al., Reference Faivre, Ioos, Mahévas, Makowski and Monod2013) and the extended FAST method (Saltelli et al., Reference Saltelli, Tarantola and KP-S1999). The most contributing variables to the RN variance were the calving rate, the natural mortality rate of adult females and the female proportion in the population (determined by the male offtake rate pattern). This is consistent with the results of a sensitivity analysis carried out on the recovery time of Sahelian cattle populations after a drought (Lesnoff et al., Reference Lesnoff, Corniaux and Hiernaux2012), except that the present article showed a higher importance of the adult female mortality. The most contributing variables for RW were the same as those for RN (which is consistent with the fact that RW is obtained from a weighting of RN), plus essentially the adult live weights and, to a lesser extent, the dressing-out rate. Better estimating the adult live weights of cattle in the African drylands would, therefore, be very beneficial for estimating meat productions. Finally, a general result for both RN and RW is that reducing the uncertainty on the mean calving rate (which lies probably between 0.40 calving/cow-year and 0.60 calving/cow-year) seems critical in the future as this variable also directly affects other important outputs such as milk production.
This article focused on the productivity rates RN and RW. The approach used for the uncertainty analysis could be extended to total productions, such as
 $Q=\bar{N}{\times}RN$
and
 $Q_{w} ={ \bar N}{\times}RW$
, considering the population size
 $$\bar{N}$$
as an additional input variable in the calculations. The difficulty is that no data are available for estimating the variance of the population size estimates. In practice, the administrative national data on animal numbers are essentially derived by the countries or FAO by applying hypothetical annual growth rates of each year. Applying this practice over long periods of time can lead to large biases (for instance, a census implemented in Niger in 2006 estimated a population size of N=7.8 millions of cattle, whereas the official data at this time was only of N=2.3 millions of heads; data have since been adjusted). The difficulty is that biases and uncertainty about animal numbers are actually unknown for most of the arid and semi-arid countries, due to the lack of regular national censuses. Although not fully quantifiable in this article, the variance of the population size estimate certainly has a large effect on the CIs of the production estimates. As an example, assuming for
 $$\bar{N}$$
a 95% CI of ±25% around the estimate, additional calculations not detailed here showed that the 95% CIs of the total productions Q and Q
w
would have corresponded to relative variations of ±40% and ±38%, respectively. A 95% CI of ±40% around the estimate would have corresponded to relative variations of ±50% and ±49%, respectively. Such CI ranges make difficult a reliable assessment of global indicators such as the contribution of livestock to GDP. This highlights the need for the SSA countries to better estimate their animal numbers and for the research community to help the countries to define sustainable census strategies for the long term. For instance, implementing one census per 10-year or 15-year period, at least in some pilot representative countries, would be a considerable progress.
For estimating total milk offtake, which is a major component of livestock production, the key input variable to be included in the uncertainty analysis is the mean milk offtake per lactation (calculated over all the lactating females, milked or not, of the population). As for many other herd performance variables, on-farm data on milk offtake are lacking. The data available in the literature essentially concern animal monitoring in research stations (Sidibé-Anago et al., Reference Sidibé-Anago, Ouedraogo and Ledin2008), which in general correspond to improved conditions. Furthermore, a difficulty is that milk offtake reported in the literature is often given per lactating cow and by presuming the cow is milked for each day of lactation. This is difficult to scale up (e.g. to herd or population level), as it does not account for the proportion of lactating females that are not milked (some lactating females can be dedicated to calf suckling only) nor that some milked females are not milked everyday (e.g. during periods of transhumances for which milk is not or poorly commercialized; Ezanno et al., Reference Ezanno, Ickowicz and Lancelot2005). For extensive systems of arid and semi-arid areas, such proportions of milking can decrease significantly the total milk offtake for the farm and finally for the population. For instance, estimates of mean lactation yields found in the literature for cattle in West African drylands varied from 323 to 674 l/lactation, whereas more realistic estimates of mean milk offtake (taking into account the proportions of milking) may vary around 120 to 150 l/lactation (C. Corniaux, Personal communication, and guess estimate of the author). Such overestimations would highly bias economic assessments of the livestock contribution to the household revenues and to the GDP. As for the other important variables, survey protocols based on herd monitoring may be implemented in the future for decreasing the actual uncertainties on the mean milk offtake per lactation in farms.
Acknowledgments
The author thanks two anonymous referees whose comments allowed improving significantly the first version of this article.