Over the past 120 years, the inflected future in Canadian French has been steadily giving way to the periphrastic future (PF), with the result that PF has now become the default for expressing the future across a wide range of linguistic contexts (Poplack, Reference Poplack, Bybee and Hopper2001; Poplack & Dion, Reference Poplack and Dion2009; Poplack & Turpin, Reference Poplack and Turpin1999). Whereas PF accounted for 56% of the 4691 instances of the future analyzed in the 19th-century Récits du français québécois d'autrefois corpus, it represented 73% of the 3594 tokens in the late 20th-century Ottawa-Hull corpus (Poplack & Turpin, Reference Poplack and Turpin1999:148).
Our goal in the current study is to explore the micro-trajectory of this very slow change in progress by tracking it across the lifespan of individual speakers, and in the process, to elucidate the relationship between age grading and apparent time. To this end, we selected the 60 speakers of the 1971 Sankoff-Cedergren corpus of Montréal French (Sankoff & Cedergren, Reference Sankoff and Cedergren1972; Sankoff & Sankoff, Reference Sankoff, Sankoff and Darnell1973) who were reinterviewed in 1984 (Thibault & Vincent, Reference Thibault and Vincent1990) and examined all of their relevant data from both years. In the terminology used in longitudinal research, these people constitute a panel. We occasionally refer to the entire group as panelists or panel members.
Previous sociolinguistic research on speakers across a substantial age range has revealed that age is a significant factor in conditioning the use of the inflected future (IF), with younger speakers being more advanced than their elders in preferring PF (Blondeau, Reference Blondeau2006; Emirkanian & Sankoff, Reference Emirkanian, Sankoff, Lemieux and Cedergren1985; Zimmer, Reference Zimmer1994). Under the hypothesis that people's grammars are stable after L1 acquisition in childhood, the most likely interpretation for such a pattern would be that successive cohorts of young people are continuing to find themselves in the vanguard of the change in the direction of the established historical trend. In another change in progress in this community, however, a sizeable minority of speakers continued to change in the direction of community change across their own lifespans as adults (the change from apical to posterior /r/, as documented in Blondeau, Sankoff, & Charity, Reference Blondeau, Sankoff and Charity2002; Sankoff & Blondeau, Reference Sankoff and Blondeau2007; Sankoff, Blondeau, & Charity, Reference Sankoff, Blondeau, Charity, van de Velde and van Hout2001). We undertook the current study to discover to what extent these two patterns—lifespan stability versus lifetime change toward the evolving community norm—were involved in the competition between IF and PF. As we will demonstrate, a third possibility that we had not envisaged proved to be involved: retrograde change across this 13-year interval in the lifespans of two-thirds of the speakers.
Considerable previous research on the competition between IF and PF in Canadian French has allowed us to build on the efforts of many other scholars. Some of the effects that condition the alternation are not reported on here, either because they are already well established, or because previous research has effectively ruled them out. Keeping the focus on the social matrix in which these speakers live, we will discuss both the socioeconomic differences that divide them and the linguistic effects that unite them as members of a vibrant speech community.
In the next section of the paper, we offer a brief overview of future temporal reference in French, with particular attention to Canadian French. We explain why, although present tense forms can also be used to express the future, we chose to concentrate on the IF/PF alternation. We also describe the nonfuturate uses of both IF and PF forms that we excluded from the analysis. Our goal here is to give a very explicit statement of the structural and semantic categories we considered as requiring exclusion from our database in order to provide a basis for comparison with previous research and to make our work replicable in future studies. We conclude with a presentation of the envelope of variation we define for the IF/PF alternation. We then present the sample of 60 speakers whose use of IF and PF we studied and explain how we looked at speaker differences over time in examining our central question of the relationship between age grading and language change. We also describe our analytical methods including our coding procedures. We report the results of our analysis, attending both to what changed and what remained the same, across the 13-year window we have on the lifetime trajectories of these speakers. Finally, we discuss the wider implications of this study and offer some suggestions for future research.
FUTURE TEMPORAL REFERENCE
The scope of this study encompasses variation in the forms used to express future temporal reference, rather than examining the wide range of functions that can be expressed by morphologically future forms. However, as Fleischman (Reference Fleischman1982:84) observed, “reference to the future is rarely, if ever, a simple matter of marking an event as subsequent to the moment of speech.” Further, the three major forms used in reference to the future are also used to express other tenses, as well as a gamut of modalities. The lack of a simple form/function isomorphism in this sector of French grammar, noted by grammarians as early as the 17th century, has been amplified in the extensive writings of linguists since the mid-20th century (e.g., Blanche-Benveniste, Bilger, Rouget & van den Eynde, Reference Blanche-Benveniste, Bilger, Rouget and van den Eynde1990; J.-C. Chevalier, Blanche-Benveniste, Arrivé, & Peytard, Reference Chevalier, Blanche-Benveniste, Arrivé and Peytard1971; Fleischman, Reference Fleischman1982; Helland, Reference Helland1995; Jeanjean, Reference Jeanjean, Blanche-Benveniste, Chervel and Gross1988, Jones, Reference Jones1996; Laurendeau, Reference Laurendeau2000; Lesage, Reference Lesage1991; Sundell, Reference Sundell1991).
The future always represents an irrealis modality, because it can never have happened, or even be happening, at the time of speaking. Citing the copious literature on the subject, a recent review notes that multiple readings (including proximity, remoteness, certainty, intention) have been assigned to all of the forms,Footnote 1 observing that: “The temporal category of future is traditionally associated with a variety of irrealis or nonfactive modalities” (Poplack & Dion, Reference Poplack and Dion2009:569).
Predications that reference the future are thus a subset of irrealis predications, and our first task was to isolate the tokens properly belonging to this subset. Poplack and Dion's description of their quantitative methodology states that “every predication making unambiguous reference to future time was extracted” (2009:570). This turned out to be no easy job. We explain in detail, in the next section, how we established our criteria for exclusion of tokens. First, however, it is important to present our reasons for excluding present tense forms from our quantitative analysis.
That both inflected and periphrastic forms are used in the expression of future temporal reference is well known from previous research on Canadian French (Blondeau, Reference Blondeau2006; Deshaies & Laforge, Reference Deshaies and LaForge1981; Emirkanian & D. Sankoff, 1985; Grimm, Reference Grimm2010; King & Nadasdi, Reference King and Nadasdi2003; Poplack, Reference Poplack, Bybee and Hopper2001; Poplack & Dion, Reference Poplack and Dion2009; Poplack & Turpin, Reference Poplack and Turpin1999; Zimmer, Reference Zimmer1994). Even though inflected forms have been slowly but steadily losing ground in the spoken language, corpus-based studies of spontaneous speech have been able to cite many contexts in which speakers still alternate freely between the two, as exemplified in (1).
(1) Elle vapeut-être arriverbien vite—on lui demandera.
periphrastic inflected
[Christine Q., 4, 1971, 134]Footnote 2
‘Maybe she'll get here pretty soon—we'll ask her.’
Although it is clear that IF and PF are the major competitors for expressing the future in contemporary French, it is also true that the present tense is sometimes used. In an example cited by Blondeau (Reference Blondeau2006:74) from the 1995 Montréal corpus (Vincent, Laforest, & Martel, Reference Vincent, Laforest and Martel1995), there can be no doubt that on commence references the future.
(2) Parfait, alors tu vas l'avoir. Alors on commencejeudi prochain.
[Charles P., 117, 1995, 900]
‘Perfect, so you'll get it. So we'll start next Thursday.’
In deciding against including the present tense as a variant of our dependent variable in the quantitative analysis, we followed King and Nadasdi (Reference King and Nadasdi2003) and Blondeau (Reference Blondeau2006), and for much the same set of reasons. To be certain that any given present tense form actually expresses the future, studies that included present tense as a variant have avoided the potential ambiguity of present tense forms by relying on co-occurrence with temporal expressions (mainly adverbs or adverbial phrases such as jeudi prochain in (2)).Footnote 3 As Blondeau (Reference Blondeau2006:74) put it:
Nous avons noté dans nos propres données que la forme verbale du présent ne véhicule jamais à elle seule la réference temporelle au futur. En effet, elle doit toujours être associée à un autre element . . . pour qu'un sens de postériorité puisse s'en dégager.
‘We have noted in our own data that a present tense form never serves on its own as a future temporal reference. In effect, it must always be associated with another element . . . in order that a sense of posteriority may be interpreted from it.’
Further, the present is very much a marginal form in future contexts, accounting for less than 10% of the tokens in studies that have reported on its frequency (Poplack & Dion, Reference Poplack and Dion2009; Poplack & Turpin, Reference Poplack and Turpin1999). Lastly, and most importantly given our focus on change, in Canadian French, “the minority variant P[resent] remains unchanged, in terms of both rate and conditioning” (Poplack & Dion, Reference Poplack and Dion2009:572n9) over the 119-year period they document. They report a frequency of 9% in the 19th-century Recits du français québécois d'autrefois corpus (N = 4691) and of 7% in the late 20th-century Ottawa-Hull corpus (N = 3594)Footnote 4 (Poplack & Dion, Reference Poplack and Dion2009:572).
Circumscribing the variable context: Exclusions
Because the competition between IF and PF in the expression of the future was our principal concern, tokens were excluded from the dataset if they did not unambiguously refer to future time, but instead represented instances of modal or aspectual usage of futurate forms.
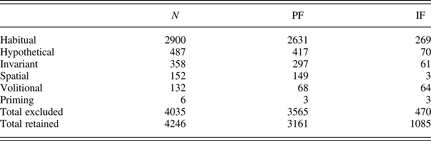
As in previous studies (Blondeau, Reference Blondeau2006; King & Nadasdi, Reference King and Nadasdi2003; Poplack & Turpin, Reference Poplack and Turpin1999), those occurrences that encoded characteristic or habitual actions constituted by far the largest number of exclusions (n = 2900).Footnote 5 Habituals, many of which were easily identifiable because of co-occurrence with adverbials such as souvent ‘often’ or (de) temps en temps ‘sometimes’, were particularly frequent in the 1984 corpus, which included a series of questions about tastes and customs. In example (3), from an exchange about food preferences, the habitual is established in (3e) and (3h), in the present tense. The periphrastic on va se faire in (3f) clearly continues the description of habitual actions and was thus excluded from the study.
(3) Q: Comme quoi par exemple là?
‘Like what, for example?’
R: a. Du poivre, du sel, des épices, du steak.
Pepper, salt, spices, steak.
b. Je te le dis je suis bien ordinaire.
I tell you I'm just an ordinary guy.
c. Je mange . . . rien de— de sauté . .
I don't eat anything sautéd . . .
d. ‘Temps en temps
From time to time
e. on se prendpour un autre,
we treat ourselves as special
f. on va se faireun petit filet mignon
we'll make ourselves a little filet mignon
g. avec une tranche de bacon alentour.
with a piece of bacon around it.
h. Ça nous fait plaisirtu sais.
We enjoy that y'know.
[Paul G., 2, 1984, 3851]
Although habitual actions, as in (3), were overwhelmingly expressed using PF, IF appeared in 269 cases representing 9% of the total of 2900 habituals. One such case is (4):
(4) Ce sont les trois canaux que je regarde le plus souvent. Je regarderaibien un autre canal à l'occasion quand j'auraivraiment des loisirs et puis que je suis pas satisfait de mes canaux habituels, mais ordinairement c'est un des trois.
[Armand M., 115, 1984, 584]
‘Those are the three channels that I watch most often. I'll watch another channel sometimes when I really have [literally, I'll really have] free time and if I'm not happy with my usual channels, but ordinarily it's one of those three.’
The next largest set of examples we excluded consists of sentences in which the futurate form, whether IF or PF, refers not to a future time but to a timeless truth or a hypothetical possibility (n = 487). As far as timeless truths are concerned, to our knowledge, only one previous study of French has dealt with this category explicitly (Emirkanian & Sankoff, Reference Emirkanian, Sankoff, Lemieux and Cedergren1985), and the authors included them in their analysis. We illustrate here with a number of examples in order to explain our reasons for excluding them.Footnote 6 In French, as in English, future tense forms may be used to express general truths or tendencies (e.g., boys will be boys). They can be defined as nontemporal, because they are assumed to hold at all times. Fleischman (Reference Fleischman1982:132), following Greenberg (Reference Greenberg1978:87), referred to them as “gnomic” futures. Gnomic sentences are most frequently formulated in the present tense in English (Cacoullos & Walker, Reference Cacoullos and Walker2009:327). In our French data, however, we were surprised by the large number of gnomic futures we encountered. Emirkanian and Sankoff defined them as expressing “a conjectural tone” (1985:193). Examples they cited, as in (5), invoke situations that the speaker believes to be generally true.
(5) Un gars qui va travaillerà dix-sept ans faire soixante piastres […] il va falloirqu'il reste en chambre.
[Armand H., 62, 1971, 868], example (12a) in Emirkanian & Sankoff (Reference Emirkanian, Sankoff, Lemieux and Cedergren1985:193)]
‘A guy who goes to work at the age of seventeen to make sixty bucks . . . he's going to have to live in a rooming house.’
To Le Bidois and Le Bidois (Reference Le Bidois and Le Bidois1967:453), these cases imply a preceding Vous verrez que . . . ‘You will see that . . .’. Indeed, many of the cases that we identify as gnomic are explicitly introduced by prends ‘take [for example]’, or mettons/disons ‘let's say . . .’, as in (6).
(6) [D]isons une personne de la Gaspésie qui parle joual va comprendrequelqu'un de l'Abitibi qui parle joual mais pas tout tout le vocabulaire.
[Hélène R., 112, 1971, 1078]
‘Let's say, a person from Gaspésie who speaksjoualwill understand someone from Abitibi who speaks joual, but not absolutely all of the vocabulary.’
The absence of comment on gnomics in other studies of future temporal reference is perhaps due to their explicit inclusion with habituals (e.g., Poplack & Malvar, Reference Poplack and Malvar2007:135, on Portuguese). Cases such as (7) could be considered to express either a habitual modality or to be implicit conditionals, a category we included on a scale of contingency.
(7) Tu peux te tromper puis, il y aurapas de danger, personne va se faire tuer. Tandis que ma job bien— Si je fais une erreur, elle peut coûter la vie de bien des gens.
[Roland M., 83, 1984, 192]
‘You can make a mistake [doing your job] and there is usually no danger, usually no-one gets themselves killed. Whereas in my job, well, if I make a mistake, it can cost the lives of lots of people.’
Habitual interpretation: ‘there'll usually be no danger, usually no-one'll be killed’
Conditional interpretation: ‘IF you make a mistake, there'll be no danger’
The corpus under study here may have been especially favorable to gnomics because of the inclusion in both the 1971 and 1984 interviews of many questions inviting speculation. For example, interviewees were asked questions about language, such as whether they thought people in different parts of Montréal spoke differently from one another, and whether they thought Montréalers were judged by the way they spoke. In (8), an interviewee invokes what he believes to be general truths about swearing, using future tense forms to do so. He finishes with a conditional form, which is enclosed in angled brackets.
(8) Le garagiste lui va, va être porté à sacrer.“Hostie de câlice. Le maudit différentiel il marche pas.” OK. Le gars qui va être dans son bureau il sacrera pas. Il va avoir fait'une petite touche il va avoirmanqué sa lettre. Il va sortirson Liquid-Paper. Il va corrigersa lettre. Puis là sur son Liquid-Paper il va refairesa lettre. Right? Il aura pasbesoin de sacrer. Il a son Liquid-Paper là. Si le gars il pète le différentiel ça lui coûte quatre cents piastres. Exemple tu-sais. Lui <il aurait> raison de sacrer.
[Yannick C., 126, 1984, 2489]
‘The garage mechanic will tend to swear. “Jesus Christ. The damn differential's not working.” OK. The guy who'll be in his office, he won't swear. Let's say he's made a little mistake, he's made a typo. (lit. He'll have made a little mistake, he'll have made a typo). He'll get out his Liquid Paper. He'll correct the typo. Then he'll retype on the Liquid Paper. Right? He won't need to swear. He has his Liquid Paper. If the [other] guy busts up the differential, that costs him four hundred dollars. An example, you know. Him, <he would have> reason to swear.’
The response includes several typical attributes of gnomics in our corpus, such as co-occurrence with the conditional; a description of hypothetical exemplars (un garagiste, le gars qui va être dans son bureau); and the specific mention that the case is an “exemple,” underlining the universal yet hypothetical nature of the description. Other phrases that occur in gnomic future discourse include the previously mentioned prends, mettons, and disons, ‘let's say . . .’ (see (6)) and ce genre de ‘that kind of’.
Finally, a large proportion of the tokens in the gnomics category appeared in contingent contexts, such as the apodosis of si clauses, as in (9), or in clauses where the si does not appear explicitly but is implied, as in (10). Unlike the contingent contexts in which a probable future event hinges on some condition, which we included in our analysis, these cases refer to hypothetical situations without a specific temporal reference. In the following examples, therefore, the English translation gives both the direct gloss in the future tense, and an alternative idiomatic translation in the English conditional.
(9) S'il y a pas de religion personne va se respecter. Tu vas vouloir aller coucheravec la femme d'en face.
[Donat M., 90, 1971, 472]
‘If there's no religion, no-one will/would respect each other. You'll/’d want to go sleep with the woman across the street.'
(10) Tu es patron ici mettons au Québec là puis un de tes gros clients est en Ontario puis il parle seulement anglais. Quelle langue tu vas parler?
[Rita C., 52, 1971, 1424]
‘You're the boss, let's say, here in Québec and one of your big clients is in Ontario and he only speaks English. What language are you going to/would you speak?’
Contrast these cases with si clauses in which the future tense form refers to a time in the future (11), and which were retained for analysis.
(11) Si dans dix ans là la pollution est pas contrôlée là, on va mourirde ça.
[Louise C., 8, 1971, 851]
‘If in ten years pollution isn't controlled, we'll die of it.”
In summary, because gnomic uses of the future tense have no temporal referents, we excluded them from the current study. Given the timeless character of the events in (5) to (10) and cases like them, we considered that this gnomic character overrrides the habitual and conditional modalities that may be involved. This is in contrast to Emirkanian and D. Sankoff, who included them in their analysis, finding that they overwhelmingly favored PF (1985:194–197). In our corpus, gnomics/hypotheticals in the affirmative (n = 403) favored PF at a rate of 96% (406 of 421).Footnote 7
A further type of exclusion involved the use of [aller + infinitive] as expressing movement (the literal meaning of aller) rather than futurity per se (n = 152). Thus cases like (12) were also set aside.
(12) On fait comme les grands-parents, on va les voirpuis on s'amuse avec.
[Joseph R., 75, 1984, 863]
‘We act like grandparents, we go see them and we have fun with them.’
Very rarely is motion expressed using IF. Example (13) is one of only two such cases we encountered.
(13) Un jour j'irai suivreun cours d'anglais. Un jour j'aimerais parler bien anglais. Je parle pas bien.
[Germain T., 88, 1984, 734]
‘One day I'll go and take an English course. One day I'd like to be able to speak English well. I don't speak [it] well.’
Occurrences of the verb s'en aller + infinitive ‘go off, go away’ were also excluded, as they appeared exclusively in habitual and motion contexts, or sometimes both, as in (14).
(14) Lorsque tu te lèves le matin, tu t'en vas travaillerpuis tu es pas heureux.
[Germain T., 88, 1984, 261]
‘When you get up in the morning, you go off to work and you're not happy.’
Other nontemporal occurrences excluded from the dataset were volitional usages (Fleischman, Reference Fleischman1982:129), such as imperatives or pseudo-imperatives as in (15) and (16).Footnote 8 In (15), another mother being interviewed turns to say to her son:
(15) Tu vas aller t'habillerpuis tu vas sortiravec moi.
[Christine Q., 4, 1984, 178]
‘You'll go get dressed/Go get dressed, then you're going out with me.’
In (16), the speaker quotes herself as standing up to the priests in her parish:
(16) “[J]'ai connu assez de pères dans la paroisse” j'ai dit “ vous viendrez pas me direque vous êtes pauvre.”
[Henriette N., 15, 1971, 687]
‘“I've known plenty of priests in the parish,” I said. “Don't come telling me that you're poor.”‘
Invitations, as in (17), where an interviewee invites the interviewer to drop by again, and suggestions, as in (18), were also considered to be in the volitional category (n = 132).
(17) Il m'a dit “Bien reposez-vous bien, quand vous serezmoins fatiguée vous viendrez.”
[Éléanore L., 79, 1948, 133]
‘He said to me, “Have a good rest, when you're less tired, you'll come.”
(“Have a good rest, and come when you're feeling less tired”)
(18) Si vous êtes encore dans le bout, vous viendrez prendreune tasse de café.
[Micheline B., 67, 1971, 1584]
‘If you're still in the area, you'll come and have a coffee.’
(“If you're still in the area, you must come and have a coffee”)
Though imperatives and pseudo-imperatives have not been discussed in the previous sociolinguistic literature, it appears that some analysts have retained such cases in their quantitative analyses. Parallel to (18), also apparently in a polite farewell at the end of an interview, is (19), cited by Poplack and Dion (Reference Poplack and Dion2009:573) as an example of formal address with vous, and clearly included in their study.
(19) Ça m'a faite bien plaisir, en tous les cas. Vous reviendrez.
(OH.119.3142)
‘It was my pleasure, in any case. You’ll have to (lit. you will) come back.'
Consistent with best practice in the analysis of spontaneous speech, we also excluded the few instances of possible priming by the interviewer that we observed (n = 6) as in (20).
(20) Interviewer: Puis il les élèvera.
‘And he will raise them.’
Respondent: Oui il les élèvera.
‘Yes, he will raise them.’
[Christine Q., 4, 1984, 808]
Lastly, genuinely futurate but invariant or frozen forms (n = 360) were also excluded, whether categorically IF in expressions such as advienne que pourra (‘come what may’) and qu'en dira-t-on (‘what can one say’) or categorically PF as with ça va faire (‘it'll be’ with expressions of temporal duration as in (21)).
(21) Ça va fairedix-sept ans que je demeure à Repentigny.
[Martine N., 1, 7, 166]
‘It'll be sixteen years that I've lived in Repentigny.’
A summary table of our exclusions, with a complete list of frozen forms (adapted from previous studies and modified according to the cases in this particular dataset) is given in the Appendix.
Negation
After setting aside the excluded cases detailed in the previous section, 4246 tokens (from 1971 and 1984) were retained for quantitative analysis. Of these, IF accounted for 1085, or 25.6%, a figure very close to the 22% percent of IF found in the Ottawa-Hull corpus,Footnote 9 though it should be noted that our corpus also differed from theirs in one further feature: our inclusion of 393 tokens of m'as (an example of which appears in (A1) in the Appendix) as a variant form of je vais/vas. Poplack and Dion excluded this variant on the grounds that it exists only in the first person; however, we followed Mougeon et al. (Reference Mougeon, Edouard, André and Ferrara1988) and Mougeon et al. (Reference Mougeon, Nadasdi, Rehner, Baronian and Martineau2009) in including this IF variant, as further explained in Sankoff and Thibault (Reference Sankoff, Thibault, Martineau and Nadasdi2011).
In circumscribing the envelope of variation, there was one linguistic constraint that required attention: the polarity constraint first clearly demonstrated in the quantitative analysis of Emirkanian and D. Sankoff (1985). Although prescriptive grammars are silent on this factor, the presence of a negative marker has been identified as the strongest predictor of IF selection in every quantitative study of Québécois and Ontarian French to date.Footnote 10 Working on the Montréal corpora from various periods, it is not suprising that analyses of the 1971 data (Emirkanian & D. Sankoff, 1985), the 1984 data (Zimmer, Reference Zimmer1994), and the panel of individual studies across the three periods of 1971 to 1995 (Blondeau, Reference Blondeau2006) yielded very similar results: an almost total absence of PF in negative contexts. This was also true of Québec City (Deshaies & Laforge, Reference Deshaies and LaForge1981) and Poplack's corpus of Ottawa French, which revealed only 15 cases of PF in the negative (of a total of 471 negative tokens), a frequency of 3.2% (Poplack & Dion, Reference Poplack and Dion2009:573). By contrast, in the smaller Ontario city of Hawkesbury (like Ottawa, only a 5-minute trip across the Ottawa River from Québec), Grimm (Reference Grimm2010:88) reported an unusually high percentage (26%) of negative PF as a recent change.
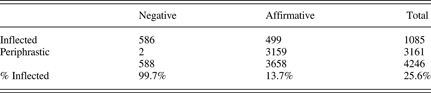
We coded our own data for all markers of negative polarity, such as pas, jamais, plus, and personne. Table 1 indicates that IF was virtually categorical (99.7%) in negative polarity environments for the panel speakers.
The influence of polarity on the IF/PF alternation, entire dataset
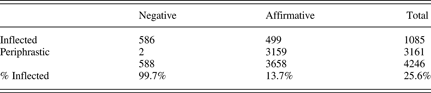
There were only 2 instances of PF among the 588 negative tokens. Both involve false starts, hesitations, and reformulations by the speakers, as in (22).
(22) En espérant toujours que le chômage me— vont pas me— <oui> tu-sais me— me couperou m'offrir des— des— des jobs que j'aurais pas le goût de faire.
[Manon R., 34, 1984, 278]
‘Still hoping that the welfare won't— won't <yes> y'know won't— won't— cut me off or offer me any— any— any jobs that I wouldn't want to do.’
In this example, the speaker hesitates a great deal, beginning the verb phrase with the object clitic me (which she would have done if she had started out to use IF). Instead she replaces this with the PF vont and then searches for the infinitive to select, hesitating three times on a repeat of me, during which sequence, the interviewer prompts with “yes,” before finally selecting couper ‘cut off’ and conjoining offrir ‘offer’. There are 13 other negative tokens produced by speaker #34 in the corpus, all fluently articulated and all with IF.
In the second example, speaking about a potential change in the Québec language legislation, the speaker begins as if he were going to use a verb in the affirmative (as if the thought were “I hope it's going to continue”), but then expresses the idea in the negative (“it's not going to be relaxed”).
(23) Puis j'espère que ça va— ça va pas lâchertout-'-suite
[Jacques L., 91, 1971, 711]
‘And I hope that it's going— it's not going to be relaxed right away.’
Examples of invariant IF with negation are readily provided with the major negators pas, jamais, rien, and plus as illustrated in (24) to (27) (cf. also example (1)).
(24) Il y a bien du monde qui disait “Ils iront pasdans un salon mortuaire, ils vont resterchez nous”
[Édith G., 44, 1971, 588]
‘There are lots of people who used to say, “They won't be put in [lit. won't go into] a funeral parlor, they'll stay at home”.’
Note in all of these examples the absence of ne, which is almost categorical in contemporary Québécois French (Sankoff & Vincent, Reference Sankoff and Vincent1977).
(25) J'espère qu'eux-autres ils seront jamais gênésde dire “Ça c'est mon père.”
[Paul G., 2, 1984, 1946]
‘I hope that they'll never be embarrassed to say, “That's my father.”’
(26) Puis elle disait “Tant que vous allez parler, on fera rien”.
[Gilberte C., 77, 1984, 1928]
‘And she said, “As long as you're talking, we won't do anything.”’
(27) C'est trop tard, on le reprendra plusmaintenant.
[Jacques G., 76, 1984, 1914]
‘It's too late, we'll never catch up [with Toronto] now.’
Given that negative contexts categorically select the IF, our quantitative analysis of the IF/PF alternation in expressing the future is restricted to the 3658 tokens from affirmative contexts.Footnote 11
Coding of independent variables: Linguistic factors
In considering linguistic contexts beyond polarity that might be of importance in conditioning the IF/PF alternation, we were guided by the careful work of previous scholars in the quantitative analysis of the future in Québec and Ontario French (Blondeau, Reference Blondeau2006; Deshaies & Laforge, Reference Deshaies and LaForge1981; Emirkanian & Sankoff, Reference Emirkanian, Sankoff, Lemieux and Cedergren1985; Poplack, Reference Poplack, Bybee and Hopper2001; Poplack & Dion, Reference Poplack and Dion2009; Poplack & Turpin, Reference Poplack and Turpin1999). Of the linguistic factors discussed in earlier research, we retained only those for which we felt that our data might shed light on an unresolved issue, and thus did not examine four linguistic factors investigated by previous researchers: temporal distance, adverbial specification, imminence, and lexical frequency effects.
Temporal distance refers to the time that is to elapse between the moment of speech and the event that is to take place in the future. Prescriptive grammars (e.g., Grevisse, Reference Grevisse1993) have traditionally associated PF with proximal events (though see Poplack & Dion, Reference Poplack and Dion2009, on the surprising lack of consensus on this point since 1950), and indeed refer to it as the futur proche ‘near future’. Grammarians have also to some extent associated IF with either distal or neutral events (Poplack & Dion, Reference Poplack and Dion2009:574). However, Acadian French is to date the only French variety in which this semantic distribution has been demonstrated by quantitative analysis (King & Nadasdi, Reference King and Nadasdi2003:333). Temporal distance was their strongest predictor of variant choice, with PF selected in 75% of the cases referring to proximal time. Because in multivariate analyses of the French of Ottawa (Poplack & Turpin, Reference Poplack and Turpin1999) and Montréal (Blondeau, Reference Blondeau2006), temporal distance was clearly shown not to be a strong constraint on variant choice, this factor was not included in the present study.
Imminence refers to a distinction between an impending and a nonimpending event (Vet, Reference Vet1993). It was included as a factor in only two studies: Poplack and Turpin (Reference Poplack and Turpin1999) and King and Nadasdi (Reference King and Nadasdi2003). Although the latter found a strong tendency for impending events to be expressed with PF, they noted that this factor was especially difficult to operationalize and to code reliably (2003:330). In addition, their analysis is of Acadian French, which differs greatly from the variety spoken in Montréal. The more comparable variety spoken in Ottawa, however, displayed no significant effect of imminence in Poplack and Turpin's study (1999:153) and was accordingly excluded from the present investigation. It is entirely possible that in varieties in which IF is more robustly represented than it is in the contemporary French of Québec and Ontario, PF has been associated with temporal distance and/or imminence, but that this association has been lost as PF has become the default form in affirmative contexts.
The third linguistic factor that we did not include was adverbial specification. Adverbial specification refers to the co-occurrence of a future tense form with a temporal adverbial phrase. This was not selected as a significant constraint in the multivariate analyses conducted by Blondeau (Reference Blondeau2006) and by King and Nadasdi (Reference King and Nadasdi2003). The question of adverbial specification has been explored in the greatest depth by Poplack and her colleagues. Although the earliest quantitative study (Emirkanian & Sankoff, Reference Emirkanian, Sankoff, Lemieux and Cedergren1985) distinguished only between the presence of adverbial specification and the lack thereof (finding that IF was promoted in the presence of adverbial specification), Poplack and Turpin distinguished between “specific” (e.g., ce soir ‘this evening’, dans une semaine ‘in a week’) and “nonspecific” (e.g., tôt ou tard ‘sooner or later’, un jour ‘one day’) adverbials. Their results indicated that: “IF is promoted in the context of a non-specific adverbial” (1999:151). However, in a recent study of both their 19th- and 20th-century corpora, Poplack and Dion (Reference Poplack and Dion2009) do not discuss adverbial specification per se, describing the promotion of the inflected future in the presence of an adverb as a “minor trend” in their 19th- and 20th-century corpora of Canadian French. They go on to state that: “the presence of an adverbial phrase contributes only a small probability (.59) to the choice of [IF], an effect which, already modest in the 19th century (with a range of 17), has further weakened by the 20th” (2009:573).
In summary, previous research has revealed that the effect of adverbials is unclear, in terms not only of the explanation of such an effect, but even of its existence.Footnote 12 Given these facts, we decided not to examine this essentially semantic factor in the present analysis.
Finally, we excluded lexical frequency from consideration, basing this decision on the study of the Ottawa-Hull corpus, which indicated that use of the inflected future “is indifferent to token frequency, lexical identity, lexical strength, conjugation class or any other property relating to the verb” (Poplack, Reference Poplack, Bybee and Hopper2001:418).
In addition to Polarity (which served to exclude negative contexts from our quantitative analysis), we coded three further linguistic categories as independent variables in our analysis: Contingency, Grammatical Person, and Address Pronoun.
Contingency
It has been suggested (e.g., Deshaies & Laforge, Reference Deshaies and LaForge1981) that IF is associated with less certain future eventualities, whereas PF is associated with greater certainty. Poplack and Turpin (Reference Poplack and Turpin1999) operationalized the notion of contingency, opposing contingent and assumed future events: a distinction adopted by King and Nadasdi (Reference King and Nadasdi2003) and elaborated on by Blondeau (Reference Blondeau2006). We found Blondeau's coding categories to be the most useful and have adopted them with only minor alterations. Each clause containing a token of IF or PF was coded for one of five values in the Contingency factor group:
1. Contingent: Apodosisof si. Apodosis of a si ‘if’ clause, as in (28):
(28) Sijamais elle veut quitter l'école bien on en reparlerapuis on verra.
[Charles P., 117, 8, 496]
‘If ever she wants to quit school, well, we'll talk about it again and we'll see.’
2. Contingent: Quand/Temporal Adverbial + Tokenin Subordinate Clause: A second type of contingency was determined by the location of a token in a subordinate clause containing quand (que) ‘when’ or related temporal subordinating adverbial such as lorsque/mais que ‘when’, aussitôt que ‘as soon as’, le jour où ‘the day when’, and au moment que ‘the moment when’, as in (29)
(29) Peut-être que quand je vas être— vieille vieille vieille, je vas recommencer.
[Diane R., 66, 84, 1914]
‘Perhaps when I will be (“I'm”)— old old old, I'll start again.’
3. Contingent: Quand/Temporal Adverbial + Tokenin Main Clause: Tokens located in the matrix clause of a sentence containing quand or similar adverbial phrase, as in (30), constituted a third contingency type.
(30) Mais que je meure, j'auraipas treize landaux de fleurs certain en arrière de moi.
[Paul G., 2, 7, 1218]
‘When I die, I certainly won't have thirteen carriages of flowers following behind me (“in my funeral cortege”).’
4. Contingent: Other. The fourth contingency type was indicated by some other marker, as in (31), such as peut-être (que) ‘perhaps’, on sait pas/je sais pas ‘one doesn't know/I don't know’, je crois pas ‘I don't believe’, je suis pas certain que ‘I'm not certain that’, il paraît que ‘it appears that’, tant que ‘as much as’.
(31) Je suis pas sûre qu'au niv— financièrement, ça va êtreavantageux pour moi.
[Manon R., 34, 8, 99]
‘I'm not sure that at the lev— financially, that will be advantageous for me.’
5. Independent, Noncontingent. Lastly, a noncontingent eventuality was phrased by the speaker as certain to occur, as in (32) and (33):
(32) Une chose est sûre. Je vais sûrement surveillerses études de plus près que moi j'ai été surveillé.
[Germain T., 88, 8, 464]
‘One thing is sure. I will definitely supervise his studies more closely than I was supervised myself.’
(33) Je vous appellerezà trois heures du matin.
[Micheline B. 67, 8, 926]
‘I will call you at three o'clock in the morning.’
Grammatical person
It has been suggested by some commentators (e.g., Blanche-Benveniste et al., Reference Blanche-Benveniste, Bilger, Rouget and van den Eynde1990; Jeanjean, Reference Jeanjean, Blanche-Benveniste, Chervel and Gross1988) that PF is associated with first person subjects. Researchers of Canadian French have found no such association with the first person, and indeed in King and Nadasdi's (2003) study, there was no effect of grammatical person in their data at all. By contrast, the studies of 20th-century and 19th-century Ottawa French (Poplack & Dion, Reference Poplack and Dion2009; Poplack & Turpin, Reference Poplack and Turpin1999) uncovered an association between vouvoiement (the use of the second person pronoun vous to a singular addressee) and the use of IF, as in Poplack and Turpin's (1999:154) example (21), given here as (34).Footnote 13
(34) Il dit, “Monsieur Rémillard, on est douze, vous passerezpas.”
‘He says, “Mr. Rémillard, there are 12 of us. You won't get by.” (082/196)
The favoring effect of vouvoiement on IF selection is shown by Poplack and Dion (Reference Poplack and Dion2009:574) to have more than doubled over a century. They remarked that it is unsurprising to find IF use increasing in formal contexts even as it declines in overall frequency. They pointed out that precedents for this pattern can be found in the behavior of other disappearing features, such as ne (Sankoff & Vincent, Reference Sankoff and Vincent1977, Reference Sankoff, Vincent and Sankoff1980; Poplack & St. Amand, Reference Poplack and St. Amand2007), as we have already noted. Therefore, we coded not only for all number and persons of the verb, but also for all subject types, including singular and plural noun phrases, subjects in –autres (e.g., eux-autres ‘those others’) and formal use of the second person pronoun vous.
Address pronoun
Bearing in mind the findings of Poplack and colleagues that IF is associated with formal vous, we looked for other reliable ways of coding for a range of formal and informal speech styles. There are few questions more vexed than the analysis of speech style in sociolinguistics, however. Locating external criteria having to do with genre, topic, speech situation, or relationships between interlocutors has been one way of doing this. So, for example, in a study of the use of the innovative English progressive in the 18th- and 19th-century personal correspondence of a set of literary figures, Arnaud (Reference Arnaud1998) found that progressives were more frequent in letters to friends than in letters to business associates, and that letters to lovers and close family members had a still higher frequency. In the 1971 Montréal French corpus, the very rare ne is more likely to occur with the topics of religion and education than with other topics (Sankoff & Vincent, Reference Sankoff and Vincent1977). For the analysis of sociolinguistic interviews that have as a goal the elicitation of the vernacular, Labov (Reference Labov, Eckert and Rickford2001) proposed four contextual factors in a decision-tree grid. He found that vernacular forms are found most prominently when any of four contextual factors obtain: narratives of personal experience; the topic of childhood games; speech to interlocutors other than the interviewer; and “tangents” in which the interviewee departs from the question asked by the interviewer. Unfortunately, the future almost never occurs in narratives and children's games, which always evoke the past in our interviews, and tangents and speech to others are quite infrequent. Another strategy has been to find other elements in the speech stream that co-occur with the dependent variable as indications that a particular piece of conversation has been constructed in, for example, a formal style (Ervin-Tripp, Reference Ervin-Tripp, Gumperz and Hymes1972). This may be a promising avenue for future research on the IF/PF alternation, but we were not able to operationalize it in the current analysis.
With respect to the IF/PF alternation, Lesage and Gagnon (Reference Lesage and Gagnon1993) reported a dramatic difference between written and spoken Canadian French, reflecting the more conservative nature of the written genre. In a study of four daily Québécois newspapers, 96.6% of occurrences of future temporal reference were expressed in IF, and only 3.4% in PF. Reporting on European French, Wales (Reference Wales2002) also found IF to be much more frequent than PF in writing.
We extended the coding for vouvoiement by coding for pronouns of address used by the individual speakers to their interviewers, as reported by Pierrette Thibault (personal communication). Speakers were assigned one of four values: vouvoiement; tutoiement (uses informal second person pronoun tu); uses vous and tu interchangeably to address the interviewer; and does not use address pronouns. However, there was considerable interaction between age of speaker (described in a later section on structure of the speaker sample) and pronoun of address. Older speakers in the panel were found to exclusively use vous to address their (younger) interviewers, whereas younger speakers (often close age-mates of the interviewers) almost exclusively used tu. Furthermore, because choice of address pronoun was constant throughout 109 of the 118 interviews (as explained in the sample description later in this paper, one speaker had to be excluded for lack of data), stylistic variation internal to the interview and its dynamics could not be captured by a factor that assigned only one value per interview.
As such, pronouns of address did not provide a useful indicator of formality in our study, and we do not report on them in the quantitative analysis.
STRUCTURE OF THE SPEAKER SAMPLE
The central goal of this paper, as explained in the introduction, was to examine change across the lifespan. We were fortunate in having recordings and transcriptions of sixty Montreal Francophones from two successive periods, 1971 and 1984, available to us for this analysis. In this section, we describe not only how the sample was initially structured, but also how we employed it in researching lifespan change.
The 1971 sociolinguistic survey of Montreal French designed by Gillian Sankoff, David Sankoff, and Henrietta Cedergren used a random stratified sampling method to arrive at a sample of 120 speakers. To obtain a good representation of speakers across the socioeconomic spectrum, the sampling procedure selected 20 addresses at random from each of 6 clusters of census tracts based on mean family income as established in the previous census. Cross-cutting these divisions, the sampling grid aimed at four age groups, each containing 15 male and 15 female speakers: ages 15–19, 20–34, 35–54, and 55 years and older. Further details about the sampling, methods, and data transcription and coding can be found in Sankoff and Cedergren (Reference Sankoff and Cedergren1972), Sankoff and Sankoff (Reference Sankoff, Sankoff and Darnell1973), and Thibault and Vincent (Reference Thibault and Vincent1990).
The follow-up study in 1984 (Thibault & Vincent, Reference Thibault and Vincent1990) added a new group of 12 younger speakers ages 15–25 years (2 male and 2 female speakers in each of three socioeconomic groups), and relocated 60 of the original speakers who consented to be reinterviewed. It is 59 of this latter group of 60 speakers, recorded in both 1971 and 1984, whose use of periphrastic and inflected futures we report on in this study.
To understand how social differentiation among the speakers might affect linguistic differences, analysis of speakers' social characteristics was done not according to the sampling grid, but on the basis of the information about the speakers that had been gathered in the interviews. As a measure of socioeconomic status, each speaker was classified in terms of an occupational scale from 1 to 6. Other measures that differentiated the speakers, such as education and position in the linguistic marketplace,Footnote 14 are not reported in this paper either because they interacted considerably with other factors (e.g., in the case of education and occupation) or because they were not available for both periods in our dataset (in the case of linguistic marketplace assessments).
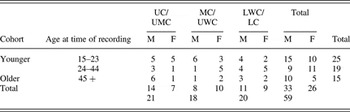
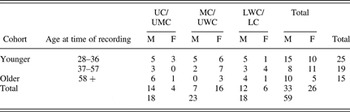
Tables 2 and 3 represent the social characteristics of the panel sample in 1971 and 1984, respectively. Of the 60, 1 person did not use either IF or PF in 1971: speaker #104, a salesman who was 43 years old at that time. Not a very loquacious person in either interview (perhaps oddly, in light of his profession), he used only 5 periphrastic and 4 inflected futures (all of the latter in the negative) when he was recorded at age 58, 13 years later.Footnote 15 All of the remaining 59 speakers provided data for both years, and all were recorded as using both IF and PF. Tokens per speakerFootnote 16 ranged between 13 and 267, with a mean of 71 and a median of 53. Each table is organized in terms of the variables we used to code the data: speaker Sex, the three age Cohorts used in our present analysis, and three levels of Socioprofessional Status obtained by grouping the six-point occupational scale as fully explained in Thibault and Vincent (Reference Thibault and Vincent1990). (Occupation of the head of household was used to classify dependents not in the labor force; retired persons were classified according to their previous occupational level; long-term chômeurs (‘unemployed persons’) were categorized as level 6). Our analytical goal of examining lifespan change motivated our choice to compare each age cohort to itself in later life, rather than trying to re-group the data so as to compare people in a particular age span.Footnote 17 In Table 3, all speakers are (perforce) 13 years older.
Social characteristics of the 59-speaker panel in 1971

Social characteristics of the 59-speaker panel in 1984

When the 1984 data had been collected, Thibault and Vincent (Reference Thibault and Vincent1990) assigned a measure of social mobility to each speaker, calculated by comparing their socioeconomic status (on the original six-point scale) in 1971 and 1984. A move of one point or more up the scale in the intervening 13 years was classified as “upwardly mobile,” whereas a move of one point or more down the scale was classified as “downwardly mobile.” These differences account for the slightly different numbers of speakers in each socioeconomic group between Table 2 and Table 3. There were 8 speakers classified as upwardly mobile, and 11 as having undergone downward social mobility between 1971 and 1984.
Upper and upper middle class
1. “Liberal professions” (e.g., law, medicine) and owners of businesses
2. Employed university graduates
Middle class and upper working class
3. Technicians, managers, foremen
4. White collar workers
Lower working class; lower class
5. Blue collar workers
6. No stable employment
As we explain in more detail in the next section, we collapsed the two younger cohorts—labeled Younger in Tables 2 and 3—in the course of our quantitative analysis, where it emerged that the Older cohort was linguistically distinctive.
This very large spoken corpus of 118 sociolinguistic interviews totals approximately 2.5 million wordsFootnote 18 and represents over 150 hours of speech. Python scripts were used to exhaustively search the transcribed interviews for inflectional and periphrastic forms of the future (excluding tokens in which present tense forms were used to express the future). Over 8000 tokens were extracted and inspected first in order to sort out cases that did not meet our criteria for referencing the future. A total of 4246 were retained for analysis, after cases not properly belonging to future temporal reference were excluded.Footnote 19 We then manually coded these tokens according to the linguistic characteristics described in an earlier section. After subsequently setting aside the 588 negative tokens, we were left with 3658 affirmative tokens for the quantitative analysis.
RESULTS
We saw that Polarity is the major factor conditioning the IF/PF alternation for our speakers. Table 1 indicated that IF accounted for 586, or 99.7%, of the 588 negative tokens we analyzed for the 59 individuals for whom we had future tense tokens from both 1971 and 1984. In what follows, we describe our analysis of the remaining 3658 affirmative tokens only. We present our findings in two sections. First, we look at the entire 1971–1984 dataset, and the general distribution of IF and PF across it, with special attention to linguistic factors. Second, we examine the data from 1971 in comparison with the data from 1984 by social factors.
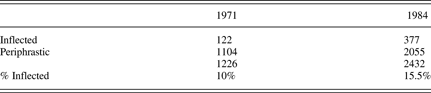
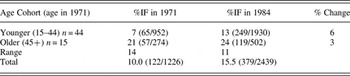
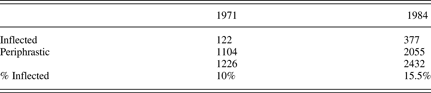
For the 59 panelists, we calculated their percent use of IF in each year of recording. These percentages ranged from 0% to 67%, with a mean of 13.5% and a median value of 11%. The most frequently occurring value was 0%, which we expected for a form that is known to be marginal in speech in affirmative contexts. Overall, however, the use of IF in our 59-speaker panel increased over time (Table 4), contrary to the reported direction of community change (King & Nadasdi, Reference King and Nadasdi2003; Poplack & Dion, Reference Poplack and Dion2009). The rate of IF in 1971 was 10% (122/1226); by 1984 it had risen by 50%, to 15.5% of the total number of tokens (379/2432).
Distribution of future temporal variants in affirmative contexts in 1971 and 1984
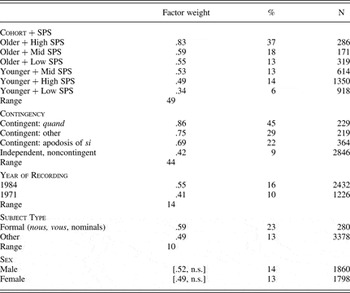
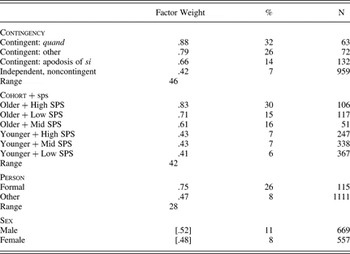
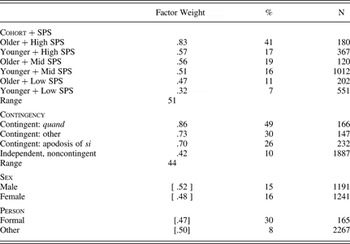
We carried out a multivariate analysis of the entire dataset using Goldvarb X (Sankoff, Tagliamonte & Smith, Reference Sankoff, Tagliamonte and Smith2005) with Yearof Recording as one of our independent variables. In initial Goldvarb runs of the combined data for both years, we discovered an interaction between age cohort and socioprofessional status, which led us to create an interactive factor group: Cohort + Socioprofessional Status. As indicated in Table 5, this factor group, with a range of 49, turned out to be the most important constraint. Speakers who were aged over 44 years in 1971 and of the highest socioprofessional status were most likely to use IF. Within the two age cohorts, there is a positive correlation between higher status and greater probability of using IF. Contingency, Yearof Recording, and Subject Type (formerly Grammatical Person) were also confirmed as significant constraints, but Speaker Sex was not retained in the model.
Factors contributing to the choice of IF in the combined 1971 and 1984 datasets

Corrected mean: .105
Log likelihood: –1249.295
N = 3658
Yearof Recording clearly emerged as a significantly independent constraint on the PF-IF alternation, with a probability of .41 for 1971 that increased to .55 for 1984. Having established that the panelists did indeed increase their use of IF, we leave aside for the moment the interlinked factors of time, age, and social status to look more closely first at the linguistic constraints. We return to social factors in the following section.
Linguistic factors
Both linguistic factors, Subject Type and Contingency, were retained in the step-up, step-down analysis.
In creating the original Grammatical Person category, we initially conceived it in terms of clause-level grammar. However, we expanded this category to include all attested kinds of subjects, and considered it more appropriately defined as Subject Type. In examining the data, our initial cross-tabulations suggested that first person subjects were no different from other grammatical persons, contrary to some previous proposals in the literature. Instead, it seemed that subject nous, vous, and full nominals constituted a set of subject types that differed from the other pronominal subjects. Grouping subjects in terms of nous, vous, and nominals versus all other subject types yielded probabilities that indicated a relatively weak influence on variant selection, with a range of only 10, but its retention put our model in alignment with Poplack and Turpin's (1999) findings for Ottawa French. The influence of this factor as we redefined it has more to do with stylistic differences than with grammatical person per se. Nous, vous, and nominals are rare, and they often occur with other markers of formal style. In (35), subject vous occurs in a clause with the very rare clitic y:
(35) Alors l'Université de Montréal du temps, ça vousen rencontrerez d'autres qui ysont allés.
[Jacques G., 76, 1971, 449]
‘So considering the University of Montreal at that time, in that case you’ll meet others who went there.'
Full nominal subjects without accompanying subject clitics almost never occur when the subject references a person, except for cases where a name or title is used as in (36). More typically, bare nominal subjects reference abstract entities or official bodies such as la religion in (37), le progrès in (38), and le gouvernement in (39), all three in pronouncements of the type Labov (Reference Labov, Eckert and Rickford2001) characterized as “soapbox” style.
(36) Madameva répondre là.
[Jacques G., 76, 1971, 101]
‘The lady will answer.’
(37) Si c'est dans un domaine plus restreint, bien la religionva quand même conserver sa place.
[Lise R., 38, 7, 748]
Even if its domain is restricted, religion will still retain its position.
(38) On voit que le progrèssera très très lent.
[Paul D., 81, 1971, 406]
‘We see that progress will be very very slow.’
(39) Le gouvernement, d'après sa politique va orienter beaucoup de personnes vers la médecine générale
[David St-M., 27, 1971, 808]
‘The government, in accord with its policies, will orient many more people towards general medicine.’
Subjecttype thus turned out to be a proxy for formal style in fostering IF, whereas tutoiement versus vouvoiement (our original “address pronoun” category) did not.Footnote 20 This too is consonant with the findings by Poplack and her colleagues for Ottawa French, but we note that in that study, only vous is associated with formality, and no mention is made of nous or nominals.
Contingency also had a significant influence on the choice between IF and PF. Table 5 shows that IF occurs in quand-related contexts at five times the rate of its occurrence in the default, noncontingent context: 45% as opposed to 9%. Goldvarb indicates this very substantial difference in a range of 44 between the probabilities for the two clause types. In between come two other degrees of contingency: apodosis clauses in si constructions and the remaining contingent clauses expressed in a variety of ways. All three contingency types exhibit greater favorability to IF than we see in noncontingent clauses.
This finding confirms the analysis of Blondeau (Reference Blondeau2006), which located contingency as an important conditioning factor in an analyzing data from 12 of the speakers we report on here.Footnote 21 It is the Contingency factor that yields the most marked difference between the Montréal analyses and the results of Poplack and her colleagues. Because in so many regards these latter results resemble our own very closely, and because the regions represented overlap to a considerable extent, we are tempted to wonder whether this difference results from methodological considerations rather than a difference in speech communities. Poplack and Turpin (Reference Poplack and Turpin1999) found contingency to have only a “very slight” effect; however, they made only a binary distinction between “contingent” and “assumed” environments. Their Table 3 shows IF with a factor weight of .51 for contingent and .45 for assumed—statistically significant but with a very small range of only 6.
Our own results lead us to suggest that the contingency difference that appears so robustly in our data may be related to the greatest and most well-studied difference of all in the distribution of PF and IF: the virtually categorical use of IF in negative contexts. Poplack and Dion cited Deshaies and Laforge (Reference Deshaies and LaForge1981), Jeanjean (Reference Jeanjean, Blanche-Benveniste, Chervel and Gross1988), and in particular Laurendeau (Reference Laurendeau2000) to the effect that there may be a semantic motivation for the association of IF with negative contexts. It seems clear that given the very high frequency of PF in Canadian French, it does not assign any particular meaning, such as the assertive reading proposed by Laurendeau (Reference Laurendeau2000:289). However, the association of IF with the general “hypotheticality of negative contexts” (Poplack & Dion, Reference Poplack and Dion2009:575) may provide an important link between the categoriality of IF in negative contexts and its heightened frequency in cases of overt contingency. Poplack and Dion offered a number of arguments to counter the proposals of Laurendeau and others, among them that such explanations “do not explain why other contexts that, semantically and/or pragmatically, should be equally propitious to [IF] usage show little or none” (p. 575). Indeed their data showed contingent clauses to be almost indistinguishable from the default. In our data, however, though PF tokens are still in the majority in contingent clauses, IF is nevertheless used at rates up to five times the rate found in the default clauses. Contingent clauses are not “equally propitious” to IF in comparison with negatives, but nor are they as unlikely in terms of their semantics. Perhaps they represent an intermediate value on a scale of future likelihood between denial that a future event will occur (negation) and the default cases referred to by Poplack and Turpin (Reference Poplack and Turpin1999) as “assumed”—in other words, whose phrasing assumes their future eventuality.
That there might be an association between contingency and negation is made here tentatively, as a suggestion that we follow up in further work (Sankoff, Wagner, & Jensen Reference Sankoff, Wagner and Jensen2011). However, we envision the relationship somewhat differently from Laurendeau's account, in that we do not assign any inherent meaning to either IF or PF. Despite the evidence that IF and PF have been in competition for at least several centuries (Brunot & Bruneau, Reference Brunot and Bruneau1969), it is clear that as the older variant, IF was once the default.Footnote 22 If ever PF as the innovative variant carried any particular meaning, it has long since lost any such connotations as it has become the default and continues to displace IF. The retention of IF in contexts associated with irrealis modality may be what unites the negative with contingency.Footnote 23
Lifespan and age-grading: What changed?
We established earlier that overall, the 59 panelists increased their use of IF in the 13-year period from 1971 to 1984. We also saw in the Goldvarb analysis that speakers in the Older age cohort were more likely to use IF than Younger speakers. What accounts for the rise in use of IF, and the difference between the two cohorts?
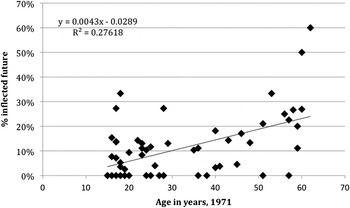
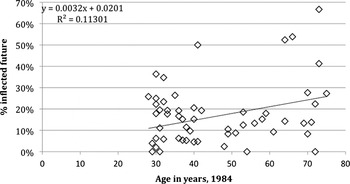
We now move to a more detailed look at the individual panelists to examine interspeaker differences in the use of IF. We plotted panelists' use of future temporal variants by age in each year, as displayed in the scattergrams of individual speaker rates of IF in Figures 1 and 2. In both study periods, older speakers use conservative IF at a higher rate than younger speakers do.
Percentage of IF use for each individual (N = 59) in 1971, affirmative contexts only.

Percentage of IF use for each individual (N = 59) in 1984, affirmative contexts only.

Comparing the scattergrams, two things are clear immediately. First, the number of categorical users of PF declined dramatically between 1971 and 1984, from 20 to 4. Although one-third of the speakers (19 of the 59) were categorical users of PF in affirmative contexts in 1971, 90% of the speakers in this group were making some use of IF in this environment by 1984. The speakers in our longitudinal sample not only increased their existing frequency of use of IF as they aged, but many individuals appear to have added affirmative IF to their spoken repertoire since their 1971 interviews.
Second, the slope with age is steeper in 1971 than in 1984. Speaker age predicts 28% of the variance in 1971 (R Footnote 2 = 0.276) but only 11% in 1984 (R Footnote 2 = 0.113). If, in general, use of IF increases as the panelists age, why is this age effect stronger in the 1971 recordings than in the 1984 recordings? Perhaps it is due to the fact that by 1984, the entire cohort has entered adulthood. The youngest speaker in 1971 was only 15 years old; by 1984, she was 28. IF is perhaps a marker of adult speech, appropriate to the more formal discourse characteristic of this life stage (Chambers, Reference Chambers2003:195), a hypothesis supported by the association between “formal” subject types and IF use in our GoldVarb results. Once the panelists are all adults in 1984, there is less quantitative difference in IF use between the younger and older panelists. Table 6 displays the percent use of IF by age cohort over time. It shows that the range in IF use between age cohorts is 14% in 1971, dropping to 11% in 1984. It is the Younger speakers who have contributed most to the narrowing of this range. Those who were 15–44 years old in 1971 increased their average use of IF from 7% to 13%: a difference of 6 percentage points. By contrast, the Older speakers in 1971, those aged 45 or older, increased their average use of IF much less, from 21% to 24%, a change of only 3 percentage points. Of the 19 speakers displaying categorical use of PF in affirmative contexts in 1971, 10 were under the age of 21, and the magnitude of this change may be an instance of withdrawal from the adolescent peak that has been observed in other studies (Labov, Reference Labov2007; Tagliamonte & D'Arcy, Reference Tagliamonte and D'Arcy2009; Wagner, Reference Wagner2008).
Change in percentage of use of IF, 1971–1984 by age subgroup

However, we saw in the Goldvarb results reported in Table 5 that speaker cohort is not the only social constraint on future temporal referent use. Cohort and Socioprofessional status had a combined effect on the probability of using IF. We checked to see whether the greater change in use of IF over time displayed by the Younger cohort was affected in any way by social status.
We ran separate multivariate analyses for 1971 (Table 7) and 1984 (Table 8) to explore the behavior of the two age cohorts at each point in time. In both years, the linguistic factor of Contingency was retained as before, but Subject Type was not a significant contributor to the variation in 1984. This suggests that as they aged, the panel members not only increased their overall use of IF, but perhaps that they extended IF to a domain (pronouns not marked for formality) where it was previously infrequent. As a result, Goldvarb found no significant difference in probability of IF being used with the two types of pronouns in 1984. We might ask: If speakers extend IF from one linguistic context to another as they age, why have they not extended IF to, for example, noncontingent environments? We suggest that in using IF with pronouns not marked for formality, speakers are extending its use to different stylistic rather than linguistic contexts, and that under this hypothesis, an increase in use of IF in previously unfavorable linguistic contexts should not be expected.
Factors contributing to the choice of IF in 1971

Corrected mean: .068
Log likelihood: –331.295
N = 1226
Factors contributing to the choice of IF in 1984

Corrected mean: .123
Log likelihood: –903.075
N = 2432
With respect to social constraints, Sex was not a significant factor in either year, as expected, given that Sex was not significant in the combined data analysis. Cohort + SPS, by contrast, is retained in both years and is also an important constraint in both years. We can now return to our earlier question: Why did speaker age explain more of the variation in IF use in 1971 than in 1984? A glance at the ordering of factors in the Cohort + SPS group reveals that in 1971 (Table 7), Older speakers were more likely to use IF than Younger speakers, regardless of socioprofessional status. This is consistent with the age-grading hypothesis we advanced earlier. The inflectional future is associated with the speech of middle-aged and older adults, and in 1971, quite a number of our panelists had not yet reached this life stage. Their speech contrasted with the speech of older members of the community, and this is reflected in the factor weights, which for Older speakers favor IF (i.e., are above .5) and for Younger speakers disfavor IF (i.e., are below .5).
By 1984, however, when all the panelists were adults, the linguistic distinction between Older and Younger speakers had concomitantly diminished (Table 8). It appears only within the socioprofessional status groups. The relative importance of social status has increased at the expense of age cohort. This is why in our regression of IF against speaker age (Figures 1 and 2), age explained more of the variation in 1971, but less in 1984.
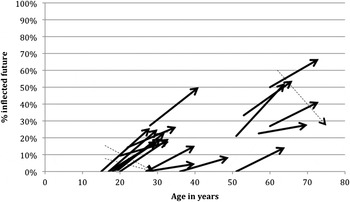
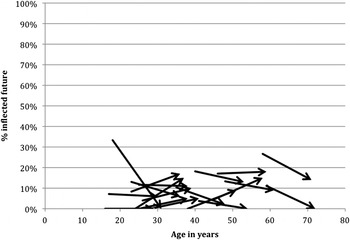
Figure 3 represents the linguistic trajectories of the 21 speakers in the High socioprofessional group. The trend, for all but three of the speakers, is in the direction of increasing IF use over the 13-year period. For contrast, we also display the trajectories of the 20 speakers in the Low socioprofessional group (Figure 4). Speakers at this end of the socioprofessional scale show a stable use of IF over time: that is, if we generalize across the interspeaker variation. This variation is in any case limited, with all but one of the speakers maintaining a frequency of IF use below 30% and in most cases below 20%.
Percent use of IF by individual (N = 21) from 1971 to 1984, High socioprofessional status.

Percent use of IF by individual (N = 20) from 1971 to 1984, Low socioprofessional status.

We are now in a position to draw some conclusions about the distribution of IF and PF in the speech of our speakers over time. The IF variant, although infrequent in the affirmative contexts we included in our analysis, nonetheless retains a substantial position in Montréal French. Two-thirds of our panelists (38 of the 59) increased their use of IF as they aged. Of these, 18 had used PF categorically in the 1971 recordings. Speakers in the Younger cohort registered the greatest overall increase in use of IF over time, which we attributed to an association of IF with seniority. We proposed that IF is an age-graded feature of Montréal French that is used least by those who are not yet fully established adult members of the community. Once our youngest panelists had reached this life stage, we saw a fading of the sharply age-graded difference between the Younger and Older panelists' use of IF. Instead, social distribution of IF was primarily stratified by socioprofessional status, with those in the highest group more likely to use IF than those in the middle socioprofessional group, who in turn were more likely to use IF than those in the lowest group. Within each social stratum, however, age-grading persisted. Finally, we saw that in 1971, the use of more formal subject types, such as nous and vous were associated with greater likelihood of using IF. Although Subject Type was not a significant predictor of IF use in 1984, we suggest that the association was probably not lost, but that the general increase in IF frequency among the panelists reduced the importance of this already marginal constraint.
CONCLUSIONS: SURPRISES, IMPLICATIONS, AND DIRECTIONS FOR FUTURE RESEARCH
When we began this research, we already knew that we were dealing with a change in progress, a change that had been going on since at least the mid 19th century in Québécois French: the steady attrition of inflected futures in favor of periphrastic futures. Our expectation with respect to change across the lifespan in the IF/PF alternation was that we would find one of two patterns, or perhaps a combination of both. Speaker stability in adult life, which we assume to be the default case in the relationship between language change and change across the lifespan, appeared to be the more likely. A rate of 20% use of inflected futures in the 1980s represented a decline of just over 50% across the span of about 120 years (from 36% in the latter half of the 19th century), according to the figures presented in Poplack & Dion, Reference Poplack and Dion2009:572). At a rate estimated at 10% or so per generation, across five or six generations, we saw no reason to infer the kind of dramatic intergenerational differences that might have led older speakers in later life to alter their speech in the direction of the ongoing change. This was, however, the second possibility we envisaged, because earlier research on the same Montréal population we studied across the 1971–1984 period had shown exactly this pattern among a substantial minority of speakers in the change from apical to uvular (r) (Sankoff & Blondeau, Reference Sankoff and Blondeau2007).
One of the first steps we took in analyzing our data appeared to confirm our expectation of speaker stability. When we plotted individual rates of use of inflected futures by speaker age in 1971, the slope of .43 (displayed in Figure 1) was in the expected direction: younger speakers appeared to be continuing the change, with rates of IF use lower than those of older speakers. Indeed, one-third of the population, mostly at the younger end of the age spectrum, was found to be using PF categorically in affirmative contexts. However, the same plot for the 1984 data (displayed in Figure 2) gave us pause: overall use of IF had increased, and the slope had been reduced to .32 for the same speaker population, just 13 years older. The obvious conclusion was that these speakers, as they aged, were changing their rates of use of IF, a life-span pattern indicating age grading, in the opposite direction to the long-term historical trend.
This retrograde life-span pattern did not apply with equal force to all members of the population. As a group, the younger cohort of speakers registered the more substantial change in the 13 years after the first recordings, although change was not negligible for the older cohort as well. Our interpretation here was that the transition into full adulthood was a more meaningful one in terms of language use than any later life-span transitions. We also discovered that social class (here represented in terms of three divisions along a six-point socioprofessional scale) was crucial, with upper and upper middle class speakers the most likely to register a change toward greater use of the conservative IF form. Tracking individuals separately in the highest and lowest categories of the six-point socioprofessional scale (Figures 3 and 4) showed a basically flat pattern for the lowest group, but quite dramatic transitions for the highest. These findings were surprising not in the establishment of an age-graded pattern per se, but because life-span change was observed to be occurring in the opposite direction from that of ongoing change in the language. Having wrestled with many difficult questions of interpretation that this study has forced us to think through, we have identified five major implications of these findings for future research.
First, the surprise of an apparently retrograde lifespan trajectory on the part of many speakers leads us to consider possible alternative explanations. In particular, given the clear conservative association of inflected futures, it is possible that stylistic differences will prove to be a strongly conditioning factor. What if the change in overall IF usage rate for the same 59 speakers from 10% to 15.5% were associated with major stylistic differences in the interviews conducted in the 2 years, rather than with a change in speaker repertoires? Although our work with the present data does not encourage us to believe that this is the case, we intend to explore stylistic considerations in further research.
Second, our results indicate that age grading can act as a brake on change. What is the mechanism involved in people reverting to more conservative linguistic patterns as they age? In their middle years, do people look to the models from older speakers that they neglected when they were young? To what extent does input from older speakers provide conservative forms to language learners? To date there has been very little discussion of such questions in sociolinguistic research.Footnote 24
Third, we have shown speakers well beyond the critical period to be making considerable changes in their use of competing forms. Moreover, a substantial proportion of our sample (19 of the 59 speakers) seemed to change from a stage or state when one of the forms was categorically absent from their repertoires in one grammatical context to a stage at which the two forms were in competition. If this is conceived as a qualitative, rather than a quantitative change, it seems even more surprising that it is occurring relatively late in life.
Fourth, these results push us to consider the general implications of the absence of data—are we (and language learners) dealing with the poverty of the stimulus, with the interpretation of zeroes (Labov, Reference Labov, Dressler, Luschütsky, Pfeiffer and Rennison1987), or both? What is the relationship between nonuse of any linguistic feature and the underlying grammar we can infer for speakers? What can we learn about the social context of late-learned features in general? Are they late-learned, or simply late-used? We believe that experimental research may complement corpus-based sociolinguistic research in providing answers to these questions.
Lastly, an apparent time interpretation of age-graded data would, in this case, overestimate the actual pace of change (taking usage rates of elderly speakers to represent the state of the language when they acquired it would picture these speakers as “farther back” than they actually were as children, so the “distance” between that stage and the present would appear to be greater than it actually was).Footnote 25 Though we still believe that in the absence of real-time data, an apparent time interpretation is the best default option, it is clearly the case that more complete answers require real-time studies.
Were we overly optimistic in hoping that our current research would clarify the dialectic relationship between language change in the individual and in the community? The present study has built on previous research in discovering the possibility of opposing directional trends at these two levels, but it has also raised many questions for further research. To answer some of them, we are now working on a trend study of the IF/PF alternation (Sankoff & Wagner, in preparation) that compares a 1971 speaker sample to a carefully matched sample of different individuals in 1984. This research will enable us to establish whether community change was actually going on, and in what direction, during the same period represented by our current panel study, and then to compare those community-level trends to the individual trajectories reported here. A combination of trend and panel research is, we believe, crucial in answering the many questions that arise in relating historical language change to change over individual life spans.
APPENDIX
A summary of the IF and PF distribution of excluded tokens is given by exclusion category in Table A1.
Distribution of exclusions, by category and future form, 59 speakers, negative and affirmative data
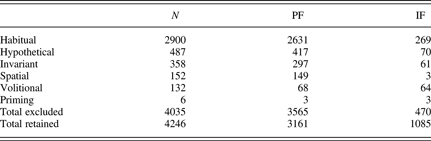
The following were excluded from the dataset because they represented invariant forms of various kinds, such as idioms and sayings.
Invariant periphrastic forms
(A1) je vais/vas/m'as dire
je vais/vas/m'as te dire (une affaire)
je vais/vas/m'as vous dire
on va dire
‘Let me tell you (something)’
A la Commission de Transport je m'as te direbien franchement ça évolue pas vite hein. C'est comme l'église catholique, c'est éternel . . .
[Marc P., 6, 1984, 206]
‘At the Transport Commission, let me tell you quite frankly, things don't evolve quickly. It's like the Catholic Church. It's eternal . . . ’
(A2) (je) m'as parler comme on parle
‘I'll say it the way we say it/tell it like it is’
Puis je trouve que Raymond, c'est un gars qui a toujours mangé— de la marde, m'as parler comme on parlehein.
[Paul G., 2, 1971, 887]
‘And I think Raymond is a guy who has always put up with a lot of— of crap, to tell it the way it is.’
(A3) ça va faire . . . …
‘It'll be . . .’
Parce-que là actuellement ça va fairepresque cinq ans là que je travaille dans un centre d'Accueil pour personnes âgées.
[Lise R., 38, 1984, 292]
‘Because now it'll be almost five years that I've been working in a Welcome center for the elderly.’
(A4) on va prendre
tu vas prendre
vous allez prendre
‘Let's take (for example) . . .’
Vous allez prendreun Italien qui sait pas un mot de français, le premier mot qu'il va savoir c'est un sacre. [Marc P., 6, 1971, 907]
‘Let's take an Italian who doesn't know a word of French. The first word that he's going to know is a swear word.’
Invariant inflected forms
(A5) ce que ça voudra
ce que tu voudras
ce que vous voudrez
ce qu'on voudra
comme tu voudras
X que tu (or other pronoun) voudras
‘what(ever) you/he (etc.) want/s’
je pense pas que le régime communiste ou socialiste ou que tu l'appelleras comme tu voudras . . .
[Bernard L., 87, 1984, 448]
‘I don't think that the communist or socialist regime or whatever you want to call it . . .’
(A6) vous direz ce que vous voudrez
‘you can say what you like’
Oui oui, mais je veux dire là franchement, la messe, vous direz ce que vous voudrez,c'est pas ça qui va sauver quelqu'un.
[Michel L., 52, 1971, 982]
‘Yes, yes, but I mean, honestly, Mass—you can say what you like, that's not what's going to save anybody.’
(A7) advienne que pourra
‘come what may’
Mon désir c'est de mourir ici, advienne que pourra.
[Éléanore L., 79, 1984, 169]
‘My wish is to die here, come what may.’
(A8) le ciel t'aidera
‘heaven will help you’
Aide-toi, le ciel t'aidera.
[Lucille R., 84, 1984, 926]
‘Help yourself, and heaven will help you.’
(A9) l'avenir le dira
‘the future will tell’
L'avenir le diraqui va prendre la place de l'autre.
[Henriette N., 15, 1984, 2299]
‘The future will tell who will take the place of the other.’
(A10) qu'il y aura pas
‘that there will ever be’
Ca va être la plus grosse école qu'il y aura pas.
[Armand H., 62, 1971, 161]
‘That's going to be the biggest school that there will ever be.’
(A11) vous verrez
‘you will see’
dans ce bois là, puis vous verrezça vous en ferez pas gros de promenades. C'est un bois sale, fait-que— un trou, un marais . . .
[Marc P., 6, 1984, 1205]
‘in that wood there, you'll see, you're not going to go for a lot of walks. It's a dirty wood, so— a hole, a marsh . . .’
(A12) en manger-ez[/as, etc.] une/des bonne(s)
‘get/take a good one’ [receive a blow]
Je leur dis eux-autres, si je dirais pas ces mots là que, “ Vous en mangerez des bonnes”
[Rita C., 50, 1971, 1037]
‘I tell them, if I didn't use those words [swear] that, “You'd be getting some good ones [punches]’
(A13) on en parlera pas
‘let's not talk about it’
j'ai rappelé un autre matin— Urgence-Santé en disant “Je fais de l'angine sans arrêter puis venez à mon secours”, puis là ils m'ont amenée. . . . Ah ça ça a ni queue ni tête, de même que les hôpitaux on en parlera pashein.
[Éléanore L., 79, 1984, 140]
‘I called another morning— Emergency Health, saying, “I have non-stop angina so come to my rescue” and so then they brought me . . . Oh, it makes no sense at all, just like the hospitals, let's not talk about it.’
(A14) ça sera pas long
‘It/I won't be/take long’
Je m'excuse de vous— ça sera pas long.
[Roland M., 83, 1971, 54]
‘Excuse me— I won't be long.’