1. INTRODUCTION
For many OECD countries for the postwar period, the first differences of nominal variables such as inflation rates or money growth seem to be well described as autoregressive processes integrated of order one, I(1). This implies that the levels of the nominal variables are integrated of order two, I(2), as reflected in several empirical applications: see, e.g., the analyses of money demand and open economy price determination in, inter alia, Juselius (1998, 1999), Diamandis, Georgoutsos, and Kouretas (2000), Banerjee, Cockerell, and Russell (2001), Banerjee and Russell (2001), Fliess and MacDonald (2001), Nielsen (2002), Kongsted (2003), and Bacchiocchi and Fanelli (2005).
For the multivariate p-dimensional vector autoregressive (VAR) model with no deterministic terms, Johansen (1992) showed that two reduced rank restrictions imposed allow for I(2), I(1), and also I(0) variables. Moreover, the variables in levels and first differences may be cointegrated corresponding to the cointegration ranks, or the integration indices, (r,s). The rank r determines the number of stationary relations, whereas the rank s determines the number of linear combinations of the variables in levels that are I(1). The remaining dimension, p − r − s, determines the number of common I(2) trends in the system. The analysis was extended to include deterministic terms such as the linear trend in Rahbek, Kongsted, and Jørgensen (1999) and constant terms in Paruolo (1996). See also Johansen (1995, 1997, 2006), Paruolo and Rahbek (1999), Kurita (2006), and Paruolo (2000) and the survey by Haldrup (1998) for further references on I(2).
Inference on the cointegration ranks (r,s) is crucial for empirical applications, and the main contribution of this paper is to present the likelihood ratio (LR) test for the number of cointegration ranks in I(2) VAR models and derive the asymptotic distributions. The LR test is new, as existing literature has applied a non-LR test, referred to as the two-step test here. The two-step test is based on the sum of two sets of canonical correlations from a non–maximum likelihood (non-ML) estimation procedure in two steps for I(2) VAR models; see Johansen (1995), Paruolo (1996), and Rahbek et al. (1999). The two-step-based test was developed as an approximation to the LR test that is straightforward to implement as a sequential application of reduced rank regression (RRR) well known from I(1) analysis. The LR test for finite samples is smaller than (or equal to) the corresponding two-step test and decreases rejection frequencies for small samples; see the included examples in Section 4.2 where the difference between the LR and the two-step-based statistic is quite large. Regarding asymptotics, we find that the asymptotic distributions of the LR tests are identical to the two-step-based tests' asymptotic distributions, and hence existing critical values published for the two-step tests apply to LR tests also. Based on a study of existing empirical examples in the literature and related Monte Carlo simulations we examine some further finite-sample properties of the tests. In particular, size properties of the proposed LR test are excellent.
By definition, the LR test is based on ML estimation of the parameters in the I(2) models. ML inference with known ranks, (r,s), was proposed by Johansen (1997) and Boswijk (2000) based on different parametrizations. In line with the results for the two-step analysis in Rahbek et al. (1999), ML inference has been extended to the linear trend case in Rahbek and Nielsen (2006). When deriving the limiting distributions of the LR test statistics, we apply the parametrizations of Johansen (1997) and Rahbek and Nielsen (2006). Note that the LR test and general ML estimation of the I(2) models already are implemented in the new version of CATS in RATS; see Dennis (2006). Ox code for calculating the LR test for the cointegration ranks can be obtained from the authors.
The rest of the paper is organized as follows. Section 2 presents the I(2) models and the LR test in addition to a brief review of the two-step test statistics. The asymptotic distributions of the LR test, and their use, are considered in Section 3. Section 4 investigates small-sample properties of the rank tests based on empirical examples and Monte Carlo simulations.
Throughout, use is made of the following notation: for any p × r matrix α of rank r, r < p, let α⊥ indicate a p × (p − r) matrix whose columns form a basis of the orthogonal complement of span(α) and let α = α(α′α)−1. Finally, the symbols

,

, and

are used to indicate weak convergence, convergence in probability, and equality in distribution, respectively.
2. MODELS, REPRESENTATION, AND ESTIMATION
This section reviews parametrization, representation, and estimation for I(2) models based on Johansen (1995), Paruolo (1996), and Rahbek et al. (1999), where more details can be found.
2.1. Model with No Deterministic Terms
Consider first the p-dimensional VAR model of order k with no deterministic terms as given by

Here Π, Γ, and Ψi are p × p matrices, εt is a p-dimensional independent and identically distributed (i.i.d.) Np(0,Ω) sequence, Ω > 0, and the initial values X−k+1,…, X0 are fixed for the statistical analysis. The I(2) model, denoted H(r,s), is then defined by two reduced rank restrictions given by


where α and β are p × r matrices and ξ and η are (p − r) × s matrices with r ≤ p and s ≤ p − r. We use the notation H(r) = H(r,p − r) to denote I(1) models, and H(p) denotes the unrestricted vector autoregression.
2.1.1. Representation.
To state a representation for Xt, denote by H0(r,s) the assumption that the characteristic polynomial, A(z) = Ip(1 − z)2 − Πz + Γ(1 − z)z − Ψ1(1 − z)2z − ··· − Ψk−2(1 − z)2zk−2, has exactly 2(p − r) − s roots at z = 1 and the remaining roots outside the unit circle. It relates to H(r,s) as the 2(p − r) − s unit roots imply reduced rank r < p in (2) and reduced rank s < p − r in (3).
Under H0(r,s), Xt in (1) is an I(2) process with the representation

By Johansen (1992), Xst is a stationary mean-zero I(0) process, and the notation α1 = α⊥ξ, β1 = β⊥η, α2 = (α,α1)⊥, β2 = (β,β1)⊥, and

has been used. The coefficients γc and γl depend on the initial values of the process and satisfy (β,β1)′γl = 0 and β′γc − δβ2′γl = 0, where δ = α′Γβ2. It follows from (4) that (β,β1)′Xt is I(1) as (β,β1)′C2 = 0, whereas the (p − r − s) linear combinations β2′ Xt are I(2). Moreover, there are r mean-zero stationary linear combinations,

2.1.2. Variation-Free Parametrization.
To maximize the likelihood function for known ranks (r,s) under the hypothesis H(r,s), Johansen (1997) suggested a reparametrization of the model based on the reduced ranks in (2) and (3) and also on the cointegration term in (5). The reparametrization is given by

where

. Furthermore, α, ρ ((r + s) × r), τ (p × (r + s)), ψ (p × r), κ ((r + s) × (p − r)), Ψi (p × p), i = 1,…, k − 2, and Ω are all freely varying parameters. The parameters in the previous formulation in (1)–(3) can be derived from the new parameters by the identities τ = (β,β1), β = τρ,

,

, and κ′ = −α⊥′Γ(β,β1) = −(α⊥′Γβ,ξ), using the skew-projection identity,

No closed form solution for the ML estimators of the parameters in (6) exists, but estimates are obtained by a switching algorithm: for fixed τ, the parameters α⊥ and α can be obtained by solving an eigenvalue problem, and the remaining parameters can be found from regression. For fixed values of these parameters, τ can be estimated by generalized least squares. Convergence to the global maximum of the likelihood function is not guaranteed, but the value of the likelihood function increases in each iteration. In our implementations we use the two-step estimators, reviewed next, as starting values for the ML iterations.
In the two-step estimation, first the parameters α and β in (2) are estimated by RRR as applied in I(1) models ignoring the reduced rank restriction (3). In the second step, ξ and η in (3) are estimated by RRR with r and the estimated α and β from the first step fixed; see Johansen (1995).
2.2. Models with Linear Trends and Deterministics
It is often important to include deterministic linear trends and a constant level in empirical applications. Rahbek et al. (1999) propose an I(2) VAR model that allows deterministic linear trends and a constant level in all components and linear combinations of the process. This includes the cointegrating relations (5) and avoids at the same time the possibility of quadratic trends. In terms of the parameterization in (6), this model, denoted H*(r,s), can be represented as

where τ* = (τ′,τl)′ ((p + 1) × (r + s)), ψ* = (ψ′,ψc)′ ((p + 1) × r), and, finally, Xt* = (Xt′,t)′ is p + 1-dimensional. As in Section 2.1.1, the model with exactly 2(p − r) − s unit roots and the remaining roots with modulus larger than one is referred to as H0*(r,s). Under H0*(r,s) the process Xt in (8) has the representation in (4) but with γl and γc being functions of τl and ψc in addition to initial values. In particular, Δ2Xt,

are mean-zero stationary processes. As a result, Xt is as emphasized an I(2) process with linear trends in all linear combinations of the process. With Xt* and ΔXt* replacing Xt and ΔXt, respectively, ML estimation of the parameters under H*(r,s) is identical to the case of no deterministic terms. Asymptotic distributions of the ML estimators can be found in Rahbek and Nielsen (2006), and two-step-based inference is discussed in Rahbek et al. (1999).
Further classes of I(2) models with varying deterministic specifications have been considered in the literature, such as, e.g., the model with a constant level in all linear combinations of the process, including the cointegrating. In this case the model can be represented as in (8), with Xt* = (Xt′,1)′ and ΔXt* = ΔXt. Models with this and also with different specifications of the parameter of the constant regressor are considered in Paruolo (1996, 2000).
3. RANK TESTING IN I(2) MODELS
This section analyzes and proposes the LR test for cointegration ranks in the I(2) VAR models using the parametrizations of Johansen (1997) and Rahbek and Nielsen (2006). Asymptotic distributions of the LR test statistics under the I(2) hypotheses H0(r,s) and H0*(r,s) are addressed in Theorems 1 and 2, which follow. Also the conventionally applied two-step rank test statistics in Johansen (1995) and Rahbek et al. (1999) are briefly reviewed as they are used for comparison. Finally implementation of rank determination based on sequential testing is briefly discussed.
3.1. Test Statistics
For rank determination we propose to use the LR test for H(r,s) against the unrestricted alternative, H(p), as defined by

where

and

denote the covariance matrices estimated under H(r,s) and H(p), respectively. The conventionally applied two-step rank test statistic is the sum of two test statistics:

where

and

. Here λi are the (p − r) smallest eigenvalues from the RRR in the first step, and ζi are the (p − r − s) smallest eigenvalues from the RRR in the second step of the two-step estimation, corresponding to the reduced ranks of Π and α⊥′Γβ⊥ in (2) and (3), respectively. Likewise for H*(r,s) and H*(p), in which case the LR test is denoted Sr,sLR* and the two-step test is denoted Sr,s2S*.
3.2. Asymptotic Distributions of the LR Tests
In this section the asymptotic distributions are given for the LR tests of cointegration ranks in the I(2) models H(r,s) and H*(r,s). To present the limiting distributions define for Xu, Yu, and Zu of dimension px, py, and pz on the unit interval u ∈ [0,1],

Consider first the hypothesis H(r,s) against the unrestricted H(p).
THEOREM 1. Under H0(r,s) (cf. Section 2.1.1), then as T → ∞,

where

Here Wu = (W1u′,W2u′)′ is a (p − r)-dimensional standard Brownian motion on the unit interval, u ∈ [0,1], with W1u of dimension s and W2u of dimension p − r − s. Furthermore,

The proof is given in Appendix A. Note, that the asymptotic distribution of the LR test is identical to the asymptotic distribution of the two-step rank test derived in Johansen (1995, Thm. 7). In particular, the two components, Qr∞ and Qr,s∞, have the asymptotic distributions of the statistics from the first and second steps of the two-step rank test, Qr and Qr,s. This implies that the critical values for the two-step rank test can be applied to the LR test.
The result in Theorem 1 is extended to the model H*(r,s) in Theorem 2. The proof given in Appendix B is based on asymptotic theory in Rahbek and Nielsen (2006) for the ML estimators of the parameters in H*(r,s). An important implication is that the LR test and the two-step test are asymptotically similar with respect to the parameters of the deterministic terms; see also Nielsen and Rahbek (2000) for a discussion of the implication of similarity. Critical values are given in, inter alia, Rahbek et al. (1999) and Doornik (1998).
THEOREM 2. Under H0*(r,s), then as T → ∞,

where Qr*∞ = tr{S(W,G1,W)} and Qr,s*∞ = tr{S(W2,G2,W2)}. The Brownian motion Wu is defined in Theorem 1, and

The results in Theorems 1 and 2 can be extended to further classes of I(2) models. Specifically, Paruolo (2000) showed that the two-step estimators are asymptotically efficient for a wide class of models including the case of a constant level in all linear combinations of the process. Hence mimicking the proofs of Theorems 1 and 2 and using Paruolo (1996), the limiting distribution of the LR test for cointegration ranks is conjectured to be the same as reported in Theorem 2, but with

and G2 = W2u.
3.3. Rank Determination
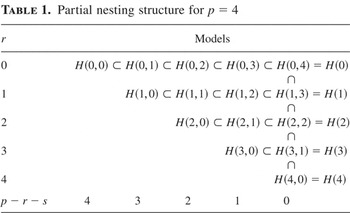
Different values of the cointegration ranks define the sequence of partially nested models illustrated in Table 1 for the p = 4-dimensional case, and we discuss rank selection for the model with no deterministic terms for simplicity.
Partial nesting structure for p = 4

In the determination of the cointegration ranks in empirical applications, economic theory may provide some guidance. With a particular model suggested by theory, the corresponding hypothesis, H(r,s), can be tested directly against H(p). Alternatively, or if little is known a priori, an estimate

of the ranks can be obtained by a sequential application of the rank tests. The idea is to start testing the most restricted model, H(0,0), and in case of rejection to proceed left to right and top to bottom in Table 1. The estimator can be written as

where Sr,s denote either of the test statistics and cr,s their asymptotic critical values. The estimator

will select the correct ranks with a limiting probability (1 − π), where π is the size of each test in the sequence as discussed in Johansen (1995).
4. FINITE-SAMPLE PROPERTIES
From the previous section it is clear that asymptotically the LR and the two-step tests are identical, and this section explores their finite-sample difference. Initially we characterize the relation between the LR statistic and the two-step-based statistic. Next, we discuss some main points based on a detailed study of existing empirical applications and corresponding Monte Carlo simulations. For illustration, details of one of the empirical applications are given.
4.1. The LR and Two-Step Statistics in Finite Samples
The asymptotic equivalence of the LR test and the two-step rank test does not hold for finite samples in general. The relation between the test statistics is stated in the following proposition for the case of H(r,s). Note that the same result holds for H*(r,s).
PROPOSITION 1. Consider the hypothesis H(r,s) in H(p). In finite samples,

Equality holds if (p − r − s)r = 0.
Proof. First note that the LR test, Sr,sLR, is given in (9) as

, where

and

denote the covariance matrices found by ML estimation under H(r,s) and H(p), respectively. The two-step-based test, Sr,s2S, in (10) can be rewritten as

where

is the two-step-based estimator of Ω under H(r,s) and

is the (ML) estimator of Ω under H(r) = H(r,p − r). Thus, Sr,sLR ≤ Sr,s2S is equivalent to

. This follows by showing that (i) the two-step-based estimators of the parameters are not ML estimators and, at the same time, (ii) the parameters of the two-step parametrization lie in the parameter set over which the ML estimation is performed. To see this, note that the estimator

is found by maximizing the likelihood function as defined by (6), with freely varying parameters in the parametrization as given by θLR := (α,ρ,τ,ψ,κ,Ψi,Ω). The estimator

is best discussed in the variation-dependent parametrization given by θ2S := (α,β,ξ,η,α⊥′Γβ,α′Γ,Ψi,Ω). Fixing β and α at their first step RRR values,

is found by maximizing the likelihood function over the remaining parameters in θ2S. Setting α = α, τ = (β,β⊥η), ρ = (I,0)′, Ω = Ω,

, κ′ = −(α⊥′Γβ,ξ), and Ψi = Ψi, this corresponds to a specific parameter point in θLR, and, by definition,

. Note that in two special cases, the two-step procedure actually maximizes the likelihood function under H(r,s): first, in I(1) models, where s = p − r and α⊥′Γβ⊥ is nonsingular; and second, if r = 0 where the second step of the two-step procedure is conditional on α = β = 0. █
Proposition 1 implies that rejection frequencies for hypothesis H(r,s) in H(p), where r(p − r − s) > 0, are lower for the LR test than for the two-step test. As a consequence the type I error probability is lower for the LR test, whereas the type II error probabilities, for tests of more restricted models, are potentially larger.
Note that the magnitude of the difference depends on the number of restrictions in (3), which is ignored in the first step of the two-step estimator. The number of ignored restrictions is largest for models on the diagonal of Table 1, where s = 0, and the LR and the two-step statistics coincide for models located in the first row and last column of Table 1. Also note that in the model H*(r,s) a restriction on the parameter of the constant regressor is ignored in the first step of the two-step procedure. Finally, note that in Proposition 1 the special case of r(p − r − s) = 0 is implied by either no I(2) trends (p − r − s = 0) or by no I(0) relations (r = 0). Under the assumption of I(2), the case of r = 0 implies that Γ has reduced rank s < p and can be factorized as Γ = ξη′, and hence this case mimics the statistical analysis of an I(1) VAR model in first differences.
4.2. Empirical Study and Monte Carlo Simulations
To analyze the small-sample properties and compare the LR and two-step tests, three approaches were taken. First, we revisited the rank determination in a number of published I(2) applications in the literature using both types of statistics. We reconsidered the money demand analyzed by I(2) VAR models in, inter alia, Johansen (1992) and Rahbek et al. (1999), the domestic pricing behavior in Banerjee et al. (2001), the Danish export pricing behavior in Nielsen (2002), and the Danish import price determination in Kongsted (2003). Next, Monte Carlo simulations were performed with the estimated models as data generating processes (DGPs); i.e., for each empirical example a DGP was defined as the model H*(r,s) with parameter values set to the ML estimates. With this choice of DGPs for the Monte Carlo study they were empirically relevant, and we checked that the parameters satisfied the assumptions underlying the theoretical results. Finally, we constructed a larger study based on different DGPs to cover a broader range of the parameter space of the I(2) model.
The main result emerging from the studies is that the size properties of the LR test are clearly preferable to the two-step test and the rejection frequency of the LR test for a true null hypothesis is often close to the nominal size of the test. The two-step test, on the other hand, is often severely size distorted, with rejection frequencies far above the nominal size. This is particularly the case if s = 0 in the DGP. In some cases the LR test still overrejects true hypotheses, as is also known from the LR test in I(1) models. If the size distortion of the LR test is deemed important, the challenging task of deriving a Bartlett correction of the LR test can be considered; see, e.g., Johansen (2002) for the I(1) case. To keep the presentation concise and focus on the main points we report results only for the Danish import price determination. The full set of results can be obtained from the authors.1
See www.econ.ku.dk/okohn.
4.2.1. Empirical Illustration.
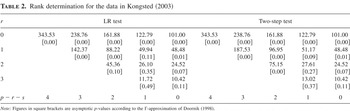
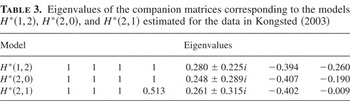
In this section we revisit the rank determination in Kongsted (2003) based on a p = 4-dimensional set of data including Danish import prices, domestic prices, a measure of competing prices, and an interest rate. Kongsted (2003) estimated a VAR(2) model for the effective sample 1975:3–1995:4 and included a linear trend in all directions, corresponding to the model H*(r,s), in addition to an unrestricted impulse dummy for the observation 1992:2. Here we adopt the same specification, noting that the impulse dummy has no effect asymptotically. According to Kongsted (2003), economic theory suggests the model H*(2,1) with two stationary relations, one I(1) trend and one I(2) trend. The LR statistics for the cointegration ranks are reported on the left-hand side of Table 2. Starting from the most restricted model H*(0,0) it is possible to reject all models with r = 0 at a 5% level. In the second row, H*(1,0) and H*(1,1) are easily rejected, whereas H*(1,2) has a p-value of 11%. If this model is nevertheless rejected, the next potential model is H*(2,0), comprising two stationary relations and two I(2) trends, again with a p-value of around 10%. The test statistic for the theoretically preferred model, H*(2,1), is 26 corresponding to a p-value of 35%. The LR rank tests thus point toward the models H*(1,2), H*(2,0), and H*(2,1) as potentially relevant for the current data. The eigenvalues of the companion matrices corresponding to these models, i.e., the inverse roots of the characteristic polynomials, are given in Table 3. The processes have 2(p − r) − s unit roots, and for all three choices of parameter values the remaining roots seem to be far from the unit circle in accordance with the assumptions for Theorem 2.
Rank determination for the data in Kongsted (2003)

Eigenvalues of the companion matrices corresponding to the models H*(1,2), H*(2,0), and H*(2,1) estimated for the data in Kongsted (2003)

The two-step rank test statistics, also reported in Kongsted (2003), are given on the right-hand side of Table 2. As noted, all test statistics in the first row and last column are identical to the LR results, and the remaining test statistics are all higher. Using the two-step test there is marginally more evidence for rejecting H*(1,2). Furthermore, the model H*(2,0) is clearly rejected, and the two-step statistic of 75 is markedly higher than the corresponding LR statistic of 45. Thus based on asymptotic inference with a 5% significance level, both statistics lead to different results than expected from economic theory, and the two tests give different indications on the potentially relevant models. In the next section we use Monte Carlo simulations to investigate further the differences of the two tests in particular with respect to size properties.
4.2.2. Simulations Based on the Estimated Model.
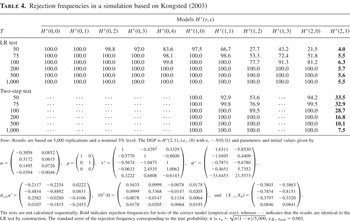
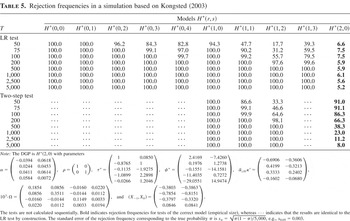
To analyze the differences, we set up a small Monte Carlo simulation with the DGPs defined by the parameters from ML estimation under H*(2,1); see Table 4 for specific parameter values. For each simulation i, we generate time series, X1i,… XTi, for T ranging between 50 and 1,000 and by replacing εt with random draws from an i.i.d. Gaussian distribution with the estimated covariance matrix. Each series is initiated with initial values X0i and ΔX0i; to ensure that each nonstationary series is initiated the same way across all simulations, the nonstationary I(1) and I(2) directions of the process are initiated from the corresponding observed initial values. That is, with β2 = τ⊥, β2′ X0i = β2′ X0obs, β2′ΔX0i = β2′ΔX0obs, and, correspondingly, β1′ X0i = β1′ X0obs. The stationary directions, ρ′τ*′Xti* + ψ*′ΔXti*, τ*′ΔXti*, and β2′Δ2Xti, are on the other hand initiated from the invariant distribution by discarding 100 initial simulations of the stationary series, thus eliminating the importance of initial values in the stationary series.
Rejection frequencies in a simulation based on Kongsted (2003)

The rejection frequencies at a nominal 5% level are reported in Table 4 for the two tests. The rejection frequencies of H*(r,s) in H*(p) are identical for the two-step rank test and the LR test for models with r = 0. For the models H*(1,0), H*(1,1), H*(1,2), H*(2,0), and H*(2,1), the finite-sample distributions, and the rejection frequencies, differ. For the LR test the rejection frequencies for the true model H*(2,1) are very close to the nominal 5% for all sample lengths. The rejection frequencies of some of the more restricted hypotheses, e.g., H*(1,2) and H*(2,0), are relatively low in small samples, indicating a low power. The two-step test is clearly size distorted, with rejection frequencies for the true model H*(2,1) around 30% in small samples. The actual size converges very slowly to the nominal 5%, and for T = 500 the rejection frequency is still twice the nominal size. At the same time the rejection frequencies for more restricted models are higher than the LR test. For a small sample, T = 50, the rejection frequency for H*(2,0) is 94% compared to a rejection frequency of 22% for the LR test.
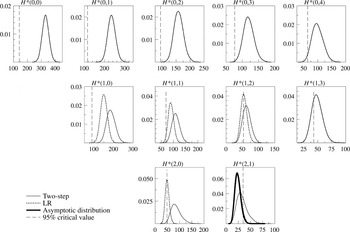
The distributions of the test statistics are reported in Figure 1 for the case T = 75. The graphs are organized according to the nesting structure in Table 1. The lower right graph reports the results for tests of the true model, H*(2,1). The distribution of the LR statistics almost coincides with the asymptotic distribution, whereas the distribution of the two-step statistics is more dispersed and displaced to the right. For some of the more restricted hypotheses, there are big differences between the distributions. The difference is largest if s = 0.

Distributions of the two test statistics for the case T = 75. Graphs are organized according to the partial nesting structure. Results are based on 5,000 replications.
To illustrate the difference when s = 0 in the true model, we performed the simulations again taking ML estimation under H*(2,0) as defining the DGP; see Table 5 for the parameter values. In this case a large distortion appears in the two-step estimation of the model with correct ranks. The rejection frequencies are reported in Table 5. Note that the true model H*(2,0) is almost always rejected using the two-step rank test—and this is the case for all relevant sample lengths. For T = 200, corresponding to 50 years of quarterly observations, the actual size of the two-step test is 66%. The LR tests, on the other hand, have good size properties, with rejection frequencies close to the nominal size.
Rejection frequencies in a simulation based on Kongsted (2003)

APPENDIX A: Asymptotic Distribution of the LR Test
In this Appendix we give the proof of Theorem 1. We first introduce some notation. Similar to the definition of S(X,Y,Z) in (11), define

Define further product moment matrices Mxy for time series processes Xt and Yt of dimension px and py, respectively, by

. With θ a parameter, the corresponding true parameter is denoted θ0. Furthermore,

and

denote the ML estimator under the null hypothesis and the alternative, respectively.
Proof. Under H(p) the VAR(k) model in (1) is given by

where Φ = (Ψ1,…, Ψk−2) and

. The hypothesis of interest is H(r,s) given by (6),

Henceforth, the parameters β, τ, and α⊥ under H(r,s) are normalized on c = β0, c = τ0, and c = α0⊥, respectively, such that β0′ β = Ir, τ0′τ = Ir+s, and

. These are convenient normalizations and ensure identification of all parameters in the model. Note in particular that ρ = τ0′ β, which is (r + s) × r.
We want to derive the asymptotic distribution of the LR test,

As in the likelihood analysis of the I(2) model in Johansen (1997) we introduce key parameters:

where ρ⊥ = (I − ρ0(ρ′ρ0)−1ρ)ρ0⊥. Note that ρ = τ0′ β = ρ0 + τ0′ β10 B1 = ρ(B1) and define similarly ρ⊥(B1). By Johansen (1997, Lem. 1) it follows that for the ML estimators

,

,

, and

derived under H(r,s),


under H0(r,s). Here

with Vu a Brownian motion on u ∈ [0,1] with covariance Ω0. Furthermore,


where the identity ξ0 = −κ0′ ρ0⊥ has been used (cf. Section 2.1.2; see also Johansen, 1997, Table 2) and Ωα⊥α⊥ ≡ α⊥′Ωα⊥. Now under H(r,s) the model in (A.2) can be rewritten as

in terms of the regressors Z0t, Z1t, and Z2t, which are zero mean I(0), I(1), and I(2), respectively, and defined by

The parameters are given by

Introduce the auxiliary hypothesis, Haux, where ψ (p × r), β (p × r), and τ (p × (r + s)) are fixed at their true values, ψ0, β0, and τ0, corresponding to B0, B1, B2, and C all identically zero. Note that Haux ⊆ H(r,s) ⊆ H(p) and that under Haux, the model equation in (A.9) reduces to

It follows by definition that

Turn first to −2 log Q(Haux|H(r,s)) and define the corresponding estimated residuals,

Then

, and

where, with Zt = (Z1t′,Z2t′)′ and θz = (θz1,θz2),

With

it follows that

Next, using (A.4), the definitions in (A.11), and consistency of the remaining parameters, it follows that

Combining (A.14) and (A.15) and using the definitions in (A.5) it follows that

Note that as α0′α0⊥ = 0 and

then by definition,

i.e., the cross-product terms vanish. Next, by convergence to stochastic integrals,

Therefore by joint convergence, and as

,

, and furthermore using the definitions of V1 and V2 in (A.7) and (A.8),

Next, consider −2 log Q(Haux|H(p)). Under the alternative H(p) the model is given by (A.1) and the ML estimators

,

,

, and

are given by ordinary least squares (OLS) regression of Δ2Xt on

. Define Zit as in (A.10), but redefine θzi in (A.11) as

With these definitions, together with the identities α0⊥′Γ0 = −κ0′τ0′ and (7), standard limiting arguments give that

is consistent,

. Furthermore, θ0z1 = θ0z2 = 0, and similar to (A.15),

With these results, identical to the H(r,s) case,

Next, collecting terms and using (7), it follows that


The first term in (A.21) can be rewritten as

where Gu = ((H1u′,H2u′)′|H0). Next,

and

where

and α20 = α0⊥ξ0⊥. Inserting (A.22) in the second term of (A.21) and collecting terms,

and the result in Theorem 1 follows by defining the standard Brownian motion, W, by setting Wu = (α0⊥′Ω0α0⊥)−1/2α0⊥′Vu. █
APPENDIX B. Asymptotics for the Linear Trend Case
Proof of Theorem 2. The proof mimics the proof of Theorem 1 with new parameters and notation as presented in the following discussion. The needed asymptotic distributions of the ML estimators in H*(r,s) are given in Rahbek and Nielsen (2006).
Under H*(p) the VAR(k) model in (8) is given by

where Πl and Γc are p-dimensional parameters corresponding to the linear trend and constant regressors, respectively. Under H*(r,s) given by (6), the right-hand side in (B.1) is replaced by

From the likelihood analysis in Rahbek and Nielsen (2006), introduce parameters for the deterministic terms

in addition to B0, B1, and B2 in (A.4) and C in (A.5). By Rahbek and Nielsen (2006) it follows that for the ML estimators derived under H*(r,s) and evaluated under H0*(r,s),

With Hu defined in (A.6), Hu* = (Hu′,u,1)′ and H0u* = (H0u′,1)′, whereas V1 and V2 are defined in (A.7) and (A.8). Now under H*(r,s) the model in (B.2) can be represented as

where Zlt* = t − 1, Zct* = 1, Z2t* = β20′ Xt−1, and

The parameters θz0, θz1, and θz2 are given by (A.11), whereas

The auxiliary hypothesis, Haux*, is given by ψ, β, τ, ψc, and τl fixed at their true values ψ0, β0, τ0, ψc0, and τl0, such that under Haux*, the model equation in (B.3) reduces as before to (A.12). For −2 log Q(Haux*|H*(r,s)) define

and

as in (A.13), whereas

Furthermore, set Zt = (Z1t*′,Z2t*′,Zlt*,Zct*)′, θz = (θz1,θz2,θzl,θzc) and define the normalization by

. Then as in (A.16),

Next, turn to −2 log Q(Haux*|H*(p)). Under the alternative H*(p) the ML estimators

,

,

,

,

, and

are found by OLS regression of Δ2Xt on

and the constant and linear trend. Define Zit* as in (B.4) and redefine θzi in (B.5) for i = 0,1,2 as in (A.17), whereas

Then as in (A.19),

. Finally, as in (A.23),

where Gu* = ((H1u′,H2u′,u)′|H0*). █