

Introduction
There is increasing attention on the supplementation of animal feed with specific exogenous enzymes to improve animal performance and efficiency of meat and egg production whilst decreasing pollution from intensive farms (Bedford, Reference Bedford2000; Mehri et al., Reference Mehri and Shirmohammad2011; Doherty et al., Reference Doherty, O'Shea, Mc Alpine, Solan, Curran, Varley and Walsh2014). Enzyme supplementation allows the feed producer greater flexibility in the type of raw materials that can confidently be used in feed formulation (Bedford, Reference Bedford2000; Vieira et al., Reference Vieira, Freitas, Angel, Favero and Maiorka2011). In many animal production systems the biggest single cost is feed, and on-farm profitability can depend on the relative cost and nutritive value of the feed ingredients available (Barletta, Reference Barletta, Partridge and Bedford2010; Zakaria et al., Reference Zakaria, Jalal and Abu Ishmais2010). If feeds are not digested by the animal as efficiently as they could be, there is a cost to both the producer and the environment, due to higher levels of excreted intact nutrients which are lost to the animal (Chiou et al., Reference Chiou, Yu, Wu, Liu and Gauthier2007; Kalmendal et al., Reference Kalmendal and Tauson2012). By improving digestion and the absorption of nutrients, there is a reduction in the volume of manure produced and a lowering of phosphorus and nitrogen excretion (Fidelis Fru-Nji, Reference Fidelis Fru-Nji2011).
Proteases are protein-digesting enzymes that are used in animal nutrition to break down storage proteins in various plant materials and proteinaceous anti-nutrients in vegetable proteins (Hajati, Reference Hajati2010). This process facilitates improved nitrogen utilisation which can cause a decrease in diet protein content and in turn reduce the content of nitrogen in manure (Isaksen et al., Reference Isaksen, Cowieson, Kragh, Partridge and Bedford2010; Vieira et al., Reference Vieira, Freitas, Angel, Favero and Maiorka2011). Proteases have also been found to assist in the breakdown of non-starch polysaccharides (NSP) and storage proteins that bind to starch, releasing bound starch that can then be digested by the animal (Hayashi et al., Reference Hayashi, Saleh, Ohtsuka and Tanaka2004; Ljubojević et al., Reference Ljubojević, Milošević, Bjedov and Stanaćev2011).
The quantification of feed additive proteases following supplementation to feed has proved technically challenging (Südekum et al., Reference Südekum, Edmunds, Spiekers and Schwarz2010; Sheehan Reference Sheehan, Partridge and Bedford2010). Conventional methodologies involve colorimetric or fluorimetric testing which can be time consuming, expensive and laborious (McCleary, Reference McCleary, Partridge and Bedford2001; Sheehan Reference Sheehan, Partridge and Bedford2010). There remains a need for a suitable method for the detection of protease activity. The criteria for such a method would be that it is robust enough to allow the detection of protease in feed additives and in complete (compound) feed. The method would be inexpensive and convenient to use and could be applied to routine quality control testing and could be further utilised by authoritive bodies and inspectorates interested in routine monitoring of food and feed quality and when investigating fraudulent adulteration of feed and ensuring the authenticity and traceability of feed products.
The objective of the experiments described herein is to provide a method for the detection of proteases that meets the criteria described above and to validate the method accordingly. The approach used for the assay was to adapt a procedure used to determine the proteolytic activity of haemoglobin, which is expressed as haemoglobin units on the tyrosine basis (HUT) (Johnson, Reference Johnson1996). The activity of protease is measured as a function of the catabolic degradation of haemoglobin in terms of changes to its optical rotator dispersion. The progress of the catabolic reaction is monitored discontinuously by spectrophotometric assay at predetermined time intervals and samples are inactivated to stop the reaction.
Materials and methods
Only reagents of recognised analytical grade were used. Deionised or demineralised water or water of equivalent purity (18.2 MΩ/cm at 25°C) was used.
2 M Sodium acetate
This solution was prepared by dissolving Sodium acetate trihydrate in distilled water and was then diluted to volume in a volumetric flask (Reagent 1).
1 M Acetic acid
This solution was prepared by diluting glacial acetic acid with distilled water in a volumetric flask (Reagent 2).
0.1 M Acetate buffer pH 4.7
Reagent 1 (25 ml) and Reagent 2 (50 ml) were added to a 1 l beaker containing a stir bar and approximately 800 ml of distilled water. The pH was adjusted to 4.7 ± 0.02 with 0.1M HCl and the solution was diluted to volume with distilled water.
0.5 M Sodium acetate
This solution was prepared by diluting Reagent 1 in distilled water in volumetric flask.
0.3 N HCl
This solution was prepared by diluting concentrated HCl (I N) distilled water in a volumetric flask.
Trichloroacetic acid (TCA) solution 14% (w/v)
TCA (14.0 g) was dissolved in approximately 50 ml of distilled water and diluted to volume with distilled water in a 100 ml volumetric flask.
Haemoglobin solution
Haemoglobin (Sigma #H2625) (4.0g) was weighed into 250 ml beaker which contained a stir bar. 100 ml of distilled water was added and the solution was stirred for 10 minutes. A pH electrode was immersed in the solution and the solution was adjusted to pH 1.7 with 0.3 N HCl with continuous stirring. After 10 minutes, the pH was adjusted to 4.7 with 0.5 M sodium acetate. A volume of 200 ml was transferred to a volumetric flask carefully to minimise foaming and diluted to volume with distilled water and vortexed. Fresh haemoglobin solutions were prepared daily.
L-tyrosine standards
L-tyrosine (100 mg) was dissolved in 60 ml 0.1 N HCl in a 150 ml beaker. This solution was transferred analytically to a 1 l volumetric flask. After tyrosine was completely dissolved, the solution was diluted to volume with distilled water. This solution had a concentration of 100 µg/ml. A dilution containing 75 µg tyrosine/ml was prepared by adding 75 ml of the above solution to a 100 ml volumetric flask and bringing to volume with deionised water. This procedure was repeated to prepare a solution with 50 and 25 µg tyrosine/ml by using 50 ml and 25 ml, respectively, of the 100 µg tyrosine/ml solution.
Enzyme samples
A representative commercial enzyme (Vegpro®, Alltech Inc, USA) sample was prepared by collecting ten 1 kg samples throughout a production run. The samples were then mixed to make one representative sample. Commercial Vegpro® test solutions were prepared by dissolving a 1 g sample of the relevant test substance in acetate buffer pH 4.7 to produce a solution containing between 9 and 22 HUT in each ml. The enzyme was to produce an absorbance reading (ΔA below) within the linear range. Subsequently, 5 ml portions of haemoglobin solution was transferred by pipette into test tubes - two for each enzyme sample, one for the enzyme sample blank and a single substrate blank. The test tubes were incubated for five minutes in a 40°C water bath. Beginning at time zero, 1.0 ml of enzyme solution was transferred by pipette to the sample reaction tubes which contained 5 ml of the equilibrated haemoglobin solution. The mixture was gently vortexed for 30 seconds and then placed into the 40°C water bath. A 1.0 ml aliquot of enzyme solution was continually transferred by pipette to the sample reaction tubes until all samples have been combined. After exactly 30 min, 5 ml of TCA solution was quickly added to each tube (sample reaction tubes, substrate blank tubes, and enzyme blank tubes) to stop the reaction.
Preparation of the blank control was made whereby 1 ml of the acetate buffer solution was added to each blank tube. Each tube was vortexed for 40s and the mixture was kept at room temperature for 1 hour, while vortexing the tubes frequently throughout the incubation time. After 1 h, tubes were vortexed and filtered through a funnel with Whatman filter paper (Sigma #Z241113). The mixture was re-filtered through the same filter.
Assay calibration and determination of protease activity
Quartz cuvettes were used to read the absorbencies of the filtrate at 275 nm using the filtrate of the substrate blank to zero the instrument. Where an absorbency reading between 0.2 and 0.5 was not obtained, the test was repeated using more or less enzyme preparation as necessary. A calibration curve was constructed based on the tyrosine standard. The absorbance at 275 nm for each of four tyrosine concentrations was determined. The concentrations (x axis) were plotted against absorbance (y axis) and a linear regression was used to determine the absorbance for a solution containing 1.10 µg tyrosine/ml. The slope of the curve was determined in terms of absorbance per µg tyrosine.
One HUT (haemoglobin unit on a tyrosine basis) of proteolytic (protease) activity was defined as that amount of enzyme that produces, in 1 min under the specified conditions, a hydrolysate with an absorbance at 275 nm that is the same as that of a solution containing 1.10 µg/ml tyrosine in 0.006 N HCl.
Calculation of the tyrosine curve factor
 $$\hbox{Tyrosine curve factor} = {\hbox{Total volume (ml)} \over {\rm A}_{275} \,{\rm of} \, 1.10\, {\rm \mu}{\rm g} \, {\rm tyr/ml} \cdot {\rm Time(min)}\rpar}$$
Calculation of enzyme activity
 $$\hbox{Enzyme activity (HUT/g)} = (\Delta {\rm A}/0.0084) . 11 \,{\rm ml}/30\, \, {\rm min}^{\ast} \,{\rm W}({\rm g})^{\ast} \, {\rm F})$$
Where:
ΔA is the difference in absorbance (μg tyrosine per ml) between the sample and blank.
0.0084 is the accepted absorbance of 1.10 µg ty/ml at 275 nm (i.e. tyrosine curve factor).
11 ml is the final volume of the test solution.
30 min is the reaction time.
W is the weight (g) of the original sample.
F is the dilution factor.
Protease assays
The experimentation followed the ICH procedures for a single-laboratory validation in an accredited laboratory with a concomitant verification of the performance characteristics in a second, independent expert laboratory (Thompson et al., Reference Thompson, Ellison and Wood2002; Simone and Robouch, Reference Simone and Robouch2014). The results for two assays are provided for both the determination of the activity of protease in Vegpro® and the determination of the activity of protease in animal feedstuffs.
Assay 1: The determination of the activity of protease in Vegpro®
The validation of the published method (Glenney et al., Reference Glenney and Filer2005) for determining protease activity in the commercial, protease containing enzyme Vegpro® was undertaken at an independent expert laboratory (Laboratory 1). The tests involved were carried out in accordance with the principles established in the French Standard, Norme NF XPT 90-210 Association Française de Normalisation (AFNOR), 1999. In addition, a separate verification study was completed in a secondary laboratory (Laboratory 2) to corroborate the results. The results of both sets of analyses are described and discussed here.
Conditions that applied to Laboratory 1: Enzyme feed supplement: Vegpro® in liquid form; batch #247639; stored at 5°C + 3°C.
Conditions that applied to Laboratory 2: Enzyme feed supplement: Vegpro® in liquid form; batches #297922 (known) and #297923 (unknown); stored at 4°C + 2°C.
Assay 2: The determination of the activity of protease directly in animal feedstuffs
The assay used a 10 g sample of pelleted starter chicken feed, with an extraction volume of 40 ml. The extraction procedure involved grinding the sample in a motor and pestle and then solubilising it in acetate buffer solution and shaking for 15 minutes. The solution was then centrifuged at 2,000 G for five minutes at 4°C for an incubation time of 6 hrs with the enzyme feed supplement: Vegpro® in liquid form (batch #249568, where 1 ml has a mean activity measured: 43,500 HUT/kg feed). The blank solution was prepared by adding TCA solution to a feed sample prior to the addition of the enzyme feed supplement and therefore no substrate enzyme interaction occurs.
Specifically, the studies wished to investigate the following validation parameters; a) Precision – including repeatability and intra-laboratory reproducibility; b) Sensitivity – including the Limit of Quantification (LOQ) and Limit of Detection (LOD); c) Uncertainty and d) Accuracy
Assay 1: The determination of the activity of protease in Vegpro®
Precision
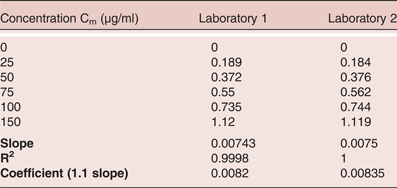
Both laboratories generated a standard calibration curve with tyrosine to determine a set of absorbances over a pre-determined range. The results of the readings observed are presented in Table 1.
Matrix 1 (protease in Vegpro®): Comparison of the calibration of tyrosine between 0 and 150 µg/ml as measured by spectrophotometer at absorbance 275nm at two laboratories

The calibration curves were used to determine the precision of protease activity in Vegpro®. The calibration over the range of 0–150 µg/ml of tyrosine yielded linearity with an R2 value of 0.9998 and 1.0 respectively for the tests taken in each laboratory. (Figures 1 and 2).
Calibration of tyrosine between 0 and 150 µg/ml as measured by spectrophotometer (absorbance 275 nm) in Laboratory 2
Calibration of tyrosine between 0 and 150 µg/ml as measured by spectrophotometer (absorbance 275 nm) in Laboratory 2
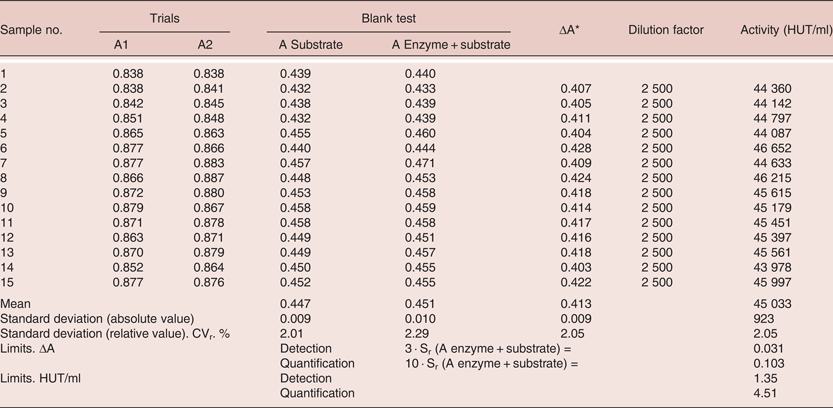
Reproducibility was defined as the absolute difference between two single test results found on identical test material by one operator using the same apparatus within the shortest feasible interval and will exceed the repeatability limit r in not more than 5% of the cases. Intra-laboratory reproducibility was considered as the absolute difference between two single test results on identical test material reported by two laboratories that will exceed the reproducibility limit R in not more than 5% of the cases. To study repeatability, fifteen determinations of Vegpro® were undertaken. The results of this experiment are given in Table 2.
Matrix 1: Repeatability of protease activity in the feed additive preparation, Vegpro®
* ΔA corresponds to the difference in absorbance (A) between the mean absorbance values A1 and A2 of the two trial and the absorbance value for an enzyme + substrate blank test read at a wavelength of 275 nm. ΔA = (A1 + A2)/2 – ( A enzyme+substrate blank test)
The study to investigate intra-laboratory reproducibility involved preparing a standard calibration curve with tyrosine three times over three consecutive months to determine the absorbance and linearity over the range. The results of the absorbance observed are presented in Table 3.
Matrix 1: Study of intra-laboratory reproducibility - calibration with tyrosine (absorbance 275 nm)
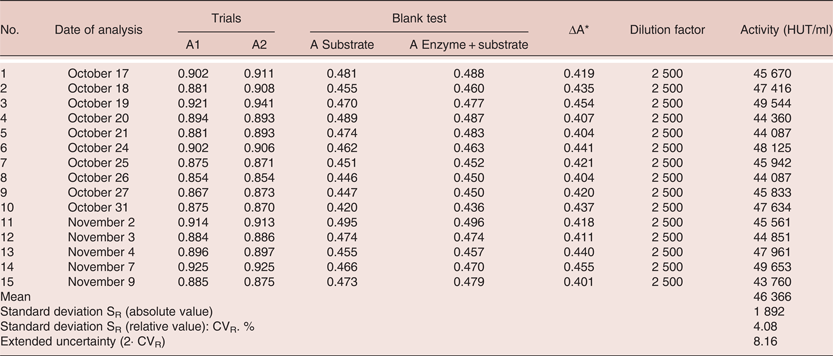
The calibration curve over the range of 0–150 µg/ml of tyrosine yielded good linearity with an R2 of 0.9998 (Figure 3). The experiment undertaken to determine intra-laboratory repeatability was similar to take undertaken for repeatability only the repeat testing was carried out on 15 consecutive days (Table 4). The RSD was 4.08% which was within the established standard limit of 5%.
Linear model of observed range from feed spiked with known concentrations of protease (HUT/kg feed)
Matrix 1: Protease analyses performed on 15 different days on the feed additive preparation Vegpro®:
* ΔA corresponds to the difference in absorbance (A) between the mean absorbance values A1 and A2 of the two trial and the absorbance value for an enzyme + substrate blank test read at a wavelength of 275 nm. ΔA = (A1 + A2)/2 – (A enzyme+substrate blank test)
Sensitivity – LOD and LOQ
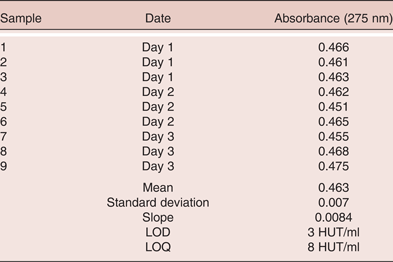
The LOD and LOQ were based on the determinations of the blank sample which contained the enzyme and the substrate that had been denatured with TCA. The LOD was calculated using the formula; LOD = 3 SD of the blank test (enzyme + substrate). The LOD was demonstrated to be 1.35 HUT/ml. The LOQ was calculated using the formula; LOQ = 10 SD of the blank test (enzyme + substrate). The limit of quantification was found to be 4.5 HUT/ml. The LOD and LOQ were also calculated separately by Laboratory 2 under different conditions. Three replicate determinations were conducted on three separate days over the course of a week. The results, tabulated in Table 5, were calculated as 3 HUT/ml and 8 HUT/ml for the LOD and LOQ respectively.
Matrix 1 (Protease in Vegpro®): LOD and LOQ analysis calculation over three independent days
Uncertainty
Uncertainty was determined from the calibration ranges under reproducible conditions and based on the standard deviations associated with each of the range endpoints. Uncertainty was defined as twice the ratio of the standard deviation of the average absorbance and expressed as a percentage of the reported value. The uncertainty associated to the results is 20% of the reported value. An extended uncertainty value of +8% should be applied to protease activity values. The uncertainty of the experiment was observed to be 8.16%.
Accuracy
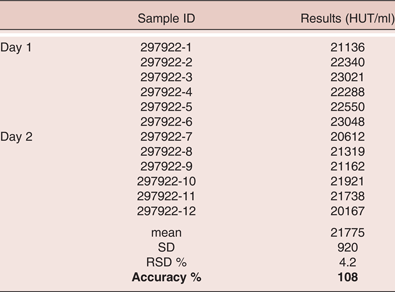
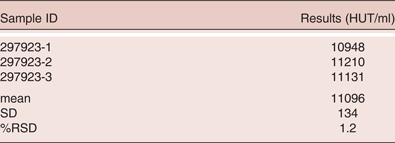
The accuracy of the assay was examined by undertaking six replicate determinations of a known sample with a theoretical activity of 20,000 HUT/ml on two consecutive days. The accuracy is a measure of the closeness of agreement between the theoretic true value and the experimental value. The accuracy was calculated with the formula: Percentage Recovery = [(average recorded value – expected value)/average recorded value] 100 + 100. The result was found to be 108% (Table 6). A sample of an unknown sample was also tested. The SD and %RSD were found to be 134 and 1.2% respectively (Table 7).
Matrix 1 (protease in Vegpro®): Accuracy of reproducible analyses determined from 12 samples on two independent days
RSD % = SD x 100/x; SD = standard deviation; X = mean
% Recovery = [(average recorded value – expected value)/average recorded value] 100 + 100
Matrix 1 (protease in Vegpro®): Determination of protease concentration (HUT/ml) in three unknown samples of Vegpro®
Concentration range
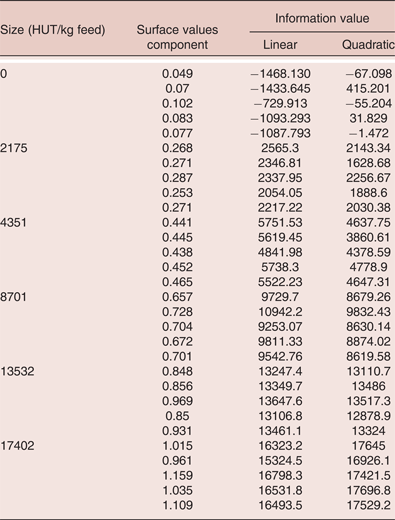
A test feed sample was supplemented with increasing concentrations of enzyme in the range 0 to 22,000 HUT/kg feed. The principle extraction of the feed in an acetate buffer solution was performed. Note that this step was not required when directly analysing the feed additive. The extract was brought into contact with a haemoglobin solution. After 6 h of incubation at 40°C, the enzymatic reaction was stopped and the absorbance of the solution measured at a wavelength of 275 nm. Under the same operating conditions, a sampling range was determined from a non-supplemented feed to which was incorporated known doses of an enzymatic preparation. A linear and quadratic determination of the range of concentration was assessed. The data acquired is given in Table 8 and depicted in Figures 3 and 4 for the linear and quadratic analysis respectively.
Quadratic model of observed range from feed spiked with known concentrations of protease (HUT/kg feed)
Matrix 2 (protease in feedstuffs): Determination of the range of protease concentration (HUT/kg) in feed
Assay 2: The determination of the activity of protease directly in animal feedstuffs
Validation tests were performed to study the proposed method for determining protease activity in animal feedstuffs which had been supplemented with Vegpro®. Specifically, the validation examined:
1) A study of the range of concentrations covered by the method
2) An estimate of uncertainty
3) Verification of the choice of the quantification limit with the calculation of the detection limit
4) A study designed to highlight any possible matrix effects on various types of poultry feed.
Initially, a calibration graph over seven enzyme concentrations were chosen within the presumed range of the method (in the range 0 to 22,000 HUT/kg feed); supplementation rates and absorbencies were collected over a five month period. This data was used to develop linear and second degree (quadratic) polynomial models. A significant model error was observed over the chosen calibration range of 0 to 22,000 HUT/kg feed, necessitating re-evaluation of the upper range concentration. The range 0 to 17,500 HUT/kg feed was considered acceptable, with the quadratic model giving a R2 value of 0.9993.
Uncertainty
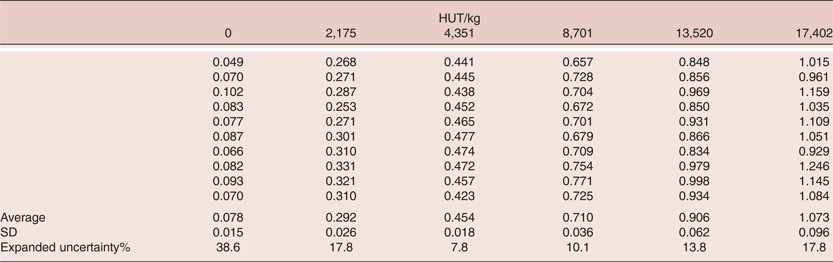
The uncertainty of the experimental data was established as a determinant from various calibration ranges made under conditions that satisfy reproducibility. The standard deviation (SD) was calculated for each of the range points. Table 9 shows the uncertainty determined for each concentration point. All the values of the calibrations made during the study of the domain of application and the matrix effects were compiled. For the various range endpoints, there was uncertainty ranging from 10 to 20%. Over the supplementation rate ranging from 2,000 to 17,500 HUT/kg, the method provides an expanded estimated calculated uncertainty equal to +20% in relative value.
Matrix 2 (protease in feedstuffs): Calibration values (absorbance 275 nm) from the range of application and matrix effects
Sensitivity (LOD and LOQ)
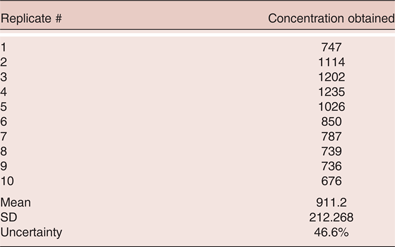
The LOQ was examined in accordance with the French standard Norme NF XPT 90-210 (Association Française do Normalisation, 1996). Two conditions are stipulated in this standard in choosing an LOQ: 1) the average value does not differ from the quantification limit chosen, and 2) the quantification limit is not equal to zero. A LOQ of 1,000 HUT/kg which met the demands of the standard was selected and the SD and uncertainty of ten replicate analyses of this concentration point were determined. The results of this experiment are provided in Table 10. An LOQ of 1,000 HUT/kg was chosen for the method. However, the adequacy test gives an estimated calculated uncertainty associated with this point that is greater than 46.6%. It was decided that a higher LOQ would be more suitable. The SD and uncertainty of the concentration point of 2,000 HUT/kg was assessed and resulting associated uncertainty was found to be 19.6%, which was within the 20% uncertainty range. In a secondary independent test, the LOQ calculated using the conventional equation LOQ = 10 SD. The LOQ calculated by this method was found to be 2,000 HUT/kg and therefore, this value was established as the LOQ for this method. The LOD was calculated as 700 HUT/kg.
Matrix 2 (protease in feedstuffs): Validation of the limit of quantification (LOQ) and determination of the Uncertainty % at 1,000 HUT/kg
Matrix effect
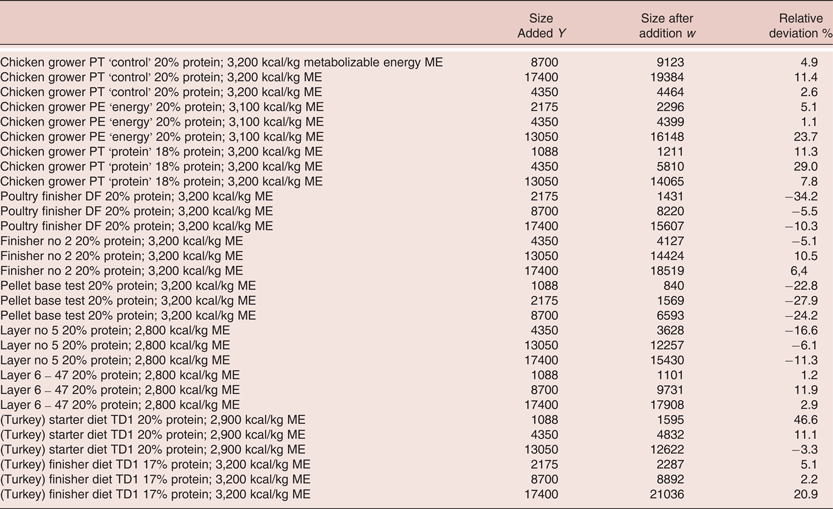
The objective of this study was to determine whether the method was effective in determining protease activity in a variety of poultry feedstuffs. The feedstuffs were representative commercial soy-base diets for different phases of poultry growth. The method was tested using a range of enzyme concentrations in chicken starter feed; that same range of enzyme concentrations was used to test a series of feed matrices. Enzyme activity levels were then calculated. Activity levels determined empirically were plotted against the theoretical levels. A linear regression was plotted corresponding to the activity levels recovered versus the theoretical levels added. The data for this study is shown in Table 11 and Figures 5. To evaluate specificity, we verified that the curve of the line did not differ by 1 and that the original y axis did not differ from 0. The study showed that no significant matrix effect was present in the feed matrices investigated.
Matrix effect of 10 selected commercial poultry feeds on protease recovery (HUT/kg feed)
Matrix 2 (protease in feedstuffs): Matrix effect of 10 selected poultry feeds on protease recovery (HUT/kg feed). All diets were standard corn soy diets with protein and energy levels as listed in the table
Conclusions
Proteases are enzymes which can be added to animal feed and provide benefits such as improving animal health, digestion and facilitate the optimal utilisation of feedstuffs in terms of maximising nutrient use and uptake. Hitherto, it had proved difficult to analyse the activity of protease in animal feed additives and directly in animal feedstuffs. This paper validates an analytical method based on the hydrolysis of haemoglobin and involved measuring the proteolytic activity which is expressed as haemoglobin units of the tyrosine basis (HUT).
It has been demonstrated that the principle of the method can be applied on two separate matrices; namely, for the determination of the activity of protease in feed additives; and for the determination of the activity of protease in animal feedstuffs. Both of the matrices were validated separately and independently and cover the parameters such as linearity, precision, sensitivity, accuracy and matrix effects. The tests show that the methodology is fit for purpose and therefore suitable to determine the activity of protease in both assays. The study therefore meets the objective in providing a method that can be applied to protease for routine testing and in quality control conditions.
Acknowledgements
The authors wish to acknowledge the work of O. Locqueneux, M.D. L'Hotellier and K. Michel on performing the validation work at the Institute of Environmental Engineering and Biotechnology, Bordeaux, France. The authors would like to thank Alltech Inc (Nicholasville, Kentucky, USA) for their financial support of this project.
Declaration of Interest
The authors G.D. Dillon, K. Filer and C.A. Moran are employees of Alltech Inc. which fully funded this research.