I. INTRODUCTION
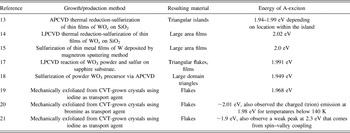
Single layers of semiconducting transition metal dichalcogenides (TMDs), such as WS2, MoS2, WSe2, MoSe2, etc., have emerged as key materials in a significant and fast moving field due to their complimentary electronic properties with respect to graphene (semimetal) Reference Geim and Novoselov1 and boron nitride (insulating). Reference Kim, Hsu, Jia, Kim, Shi, Dresselhaus, Palacios and Kong2 Moreover, they allow for the possibility of novel hetero-layer stacked structures containing insulators, metals, and semiconductors. Reference Dean, Young, Meric, Lee, Wang, Sorgenfrei, Watanabe, Taniguchi, Kim, Shepard and Hone3,Reference Novoselov and Castro Neto4 Unlike graphene, a monolayer of these semiconducting TMDs is composed of not one but three atoms usually organized in a trigonal prismatic arrangement of chalcogen-metal-chalcogen atoms. Reference Wang, Kalantar-Zadeh, Kis, Coleman and Strano5 In bulk, the individual layers of a TMD are held together by van der Waals forces. The crystal behaves as an indirect band-gap semiconductor in which the transition is from the valence band maximum at the Γ point to the conduction band minimum along the Γ–K direction. Reference Berkdemir, Gutierrez, Botello-Mendez, Perea-Lopez, Elias, Chia, Wang, Crespi, Lopez-Urias, Charlier, Terrones and Terrones6 The direct-gap at the K point has a much higher energy than the indirect-gap. Reference Berkdemir, Gutierrez, Botello-Mendez, Perea-Lopez, Elias, Chia, Wang, Crespi, Lopez-Urias, Charlier, Terrones and Terrones6 As the number of layers is reduced, however, the indirect-gap becomes larger and larger until, for a monolayer, the direct transition at the K point becomes the lowest energy transition. Reference Berkdemir, Gutierrez, Botello-Mendez, Perea-Lopez, Elias, Chia, Wang, Crespi, Lopez-Urias, Charlier, Terrones and Terrones6 Thus, monolayered WS2 is a direct-gap material, Reference Chhowalla, Shin, Eda, Li, Loh and Zhang7,Reference Mak, Lee, Hone, Shan and Heinz8 making it appealing for many applications in optoelectronics. Reference Lopez-Sanchez, Lembke, Kayci, Radenovic and Kis9–Reference Ganatra and Zhang12 According to several reports in the literature, the energy of the A-exciton, which is the smallest transition at the K point where the valence band is split due to spin–orbit coupling, Reference Mak, Lee, Hone, Shan and Heinz8 in the photoluminescence (PL) spectrum of WS2 can vary from 1.9 to 2.02 eV, Reference Gutierrez, Perea-Lopez, Elias, Berkdemir, Wang, Lv, Lopez-Urias, Crespi, Terrones and Terrones13–Reference Zeng, Liu, Dai, Yan, Zhu, He, Xie, Xu, Chen, Yao and Cui21 as shown in Table I. The spread in the measured PL energy suggests that there are factors influencing the optical properties that could stem from the way the WS2 monolayers were obtained for each case. Therefore, the origin of this variation in the A-exciton energy value needs to be studied in detail.
Energy of A-exciton in PL spectrum for WS2 in the literature.

There has been ample research dedicated to developing methods to produce isolated monolayers of TMDs, mainly through mechanical and chemical exfoliation. Reference Mak, Lee, Hone, Shan and Heinz8,Reference Novoselov, Jiang, Schedin, Booth, Khotkevich, Morozov and Geim22–Reference Joensen, Frindt and Morrison27 While natural crystals may have contamination (Re, Nb, etc.), Reference Golasa, Grzeszczyk, Korona, Bozek, Binder, Szczytko, Wysmolek and Babinski28 mechanical exfoliation of crystals grown by chemical vapor transport (CVT) Reference Schäfer, Grofe and Trenkel29,Reference Lieth30 often provides better quality materials. Chemical exfoliation also has the potential to produce high-quality material, but the reaction needed for the exfoliation often damages the layers and the yield is usually low. Reference Nicolosi, Chhowalla, Kanatzidis, Strano and Coleman31,Reference Dresselhaus and Dresselhaus32 Recently, chemical vapor deposition (CVD) methods have been established to produce both monolayered triangular islands Reference Gutierrez, Perea-Lopez, Elias, Berkdemir, Wang, Lv, Lopez-Urias, Crespi, Terrones and Terrones13,Reference van der Zande, Huang, Chenet, Berkelbach, You, Lee, Heinz, Reichman, Muller and Hone33,Reference Shaw, Zhou, Chen, Weiss, Liu, Huang and Duan34 as well as large-area films of TMDs. Reference Elias, Perea-Lopez, Castro-Beltran, Berkdemir, Lv, Feng, Long, Hayashi, Kim, Endo, Gutierrez, Pradhan, Balicas, Houk, Lopez-Urias, Terrones and Terrones14,Reference Orofeo, Suzuki, Sekine and Hibino15,Reference Kang, Xie, Huang, Han, Huang, Mak, Kim, Muller and Park35 Although most of the focus has pertained to single- and few-layered MoS2, Reference Mak, Lee, Hone, Shan and Heinz8,Reference Eda, Yamaguchi, Voiry, Fujita, Chen and Chhowalla23,Reference Splendiani, Sun, Zhang, Li, Kim, Chim, Galli and Wang36 CVD-grown triangular islands of WS2 were shown to have an extraordinarily high PL intensity along their edges. Reference Gutierrez, Perea-Lopez, Elias, Berkdemir, Wang, Lv, Lopez-Urias, Crespi, Terrones and Terrones13 Through the isolation of few-layered semiconducting TMDs, researchers have been able to gain a better understanding of their physico–chemical properties including transport, Reference Baugher, Churchill, Yang and Jarillo-Herrero37–Reference Amani, Chin, Birdwell, O'Regan, Najmaei, Liu, Ajayan, Lou and Dubey39 photocurrent, Reference Perea-Lopez, Elias, Berkdemir, Castro-Beltran, Gutierrez, Feng, Lv, Hayashi, Lopez-Urias, Ghosh, Muchharla, Talapatra, Terrones and Terrones40–Reference Britnell, Ribeiro, Eckmann, Jalil, Belle, Mishchenko, Kim, Gorbachev, Georgiou, Morozov, Grigorenko, Geim, Casiraghi, Castro Neto and Novoselov44 PL, Reference Mak, Lee, Hone, Shan and Heinz8,Reference Gutierrez, Perea-Lopez, Elias, Berkdemir, Wang, Lv, Lopez-Urias, Crespi, Terrones and Terrones13,Reference Eda, Yamaguchi, Voiry, Fujita, Chen and Chhowalla23 magnetism, Reference Ma, Dai, Guo, Niu, Lu and Huang45,Reference Zhang, Zou, Crespi and Yakobson46 valley polarization, Reference Mak, He, Shan and Heinz47 and valley Hall-effect. Reference Mak, McGill, Park and McEuen48
Advances in the synthesis of highly crystalline and large area two-dimensional (2D) materials, including semiconducting TMDs and graphene, are vital for applications of these materials to be feasible. It was only recently that researchers were able to demonstrate wafer scale homogeneity for monolayered MoS2 grown by metal–organic CVD. Reference Kang, Xie, Huang, Han, Huang, Mak, Kim, Muller and Park35 However, it has been well observed for 2D materials that the properties of CVD-grown materials are usually not on par with exfoliated samples from highly oriented crystals. The most notable is the degradation of the carrier mobility which is dependent on the growth conditions, Reference Hao, Bharathi, Wang, Liu, Chen, Nie, Wang, Chou, Tan, Fallahazad, Ramanarayan, Magnuson, Tutuc, Yakobson, McCarty, Zhang, Kim, Hone, Colombo and Ruoff49,Reference Vlassiouk, Regmi, Fulvio, Dai, Datskos, Eres and Smirnov50 growth substrate, Reference Wood, Schmucker, Lyons, Pop and Lyding51,Reference Li, Cai, Colombo and Ruoff52 transfer method, Reference Shin, Yoon, Mun, Kim, Choi, Kim and Cho53 and transferred substrate. Reference Dean, Young, Meric, Lee, Wang, Sorgenfrei, Watanabe, Taniguchi, Kim, Shepard and Hone3 Generally speaking, a synthesized material could be subject to chemical impurities, Reference Casiraghi, Pisana, Novoselov, Geim and Ferrari54,Reference Casiraghi55 strain, Reference Ji, Zhang, Gao, Zhang, Ma, Liu, Chen, Qiao, Tan, Kan, Feng, Sun and Liu56,Reference Amani, Chin, Mazzoni, Burke, Najmaei, Ajayan, Lou and Dubey57 structural defects, Reference Zhou, Zou, Najmaei, Liu, Shi, Kong, Lou, Ajayan, Yakobson and Idrobo58 grain boundaries, Reference van der Zande, Huang, Chenet, Berkelbach, You, Lee, Heinz, Reichman, Muller and Hone33,Reference Azizi, Zou, Ercuis, Zhang, Elias, Perea-Lopez, Terrones, Yakobson and Alem59 etc. which can all lead to deterioration of its physico–chemical properties and poses the question of how the growth method influences the resulting material's properties. Thus, an understanding of the correlation between the diverse sample preparation approaches and the resulting material's properties is essential for TMD materials to be integrated into technology in a reliable manner.
Both Raman spectroscopy and PL measurements have proven to be useful, sensitive, and noninvasive tools to study small changes in graphene and semiconducting TMDs, such as the number of layers, Reference Berkdemir, Gutierrez, Botello-Mendez, Perea-Lopez, Elias, Chia, Wang, Crespi, Lopez-Urias, Charlier, Terrones and Terrones6,Reference Mak, Lee, Hone, Shan and Heinz8,Reference Ferrari, Meyer, Scardaci, Casiraghi, Lazzeri, Mauri, Piscanec, Jiang, Novoselov, Roth and Geim60–Reference Lee, Yan, Brus, Heinz, Hone and Ryu62 strain, Reference Ni, Yu, Lu, Wang, Feng and Shen63–Reference Desai, Seol, Kang, Fang, Battaglia, Kapadia, Ager, Guo and Javey67 and doping/defects. Reference Ferrari68–Reference Mak, He, Lee, Lee, Hone, Heinz and Shan70 Due to their sensitive response to changes in the material's structure, monitoring and comparing the Raman and PL spectra of WS2 monolayers made from various approaches can lead to important information about the quality of the material as well as other insights. In this paper, an in-depth analysis of the Raman and PL spectra is completed for three different types of monolayered samples of WS2: mechanically exfoliated flakes from CVT-grown crystals, CVD-grown triangular islands, and CVD-grown large area films to investigate how these growth methods influence the resulting optical properties. Interestingly, we demonstrate that despite the similarities among the Raman spectra, the PL spectra of monolayered WS2 produced by the three different methods vary drastically. Therefore, PL is much more sensitive to the quality of the material than Raman scattering and can thus be more reliably used to determine the degree of crystallinity in semiconducting TMDs. To the best of our knowledge, no other study has looked closely into the similarities and differences of the Raman/PL of WS2 produced by multiple methods. This study also provides the scientific community much to consider when analyzing the optical properties of other monolayers and heterostructures of TMDs.
II. EXPERIMENTAL PROCEDURES
A. Sample synthesis
Three different methods of producing monolayers of WS2 were used for this study, including mechanical exfoliation of CVT crystals, Reference Schäfer, Grofe and Trenkel29,Reference Lieth30 CVD-grown monocrystalline triangular islands, Reference Gutierrez, Perea-Lopez, Elias, Berkdemir, Wang, Lv, Lopez-Urias, Crespi, Terrones and Terrones13 and CVD-grown polycrystalline large area films. Reference Elias, Perea-Lopez, Castro-Beltran, Berkdemir, Lv, Feng, Long, Hayashi, Kim, Endo, Gutierrez, Pradhan, Balicas, Houk, Lopez-Urias, Terrones and Terrones14 For the mechanically exfoliated samples, two types of crystals were grown via different experimental conditions. “Type 1” crystals were grown from a commercial WS2 powder (Strem Chemicals, Newburyport, Massachusetts, 99.5%) while the WS2 powder used to grow “Type 2” crystals was synthesized by heating a mixture containing stoichiometric amounts of tungsten (Acros Organics, Morris Plains, New Jersey, 99.9%) and sulfur (J. T. Baker Chemical Co., Phillipsburg, New Jersey) at 1000 °C for 12 h to avoid any explosion from vaporizing the sulfur too quickly. Both types of crystals were grown from their respective powders using CVT Reference Schäfer, Grofe and Trenkel29,Reference Lieth30 with iodine (Sigma-Aldrich, St. Louis, Missouri, 99.8+%) as the transport gas at 10/1.5 mg/cm3 for 10 days in an evacuated and sealed quartz ampoule (10 mm inner diameter (ID), 12 mm outer diameter (OD), 215.9/100 mm length) for “Type 1”/“Type2” crystals, respectively. The source and growth zones were kept at 950 and 816 °C for “Type 1” and 900 and 840 °C for “Type 2” crystals, respectively. The resulting crystals were washed with hexane and dried under vacuum to remove any residual iodine. Afterward, mechanical exfoliation was performed via the scotch tape method and the micron sized flakes were transferred onto a SiO2/Si substrate. Reference Novoselov, Jiang, Schedin, Booth, Khotkevich, Morozov and Geim22
As previously reported, WS2 triangular islands were grown using a two-step sulfurization method. Reference Gutierrez, Perea-Lopez, Elias, Berkdemir, Wang, Lv, Lopez-Urias, Crespi, Terrones and Terrones13 Approximately 1 nm of tungsten trioxide (WO3 [Alfa Aesar, Ward Hill, Massachusetts], 99.998%) was thermally evaporated onto a SiO2/Si substrate followed by sulfurization (Alfa Aesar, 99.5%) at atmospheric-pressure (APCVD) and relatively high temperatures (∼800 °C). To produce the CVD monolayered films, the same two step procedure was followed, yet a vacuum pump was used to produce a low-pressure atmosphere (LPCVD), as it was also reported previously. Reference Elias, Perea-Lopez, Castro-Beltran, Berkdemir, Lv, Feng, Long, Hayashi, Kim, Endo, Gutierrez, Pradhan, Balicas, Houk, Lopez-Urias, Terrones and Terrones14
B. Sample characterization
X-ray powder diffraction (XRD) was measured using a PANalytical Empryean (Westborough, Massachusetts) with a copper source, 10 mm beam mask, and 1/2° divergence slit. Environmental scanning electron microscopy (ESEM) was performed in a FEI Quanta 200 ESEM (FEI Company, Hillsboro, Oregon) equipped with an Energy dispersive x-ray detector (EDS). The height of the WS2 monolayered flakes (both exfoliated and CVD-grown) was verified using atomic force microscopy (AFM) with an Asylum Research MFP-3D AFM (Santa Barbara, California) in tapping mode (not shown here). These WS2 monolayers were then characterized by Raman and PL spectroscopies performed in a Renishaw in-Via confocal microscope-based Raman spectrometer (Hoffman Estates, Illinois) with a spectral resolution better than 1 cm−1. Both 488 and 514.5 nm laser excitation wavelengths were used with the laser power under 0.2 mW to prevent heating and damage of the sample. All of the Raman and PL measurements were taken at room temperature and ambient pressure. Aberration-corrected scanning transmission electron microscopy (STEM) studies were conducted on the LPCVD-grown WS2 films transferred onto quantifoil gold transmission electron microscopy (TEM) grids using a medium-angle annular dark field detector (MAADF) in a Nion UltraSTEM 100 operated at 60 keV (Kirkland, Washington). High resolution transmission electron microscopy (HR-TEM) and STEM studies were also conducted on APCVD-grown WS2 triangles transferred onto quantifoil gold TEM grids using a JEOL JEM-2010F at 200 keV (JEOL Ltd., Tokyo, Japan) and a FEI Titan3 G2 60-300 S/TEM at 80 keV. For high magnification HR-TEM images, a monochromated electron beam [0.1 eV full width at half maximum (FWHM)] was used. For the STEM imaging on the APCVD triangles, a high-angle annular dark field (HAADF) detector was used. The irradiation of exfoliated WS2 monolayers was performed with a low energy Ar+ ion beam using an integrated ion source in a Kurt J. Lesker Lab-18 system (Jefferson Hills, Pennsylvania) at different voltages to get different dosages. The emission current I e, the discharge voltage V, and the duration of the irradiation time t were respectively I e = 0.4 A, V = 25, 50, or 75 V, and t = 2 s.
III. RESULTS & DICUSSIONS
A. Analysis of bulk characterization for CVT-grown crystals
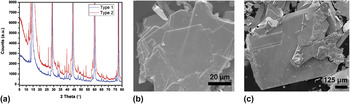
The WS2 bulk crystals were first analyzed using XRD. From the XRD patterns, shown in Fig. 1(a), both “Type 1” and “Type 2” crystals contained the 2-H and 3-R phases Reference Chhowalla, Shin, Eda, Li, Loh and Zhang7 (the pure 2-H and 3-R XRD patterns can be found in Fig. S1). From Fig. 1(a), there appeared to be little difference between the two crystals. ESEM analysis exhibited a broad range of microcrystal sizes, ranging from a few μm for “Type 1” [Fig. 1(b)] to as large as ∼500 μm for “Type 2” crystals [Fig. 1(c)]. EDS was used to confirm the presence of tungsten and sulfur in the desired stoichiometric concentrations for the synthesized WS2 crystals (Tables S1 and S2). In addition, EDS mappings exhibited an even distribution of tungsten and sulfur throughout both “Type 1” and “Type 2” crystals (see Fig. S2). From these bulk characterization techniques, “Type 1” and “Type 2” flakes were very similar.
(a) XRD for both “Type 1” and “Type 2” crystals. SEM image of (b) “Type 1” and (c) “Type 2” crystals.

B. Analysis of the Raman spectra
As previously reported,
Reference Berkdemir, Gutierrez, Botello-Mendez, Perea-Lopez, Elias, Chia, Wang, Crespi, Lopez-Urias, Charlier, Terrones and Terrones6
monolayers of WS2 can be easily identified by a resonant Raman feature, the 2LA(M) peak, when exciting the sample with a 514.5 nm laser. Figure 2 shows the characteristic Raman spectra of monolayered WS2 using two different laser excitations, λ = 514.5 nm and λ = 488 nm. For the spectra obtained using the 488 nm laser, the dominating peaks were the first order modes LA(M) at 175 cm−1, E′ at 356 cm−1, and
 ${\rm{A'_1}}$
at 418 cm−1.
Reference Berkdemir, Gutierrez, Botello-Mendez, Perea-Lopez, Elias, Chia, Wang, Crespi, Lopez-Urias, Charlier, Terrones and Terrones6
It should be noted that this is the correct labeling of the Raman peaks for monolayered WS2, which lacks inversion symmetry and cannot be labeled as A1g and
 ${\rm{E}}_{2{\rm{g}}}^1$
because its vibrational modes belong to the D3h point group.
Reference Terrones, Del Corro, Feng, Poumirol, Rhodes, Smirnov, Pradhan, Lin, Nguyen, Elias, Mallouk, Balicas, Pimenta and Terrones71
For an even number of layers, the modes belong to the D3d point group that does exhibit a center of inversion. Thus, the labeling of the peaks switches between
 ${\rm{A'_1}}$
, E′ for an odd and A1g,
 $E_{2{\rm{g}}}^1$
for an even number of layers.
Reference Terrones, Del Corro, Feng, Poumirol, Rhodes, Smirnov, Pradhan, Lin, Nguyen, Elias, Mallouk, Balicas, Pimenta and Terrones71
Compared to the spectra obtained using the 488 nm excitation, exciting with the 514.5 nm laser introduced many new second-order and other combination peaks. In addition, at this excitation the 2LA(M) peak height dramatically increased to approximately twice the height of
 ${\rm{A'_1}}$
due to a double resonance process.
Reference Berkdemir, Gutierrez, Botello-Mendez, Perea-Lopez, Elias, Chia, Wang, Crespi, Lopez-Urias, Charlier, Terrones and Terrones6
Although the 2LA(M) in resonance overlapped the E′ peak, performing a Lorentzian curve fitting could distinguish between the two peaks. This resonance of the 2LA(M) is only seen in monolayered WS2, and therefore provides a facile way to identify monolayered WS2.
Raman spectra of monolayered WS2 flake with (a) 514.5 nm and (b) 488 nm laser excitations, including Lorentzian peak fits (in green).

The Raman spectra for monolayered WS2 films grown by LPCVD, triangles grown by APCVD, and flakes from “Type 1” and “Type 2” bulk crystals grown by CVT using different parameters are shown in Fig. 3(a), where the spectra were normalized to the intensity of the
 ${\rm{A'_1}}$
mode. The positions, intensities, and FWHM of the main Raman peaks are detailed in Table II. The Raman spectra for the five different monolayered areas looked similar. One noticeable difference was the intensity of LA(M) − I(LA)—with respect to the intensity of
 ${\rm{A'_1}}$
which varied between the samples and was higher for the LPCVD film and very prominent for the “Type 1” exfoliated flake. From the phonon dispersion,
Reference Mignuzzi, Pollard, Bonini, Brennan, Gilmore, Pimenta, Richards and Roy72
this peak is due to longitudinal acoustic (LA) phonons at the edge of the Brillouin zone (M point) and has recently been attributed to the presence of defects that are able to satisfy the q = 0 Raman selection rule in MoS2 irradiated samples by Mignuzzi et al.
Reference Mignuzzi, Pollard, Bonini, Brennan, Gilmore, Pimenta, Richards and Roy72
They studied the intensity of the LA(M) peak as a function of ion-bombardment and found that the intensity ratio of the LA(M) and one of the first order modes followed the trend,
 ${{I\left( {{\rm{LA}}} \right)} \over {I\left( X \right)}} = {{C\left( X \right)} \over {L_{\rm{D}}^2}}$
, where
 $X{\rm{ = }}{\rm{A'_1}}$
or E′ and L
D is the average interdefect distance. Thus, it is inferred that the prominent LA(M) for the LPCVD films and “Type 1” exfoliated flakes indicates that they possessed a large number of defects. The presence of the large I(LA) in the LPCVD films could be attributed to sulfur vacancies, edges, regions of few-layered stackings, dislocation cores, and grain boundaries
Reference Azizi, Zou, Ercuis, Zhang, Elias, Perea-Lopez, Terrones, Yakobson and Alem59
in the LPCVD films that were seen during STEM analysis of the WS2 films, as shown in Fig. 4. Lattice imperfections and unintentional doping were the most likely causes for the intense LA(M) in CVT-grown “Type 1” crystals. This unintentional doping could have been due to either impurities in the tungsten used to make the crystal (commercially bought, 99.5% pure) or from the iodine used as a carrier transport
Reference Pisoni, Jacimovic, Barisic, Walter, Nafradi, Bugnon, Magrez, Berger, Revay and Forro73,Reference Legma, Vacquier and Casalot74
considering the “Type 1” crystals were grown using significantly more iodine (10 mg/cm3 when compared to 1.5 mg/cm3 for “Type 2”), resulting in a higher transport rate. EDS did not detect the presence of iodine, however, implying that the concentration is under the detection limit of the tool. Although the LA(M) was not as intense for the APCVD-grown triangles, many defects could still be found in these types of samples through TEM and STEM analysis. As shown in Fig. 5, defects such as triangular vacancies, ∼1 nm size vacancies, sulfur vacancies, di-sulfur vacancies, and WS
x
vacancies were all observable in triangles grown via APCVD. It can also be noticed from Table II that the I(LA) was slightly higher at the center of the APCVD triangles than on the edge, indicating that the center contained more defects than the edge, as will be further discussed below when studying the PL. Due to difficulty in transferring the exfoliated monolayered flakes to TEM grids, we were unable to show TEM/STEM analysis of the CVT-grown crystals.
Comparison of (a) Raman and (b and c) PL spectra for different monolayered WS2 samples. Laser wavelength is 514.5 nm for Raman and 488 nm for PL measurements. For (b), the PL intensity is normalized to 1 whereas in (c), the PL intensity is normalized to the
 ${\rm{A'_1}}$
Raman intensity.

Raman peak positions, intensities (normalized to
 ${\rm{A'_1}}$
), and FWHM for different samples of monolayered WS2 using 514 nm laser excitation.

Aberration-corrected MAADF-STEM on LPCVD-grown WS2 films. (a) shows a lower magnification image of a monolayered area surrounded by few-layered regions, (b) a higher magnification image of (a), and (c) demonstrates vacancies as well as dislocation cores found in these films.

Different defects found in APCVD-grown WS2 triangles via aberration-corrected TEM and HAADF-STEM analysis. (a) Low magnification TEM image of triangular vacancy, (b) magnified triangular vacancy, (c) TEM image of ∼1 nm size vacancy, (d) TEM image of an atomic sulfur vacancy, (e) STEM image of a di-sulfur vacancy, and (f) STEM image of a WS x vacancy.

While Mignuzzi et al. observed a clear correlation between the E′ and
 ${\rm{A'_1}}$
FWHM and the I(LA),
Reference Mignuzzi, Pollard, Bonini, Brennan, Gilmore, Pimenta, Richards and Roy72
this was not observed in the samples studied herein. For example, the edge of the triangle displayed the second largest
 ${\rm{A'_1}}$
FWHM of the samples while its I(LA) was nearly the smallest. It is still unclear as to why this is but further studies are underway. There was also a trend in the intensity of the second order of LA(M), which is denoted as 2LA(M), with respect to the
 ${\rm{A'_1}}$
, or I(2LA), between the samples. The intensity of 2LA(M) was the greatest for the “Type 2” exfoliated flake, yet it was smallest for the LPCVD-grown films. It also varied, though less dramatically, between the center and edge of the triangles which could possibly be due to strain caused by the substrate adhesion of as-grown samples or a stoichiometric composition (e.g., S deficiency). The intensities of the LA(M) and 2LA(M) modes did not appear to be strongly correlated in our samples.
The Raman spectrum of the LPCVD-grown film exhibited a few notable features, such as a large silicon peak that could be due to holes in the film as well as shifts in the Raman modes. While the blueshift in the
 ${\rm{A'_1}}$
frequency (by approximately 1–1.5 cm−1) for the LPCVD-grown films compared to the other samples could be an effect of bilayers or trilayers present, the blueshift of the 2LA(M) and E′ by approximately 1.5–2.5 cm−1 cannot be explained by the presence of thicker layers as these have been shown to decrease the frequency of these modes.
Reference Berkdemir, Gutierrez, Botello-Mendez, Perea-Lopez, Elias, Chia, Wang, Crespi, Lopez-Urias, Charlier, Terrones and Terrones6
The blueshift in the modes for the LPCVD film could be due to compressive strain or doping at the grain boundaries that were present in the film.
Reference van der Zande, Huang, Chenet, Berkelbach, You, Lee, Heinz, Reichman, Muller and Hone33,Reference Azizi, Zou, Ercuis, Zhang, Elias, Perea-Lopez, Terrones, Yakobson and Alem59
For the APCVD-grown triangular islands, a distinct feature that arose when comparing the Raman spectra to the other samples was a shoulder around 485 cm−1 [marked with an orange asterik in Fig. 3(a)] for both the center and the edge of the triangular islands that was not present in the other studied samples. To the best of our knowledge, this shoulder has not been addressed in the literature and could be related to a combination mode. Its relation to defects is questionable since the shoulder was stronger for the edge of the triangle where I(LA) is smaller, suggesting fewer defects. Further studies are currently underway.
C. Analysis of the PL spectra
Figures 3(b) and 3(c) show the PL for all of the samples where the intensity was normalized to unity [Fig. 3(b)] and to the intensity of
 ${\rm{A'_1}}$
[Fig. 3(c)]. Remarkably, while the Raman spectra of the samples looked similar, the PL spectra drastically differed in intensity, position, FWHM, and number of peaks for the different types of samples. In fact, the PL spectra were even dramatically different between samples grown via the same synthesis method, i.e., center versus edge of the triangular island and “Type 1” versus “Type 2” of exfoliated flakes. For example, the PL of “Type 1” exfoliated flakes displayed a second peak at energies below that of the A-exciton that was absent in “Type 2” flakes, even though the XRD and EDS characterization of the two crystals showed very similar results. Figure 3(c) compares the relative intensity of the PL spectra. It can be observed that “Type 2” flakes exhibited the highest A-exciton intensity, followed by the edge of the APCVD-grown triangle. The “Type 1” flake and the center of the triangle displayed around the same intensity while the intensity for the LPCVD-grown film was so low that it could not be seen on the same scale as the others. The low PL in the LPCVD-grown films could have been due to the presence of bi- and trilayered WS2 domains [Figs. 4(a) and 4(b)] or quenching due to grain boundaries
Reference Azizi, Zou, Ercuis, Zhang, Elias, Perea-Lopez, Terrones, Yakobson and Alem59
since the sample was polycrystalline. The intensity difference in the other four monolayered areas were most likely due to defects, as will be discussed below.
Next, the uniformity of the PL intensity was studied for “Type 2” flakes, the LPCVD films, and the APCVD triangular islands, the results of which are shown in Fig. 6. While both of the exfoliated flakes (shown optically in Fig. S3) and the LPCVD film had a relatively constant PL (except for possible few-layered areas in the film), the triangular islands had significantly higher PL on the edges. It has been shown by Peimyoo et al. Reference Peimyoo, Shang, Cong, Shen, Wu, Yeow and Yu75 that changing the experimental conditions through which the triangles are grown—such as the sulfur temperature—can lead to triangles that display either spatially uniform or nonuniform (edge-enhanced) PL. Using time-resolved and temperature dependent PL studies, they concluded that the nonuniform features in the PL were due to midgap states induced by structural imperfections and charged defects that quenched and shifted the PL in the center of the triangle. This conclusion was supported by our data, in which I(LA) was higher in the center than the edge of the triangle, thus indicating the presence of more disorder as discussed above.
(a) PL mapping of a mechanically exfoliated WS2 flake on a SiO2/Si substrate. (b) PL mapping of a LPCVD-grown film. Reprinted with permission from Ref. Reference Elias, Perea-Lopez, Castro-Beltran, Berkdemir, Lv, Feng, Long, Hayashi, Kim, Endo, Gutierrez, Pradhan, Balicas, Houk, Lopez-Urias, Terrones and Terrones14 (Copyright 2013 American Chemical Society), (c) PL mapping of a triangular island showing edge enhanced PL. Reprinted with permission from Ref. Reference Gutierrez, Perea-Lopez, Elias, Berkdemir, Wang, Lv, Lopez-Urias, Crespi, Terrones and Terrones13 (Copyright 2013 American Chemical Society).

The position of the A-exciton ranged from 1.92 eV at the center of the triangles to 2.02 eV for the films and the “Type 2” exfoliated flake, which was within the energy range detailed in Table I from previous literature. For the triangular islands studied here, the A-exciton PL energy was higher on the edge than in the center, which was opposite to previous findings. Reference Gutierrez, Perea-Lopez, Elias, Berkdemir, Wang, Lv, Lopez-Urias, Crespi, Terrones and Terrones13,Reference Peimyoo, Shang, Cong, Shen, Wu, Yeow and Yu75 It should be noted that for various samples of APCVD-grown triangular islands, the position of the PL A-exciton peak varied between 1.95–2.01 eV for both the edge and the center of the triangle. Reference Gutierrez, Perea-Lopez, Elias, Berkdemir, Wang, Lv, Lopez-Urias, Crespi, Terrones and Terrones13 Furthermore, some samples did not show any significant difference in the PL energy value between the edge and center, even when the intensity of the PL was enhanced on the edges. In addition to position and intensity, the FWHM was also dependent on the synthesis method, as is apparent from Fig. 3(b). The FWHM of the LPCVD film was significantly larger than that of other four samples. The edge of the triangle and “Type 2” exfoliated flake showed the smallest FWHM (∼30 meV) whereas the FWHM for the center of the triangle (∼52 meV) and “Type 1” flake (∼63 meV) were approximately twice as large, once again indicating the larger presence of defects in these areas. Reference Mouri, Miyauchi and Matsuda76,Reference Sercombe, Schwarz, Del Pozo-Zamudio, Liu, Robinson, Chekhovich, Tartakovskii, Kolosov and Tartakovskii77 It has been demonstrated by Najmaei et al. Reference Najmaei, Liu, Zhou, Zou, Shi, Lei, Yakobson, Idrobo, Ajayan and Lou78 that impurities, including substrate edges, dust particles, scratches, rough surfaces, or step edges, commonly serve as nucleation sites for MoS2 triangular islands. Thus, these nucleation impurities for the growth of our monolayered WS2 triangles could have been one of the reasons for lower crystallinity in the center of the triangles.
The most surprising differences in the PL were between the two types of exfoliated flakes obtained from the CVT crystals grown differently. While “Type 2” flakes displayed a single PL peak, “Type 1” also had an additional peak located at a lower energy (∼1.88 eV) which was most likely related to defects, corroborated by the high intensity of the LA(M) mode in this flake. K. Golasa et al. Reference Golasa, Grzeszczyk, Korona, Bozek, Binder, Szczytko, Wysmolek and Babinski28 also reported simultaneous observation of a low energy PL tail and high intensity LA(M) Raman mode in MoS2 that was mechanically exfoliated from naturally occurring ore, both of which were attributed to defects. In addition, reports in the literature have concluded that a second PL peak is due to charged excitons (trions, XT) and is due to extra charges in the WS2. Reference Mitioglu, Plochocka, Jadczak, Escoffier, Rikken, Kulyuk and Maude20,Reference Mak, He, Lee, Lee, Hone, Heinz and Shan70 However, the trion peak is usually observed 20–50 meV from the A-exciton peak. Reference Mitioglu, Plochocka, Jadczak, Escoffier, Rikken, Kulyuk and Maude20,Reference Mak, He, Lee, Lee, Hone, Heinz and Shan70,Reference Jones, Yu, Ross, Klement, Ghimire, Yan, Mandrus, Yao and Xu79–Reference Lin, Han, Wang, Wang, Xiang, Qin, Zhang, Wang, Zhang, Wee and Chen81 Therefore, although the trion peak could be found in all of the samples studied here (see Table III), the additional peak in “Type 1” samples cannot be attributed to trions since it was approximately 150 meV from the A-exciton. Thus, we attributed this low energy peak to bound excitons (XD) in which lattice defects act as effective traps for the excitons and lead to emission energies that are lower than the band-to-band optical transition. Reference Tongay, Suh, Ataca, Fan, Luce, Kang, Liu, Ko, Raghunathanan, Zhou, Ogletree, Li, Grossman and Wu82,Reference Chow, Jacobs-Gedrim, Gao, Lu, Yu, Terrones and Koratkar83 Bound excitons have been observed in monolayered WS2 at energies around ∼1.8 eV through α-particle irradiation (only at temperatures below 250 °C and in N2 atmosphere) Reference Tongay, Suh, Ataca, Fan, Luce, Kang, Liu, Ko, Raghunathanan, Zhou, Ogletree, Li, Grossman and Wu82 and plasma treatments (ambient pressure and room temperature), Reference Chow, Jacobs-Gedrim, Gao, Lu, Yu, Terrones and Koratkar83 but they have not been observed in as-grown WS2 and especially at room temperature.
Peak positions, intensities (normalized to
 ${\rm{A'_1}}$
), and FWHM using 488 nm laser excitation for the A-exciton, trion (XT), and bound exciton (XD) in the different samples of WS2. The spectra were fit using Lorentzian functions.

To further elucidate the cause of the lower energy peak at 1.88 eV in the PL of “Type 1” flakes, we performed irradiation of exfoliated “Type 2” WS2 monolayers using a low energy Ar+ ion beam as described in the experimental procedures above. The PL results are shown in Fig. 7. The pristine WS2 monolayer PL spectra showed a strong A-exciton with a small low energy tail due to trions. As the defects created by the irradiation increased, a secondary peak around 1.87 eV appeared and increased in intensity while the A-exciton shifted to a lower energy. This was similar to the PL of the “Type 1” flakes in Figs. 3(b) and 3(c), in which the secondary peak was around 1.88 eV. This similarity further supported bound excitons as the origin of the lower energy peak in “Type 1” flakes where excitons bind to lattice defects, such as vacancies. However, even at 50 V of irradiation, the secondary peak intensity was still only half of that of the main peak, whereas the secondary peak in the “Type 1” exfoliated flakes could be as high as the A-exciton peak. Raman spectra obtained when using both λ = 488 and 514 nm laser excitation wavelengths (Fig. S4) were also studied as a function of irradiation voltage. Besides a decrease in overall intensities, a decrease in the position of the E′ and
 ${\rm{A'_1}}$
modes for 75 V of up to 2 cm−1 was observed in addition to an increase in the LA(M) intensity (with respect to the intensity of
 ${\rm{A'_1}}$
), further supporting the large presence of defects.
PL of exfoliated WS2 for different irradiation voltages. Laser excitation is 488 nm.

D. Connecting the LA(M) and defect peak energy
The bound exciton defect peak was observed in multiple monolayered flakes from the same CVT-grown batch of crystals (“Type 1”) with varying intensities and positions, as shown in Fig. 8(a). In Fig. 8(b), it can be seen that the energy separation between the A-exciton and XD (labeled Peak A and X, respectively) varied between different flakes [and within the same flake, though this is not shown in Fig. 8(b)]. When comparing the Raman spectra (λ = 514 nm) of these flakes, the intensity of the LA(M) [with respect to I(
 ${\rm{A'_1}}$
), or I(LA), shown in Fig. 8(c)] was higher for flakes in which the spacing between Peak A and Peak X was the greatest, as opposed to flakes with a higher Peak X to Peak A intensity ratio. To further show that the position of Peak X relative to Peak A was a more conclusive way to determine the degree of crystallinity in the sample, the Raman and PL spectra for nine different monolayered areas from the “Type 1” crystals were studied. The peak energies and I(Peak X)/I(Peak A) as a function of I(LA) are shown in Figs. 8(d) and 8(e), respectively, where the PL spectra were fit using two Lorentzian curves. While there was a clear decrease in the energies of Peak A and Peak X as a function of I(LA), there was no such trend for the intensity ratio of the peaks. Figure 8(d) also shows that the energy separation between the peaks increased as the disorder increased [I(LA) increases]. In addition, the energies of Peak A and Peak X as a function of I(2LA + E′), which was the intensity of the convolution of 2LA(M) and E′ modes, were also studied. The covoluted intensity was used since the overlapping of the two peaks increased the error in the 2LA(M) fitting. As can be seen in Fig. 8(f), Peak A and Peak X also showed a decrease in energy as well as an increase in separation as I(2LA) decreases. Thus, it was concluded that the energy separation between the A-exciton and bound exciton provides a more reliable way to determine the amount of disorder present in the sample than the sole intensity of the bound exciton peak.
Further study of the defect peak in “Type 1” exfoliated monolayered flakes. (a), (b) The intensity and position of both the A-exciton (Peak A) and the defect peak (Peak X) varied in different monolayered flakes. (c) In addition, the intensity of LA(M) (with respect to the intensity of
 ${\rm{A'_1}}$
) also varied between the samples. From (d), it can be seen that the energy of both Peak A and Peak X decreased as a function of
 ${{I\left( {{\rm{LA}}} \right)} \mathord{\left/ {\vphantom {{I\left( {{\rm{LA}}} \right)} {I\left( {{\rm{A'}}_1 } \right)}}} \right. \kern-\nulldelimiterspace} {I\left( {{\rm{A'_1}} } \right)}}$
and that the spacing between the two peaks increased as
 ${{I\left( {{\rm{LA}}} \right)} \mathord{\left/ {\vphantom {{I\left( {{\rm{LA}}} \right)} {I\left( {{\rm{A'}}_1 } \right)}}} \right. \kern-\nulldelimiterspace} {I\left( {{\rm{A'_1}} } \right)}}$
increased. This was contrasted with the intensity ratio of Peak X and Peak A, or I(Peak X)/I(Peak A), as shown in (e), that did not follow a trend with respect to
 ${{I\left( {{\rm{LA}}} \right)} \mathord{\left/ {\vphantom {{I\left( {{\rm{LA}}} \right)} {I\left( {{\rm{A'}}_1 } \right)}}} \right. \kern-\nulldelimiterspace} {I\left( {{\rm{A'_1}} } \right)}}$
. It was concluded that the energy spacing between the A-exciton peak and defect peak was indicative of the amount of defects instead of the intensity ratio between them. In (f), it was observed that there was also a trend between the energies of Peak A and Peak X and the intensity of 2LA(M) + E′, normalized to
 ${\rm{A'_1}}$
, where both energies decreased as the intensity of 2LA(M) + E′ decreased. The convolution of the two peaks was chosen due to the difficulty in curve fitting the overlapping peaks. The dashed lines in (d) and (f) are trend lines to guide the eyes.

E. Importance for heterostructures
One exciting prospect for 2D TMDs is the potential to create heterostructures out of two different materials, including alloys and in-plane or vertical heterostructures. Reference Bhimanapati, Lin, Meunier, Jung, Cha, Das, Xiao, Son, Strano, Cooper, Liang, Louie, Ringe, Zhou, Kim, Naik, Sumpter, Terrones, Xia, Wang, Zhu, Akinwande, Alem, Schuller, Schaak, Terrones and Robinson84–Reference Lv, Robinson, Schaak, Sun, Sun, Mallouk and Terrones88 It has been both theoretically predicted Reference Terrones, Lopez-Urias and Terrones89 and experimentally demonstrated Reference Ceballos, Bellus, Chiu and Zhao90,Reference Bellus, Ceballos, Chiu and Zhao91 that TMD heterostructures can have vastly different properties from their individual components. Thus, by carefully selecting specific 2D materials (including graphene, boron nitride, TMDs, etc.), layer ordering, and relative orientation, it is possible to control and engineer the properties of the resulting structure. Reference Geim and Grigorieval92,Reference Lui, Ye, Ji, Chiu, Chou, Andersen, Means-Shively, Anderson, Wu, Kidd, Lee and He93 Since the characterization of these heterostructures relies heavily on Raman and PL spectroscopy, we believe the results presented here will be of great relevance to the studies of heterostructures. For example, many reports in the literature on TMD heterostructures report PL spectra with two peaks corresponding to the A-excitons of the two different types of materials, Reference Ceballos, Bellus, Chiu and Zhao90,Reference Bellus, Ceballos, Chiu and Zhao91,Reference Lui, Ye, Ji, Chiu, Chou, Andersen, Means-Shively, Anderson, Wu, Kidd, Lee and He93–Reference Huo, Tongay, Guo, Li, Fan, Lu, Yang, Li, Li and Wei95 such as MoS2 and WS2. From our results on the disordered “Type 1” exfoliated flakes of WS2, we also observed two PL peaks around 1.97 and 1.88 eV. As we were studying a material of only WS2, it was clear that the lower energy peak was due to excitons binding with defects, causing PL emission with lower energy than the A-exciton. However, the energy of the bound exciton peak was close in energy to the A-exciton for monolayered MoS2. Reference Mak, Lee, Hone, Shan and Heinz8 If the material had been some combination of WS2 and MoS2, the origin of the lower energy peak would have been unclear as to whether it was due to defects or the presence of MoS2. Thus, our results indicate that special care needs to be taken when assigning the origin of peaks in the PL for heterostructures; other characterization techniques, such as Raman, XRD, X-ray photoelectron spectroscopy, TEM, etc. should also be performed to verify the structure of the hetero-material.
IV. CONCLUSIONS
One of the main challenges in understanding the properties and integrating TMDs into modern technology is the large scale production of highly crystalline material, whether it is via growth or exfoliation methods. In this study, we show that even for a single material WS2, the method with which it is produced has drastic effects on the PL, which will likely affect other properties such as electronic transport, photocurrent, magnetism, and valley polarization. By studying three different methods for producing monolayers of WS2, including mechanical exfoliation of CVT-grown crystals, LPCVD-grown large area films, and APCVD-grown triangular islands, it has been demonstrated that a “typical” Raman spectra is not as indicative of the material quality as the PL spectra. In particular, PL spectra of WS2 monolayers produced by different methods drastically differed in intensity, position, FWHM, and even the number of peaks. Variations in PL spectra and the intensity of the LA(M) in the Raman spectra were even seen between two different samples of exfoliated monolayers grown using different experimental CVT parameters, in which a second peak—most likely associated with defects—was observed for the WS2 crystals grown with a higher iodine flow, higher source zone temperature, and lower growth zone temperature. We conclude that although mechanical exfoliation of CVT crystals can be the most pristine method to produce monolayered WS2, it can also lead to the most defective material in terms of crystallinity when the crystal growth parameters are changed. In addition, the quality of the exfoliated material cannot be realized with bulk characterization techniques such as XRD or EDS but is instead more evident using Raman and PL spectroscopy. These results stress the importance of the growth experimental parameters for synthesizing highly crystalline material. This study demonstrates how the growth process can truly modify electronic and optical quality of the sample, and the results presented here will have an important impact on the future optical characterizations of these materials. Moreover, the analysis presented here will lead to the identification of defects in WS2 through Raman and PL spectroscopies for the first time, similar to what has been previously reported for MoS2.
Supplementary Material
To view supplementary material for this article, please visit http://dx.doi.org/10.1557/jmr.2016.47.
ACKNOWLEDGMENT
A.M., M.A.N., A.L.E., N.P.L, T.E.M., and M.T. acknowledge the financial support from the U.S. Army Research Office under the MURI ALNOS project No. W911NF-11-1-0362. J.W., J.Z., and M.T. were supported by the Center for Nanoscale Science, an NSF Materials Research Science and Engineering Center, under the award DMR-1420620. A.L.E. acknowledges the support from the National Science Foundation (EFRI-1433311). D.A.C. acknowledges funding through a user project supported by ORNL's Center for Nanophase Materials Science (CNMS) which is a Department of Energy, Office of Science User Facility. V.C. acknowledges support from The Brazilian National Council for Scientific and Technological Development (CNPq) - (249070/2013-8).