Introduction
The lillianite homologous series include numerous complex Ag–Pb–(Bi,Sb)-bearing sulfosalts and is derived from the structure of lillianite, Pb3Bi2S6. Members of this series have structures consisting of alternating layers of PbS archetype cut parallel to (311)PbS. The octahedra of adjacent, mirror-related layers are replaced by bicapped trigonal coordination prisms of PbS6+2 with the Pb atoms located on the mirror planes (e.g. Pažout, Reference Pažout2017). A detailed description of this series can be found in several publications (e.g. Makovicky and Karup-Møller, Reference Makovicky and Karup-Møller1977a; Makovicky and Topa, Reference Makovicky and Topa2014; Topa et al., Reference Topa, Makovicky, Stanley and Roberts2016; Pažout, Reference Pažout2017).
Existing members of the lillianite homologous series can be divided into the lillianite branch (Bi-dominant members) and the andorite branch (Sb-dominant members). They can be described as N1,N2L (L = lillianite homologue), where N1 and N2 are the numbers of octahedra for two adjacent sets of layers. They can be equal (known combinations for existing minerals are 4–4, 7–7, 8–8 or 11–11) or different (known combinations are 4–7, 4–8 and 5–9).
In the course of the study by scanning electron microscopy with energy-dispersive spectrometry (SEM-EDS) and ore microscopy of the old-collected samples of drill core from the Tarutinskoe (Tarutino) copper-skarn deposit, Southern Urals, Russia, we encountered a Ag–Pb–Bi sulfosalt with a stoichiometry differing from all the existing members of the lillianite homologous series. Subsequent investigations of its crystal structure in combination with wavelength-dispersive spectroscopy (WDS) showed this phase to be a new 7,8L member of the lillianite branch. It was named tarutinoite after its type locality. The new mineral, its name and symbol (Trtn) have been approved by the Commission on New Minerals, Nomenclature and Classification of the International Mineralogical Association (IMA2023–122, Kasatkin et al., Reference Kasatkin, Biagioni, Nestola, Škoda, Gurzhiy, Agakhanov and Kuznetsov2024). The holotype specimen is deposited in the systematic collection of the Fersman Mineralogical Museum of the Russian Academy of Sciences, Moscow, with the catalogue number 98571.
Occurrence and general appearance
The new mineral occurs at the Tarutinskoe (Tarutino) copper-skarn deposit, 9.5 km S of the Tarutino village, 220 km S of Chelyabinsk, Chesmensk district, Chelyabinsk Oblast, Southern Urals, Russia (53.70897° N, 61.02901° E) (Fig. 1).
The Tarutinskoe copper-skarn deposit. The soil areas are the result of prospecting workings. June 2015. Photo by Aleksey Podkorytov.

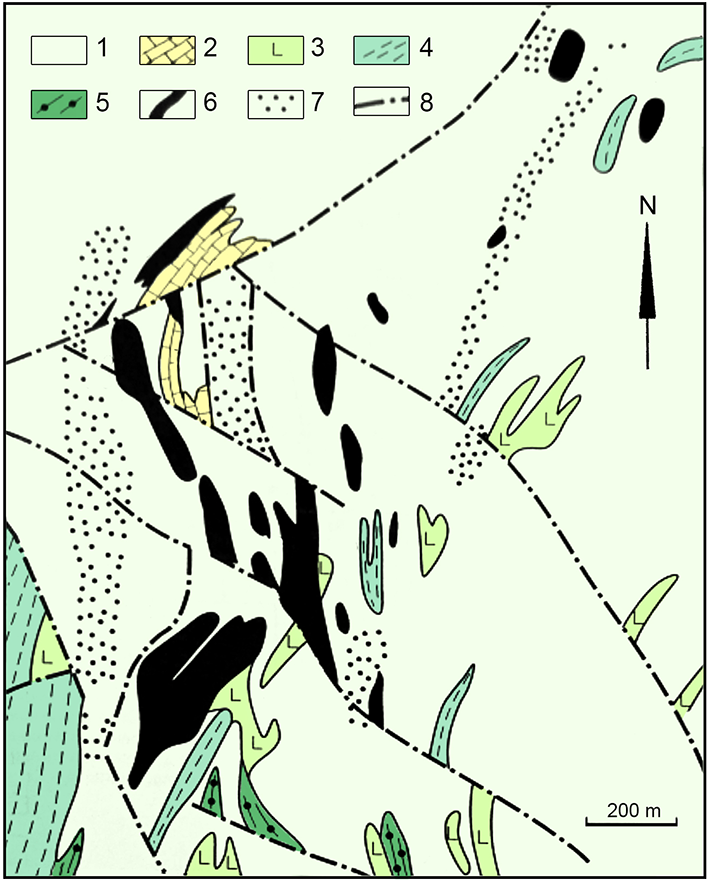
The Tarutinskoe deposit is located at the southern contact of the Yuzhno-Karamysovsky massif of diorites and plagiogranites and volcano-sedimentary strata of Siluro-Devonian age (Fig. 2). Skarn zones formed after the remnants of marbles and host granitoids, and they consist of skarn bodies up to 100 m long and 28 m thick. The majority of magnetite-sulfidic and sulfide orebodies are confined to skarns while only few are located in the zones of moderately to strongly sericitised granitoids. Main gangue minerals of the skarns include garnets (andradite and grossular), epidote, chlorites (clinochlore and chamosite), pyroxenes (diopside and hedenbergite), amphiboles (actinolite and tremolite) and calcite. Main ore minerals comprise magnetite, hematite and sulfides (pyrite, chalcopyrite, galena and sphalerite). A more detailed description of the Tarutinskoe deposit, its geology and mineralogy can be found elsewhere (Grabezhev et al., Reference Grabezhev, Belgorodsky, Sotnikov and Gmyrya2002, Reference Grabezhev, Sotnikov, Belgorodsky, Murzin and Moloshag2004, Reference Grabezhev, Gmyra, Vigorova and Palgueva2005; Grabezhev and Shardakova, Reference Grabezhev and Shardakova2006; Grabezhev and Ronkin, Reference Grabezhev and Ronkin2007; etc.).
Geological map of the Tarutinskoe deposit (modified after Grabezhev et al., Reference Grabezhev, Sotnikov, Belgorodsky, Murzin and Moloshag2004): 1 – Quartz diorites and plagiogranodiorites, 2 – metalimestones, 3 – basalt aphyrites, 4 – tuff aleurolites, sandstones, 5 – tuff sandstones and arkosic sandstones, 6 – skarns and aposkarn orebodies, 7 – zones of moderate and strong sericitization of granitoids with veinlet-disseminated mineralisation, 8 – tectonic faults.

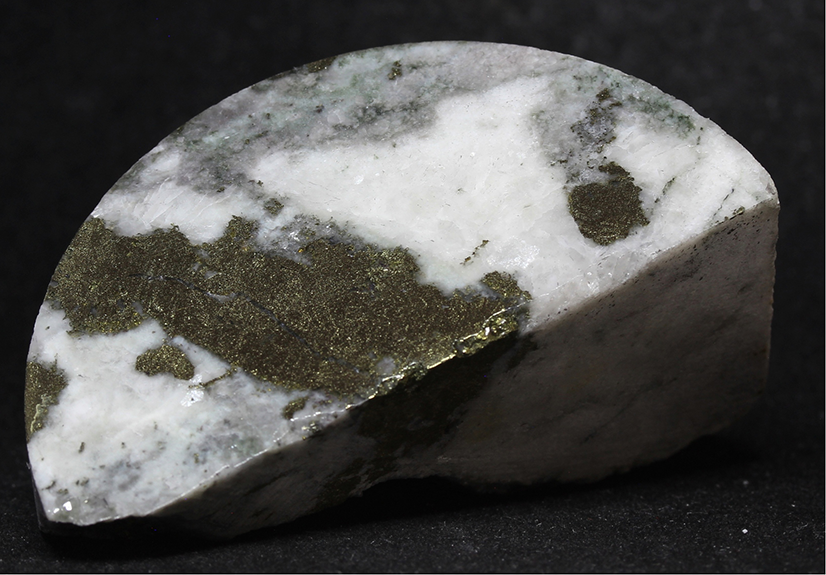
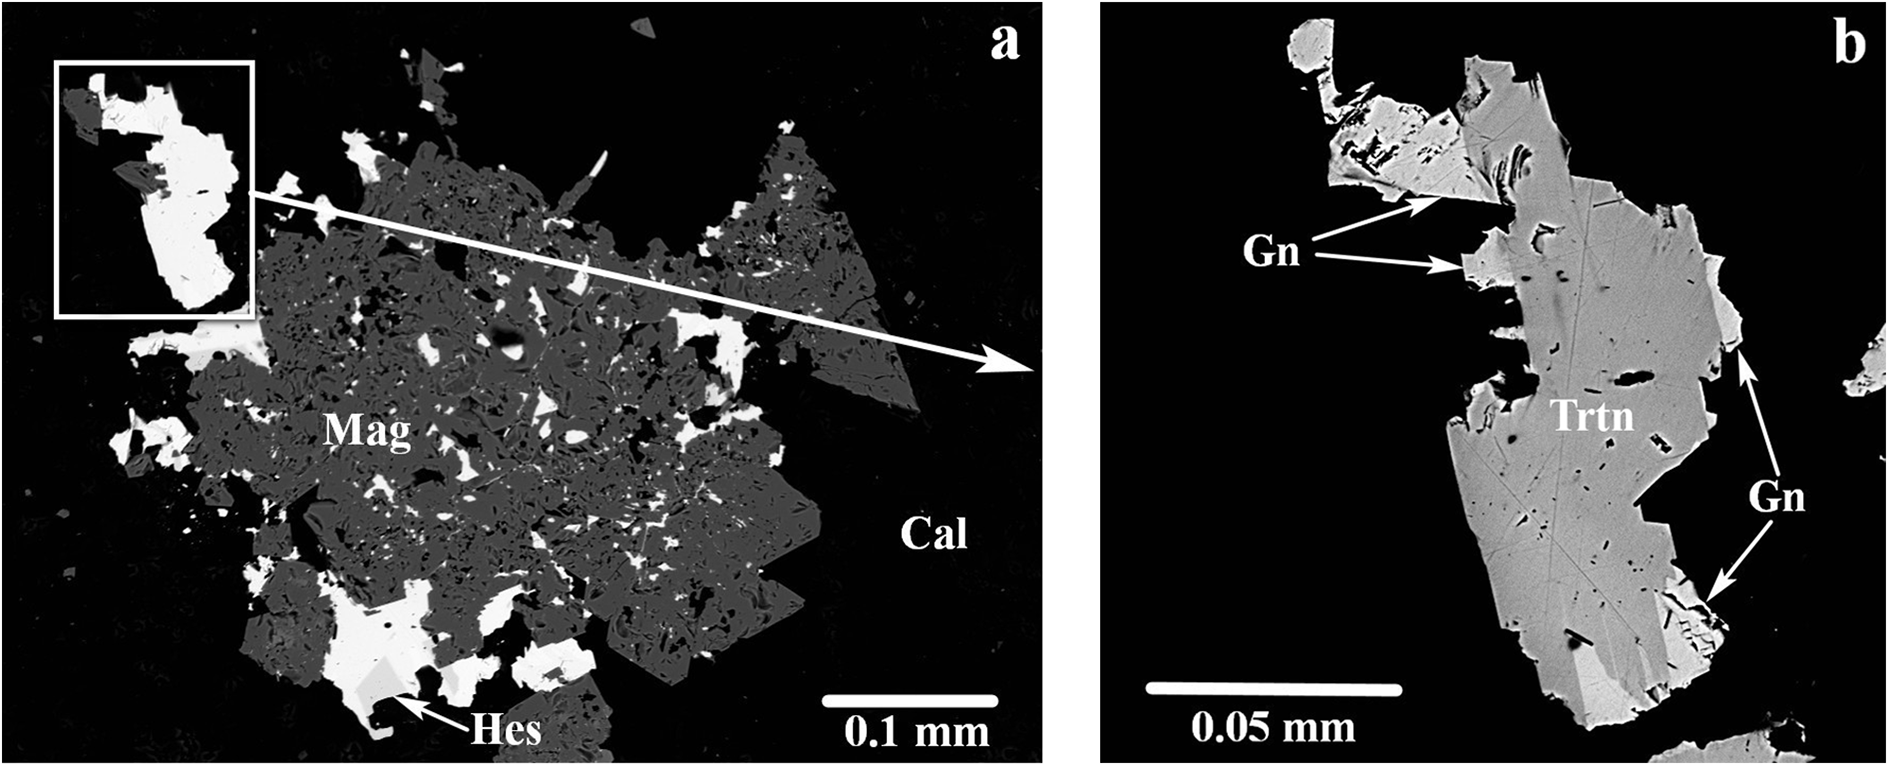
Tarutinoite was found in a fragment of a drill core extracted at 178.5 m level of borehole #4604 (Fig. 3) as anhedral grains up to 0.10 × 0.05 mm in a magnetite–calcite matrix (Figs 4a,b). In addition, the drill core is composed of major pyrite, chalcopyrite and andradite. Other associated minerals include aikinite, baryte, berryite, bismuthinite, clinochlore, galena, hessite, quartz, scheelite and tetradymite.
Fragment of drill core where tarutinoite was found (Specimen number Tarut-4604). Dark areas are composed mainly of magnetite, chalcopyrite, pyrite and andradite. White is calcite. Size: 8 × 4 × 2 cm. Photo by Aleksey Podkorytov.

(a) Tarutinoite (white grains) with hessite (Hes) in magnetite (Mag) and calcite (Cal); (b) magnified fragment of Fig. 3a, with different degrees of contrast and brightness applied in order to make possible the identification of the different phases: tarutinoite (Trtn) grain intergrown with galena (Gn). Part of this grain was extracted for SCXRD studies. Polished section. SEM (BSE) image.

Tarutinoite most probably crystallised from hydrothermal fluids during the ore-forming stage.
Physical properties and optical data
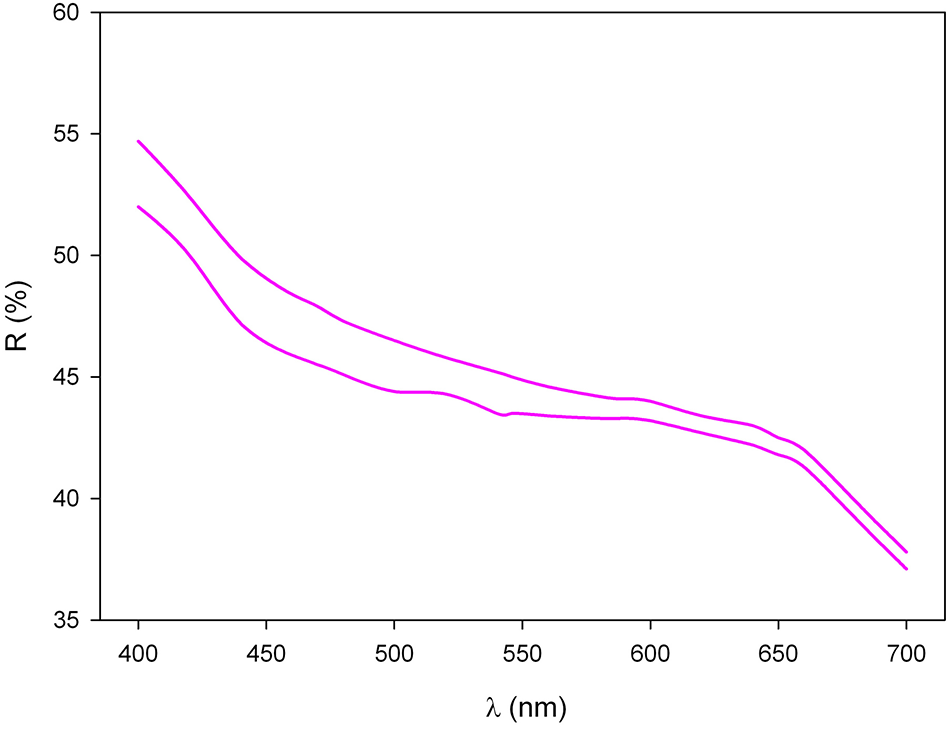
Tarutinoite is grey, opaque with metallic lustre, brittle tenacity and uneven fracture. No cleavage and parting are observed. The Vickers’ micro-indentation hardness (VHN, 25 g load) is 178 kg/mm2 (range 165–194, n = 4), corresponding to a Mohs’ hardness of 3.5–4. The density of the mineral could not be measured due to the very small amount of available material and absence of necessary heavy liquids. A density value calculated using the empirical formula and unit-cell volume obtained from single-crystal X-ray diffraction (SCXRD) data is 7.180 g/cm3. In reflected light, tarutinoite is greyish-white, very slightly brighter than neighbouring galena, very weakly bireflectant and non-pleochroic. In crossed polarisers the new mineral exhibits moderate anisotropy, in grey and dark grey tones with bluish tints. Reflectance values have been measured in air using an MSF-R (LOMO, Saint-Petersburg, Russia) microspectrophotometer. Silicon was used as a standard. The reflectance values (R max/R min) are given in Table 1 and plotted in Fig. 5.
Reflectance curves of tarutinoite. Upper line = R max, lower line = R min.

Reflectance values for tarutinoite*.

* Values required by the Committee on Ore mineralogy (COM) are given in bold.
Chemical data
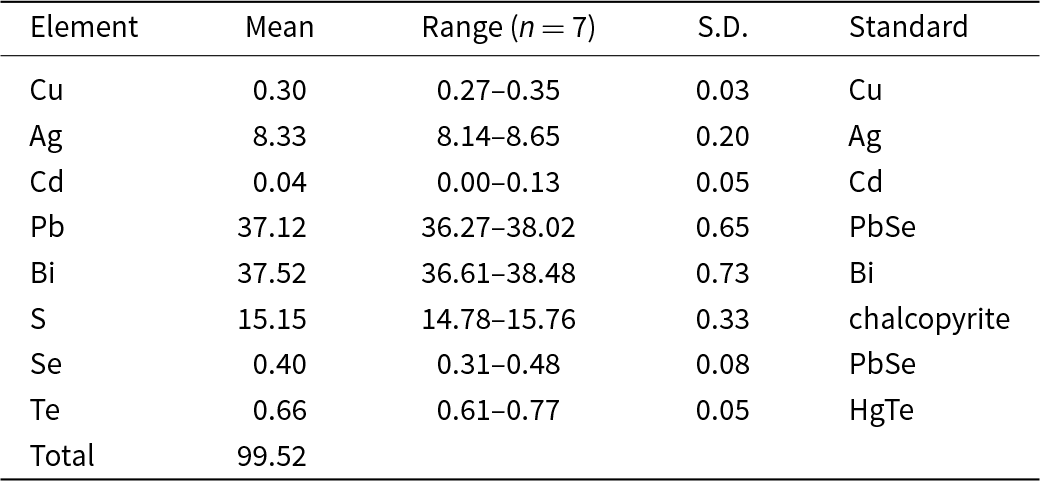
Quantitative chemical analyses were carried out using a Cameca SX 100 electron microprobe (WDS mode, 25 kV, 4 nA and 3 μm beam diameter) at the Department of Geological Sciences, Faculty of Science, Masaryk University, Brno, Czech Republic. Observation in back-scattered electron (BSE) mode (Fig. 4b) and chemical microanalyses revealed the homogeneous chemical composition of tarutinoite. The results (average of 7 spot analyses) and a list of standards are given in Table 2. Contents of other elements with atomic numbers >8 (including Fe, As and Sb) are below detection limits. Matrix correction of X-PHI algorithm (Merlet, Reference Merlet1994) was applied to the data.
Chemical data (in wt.%) for tarutinoite.

Notes: S.D. = standard deviation; n = number of spot analyses.
The empirical formula calculated on the basis of 36 atoms per formula unit is (Ag3.01Cu0.18)Σ3.19(Pb6.98Cd0.01)Σ6.99Bi7.00(S18.42Se0.20Te0.20)Σ18.82. The electrostatic valence Ev(%), defined as {[Ev(+) – Ev(–)]×100/[Ev(–)]}, is +1.4%. The simplified formula of tarutinoite is (Ag,Cu)3(Pb,Cd)7Bi7(S,Se,Te)19.
The ideal formula of tarutinoite is Ag3Pb7Bi7S19, which requires (in wt.%) Ag 8.41, Pb 37.71, Bi 38.04, S 15.84, total 100.00
X-ray crystallography
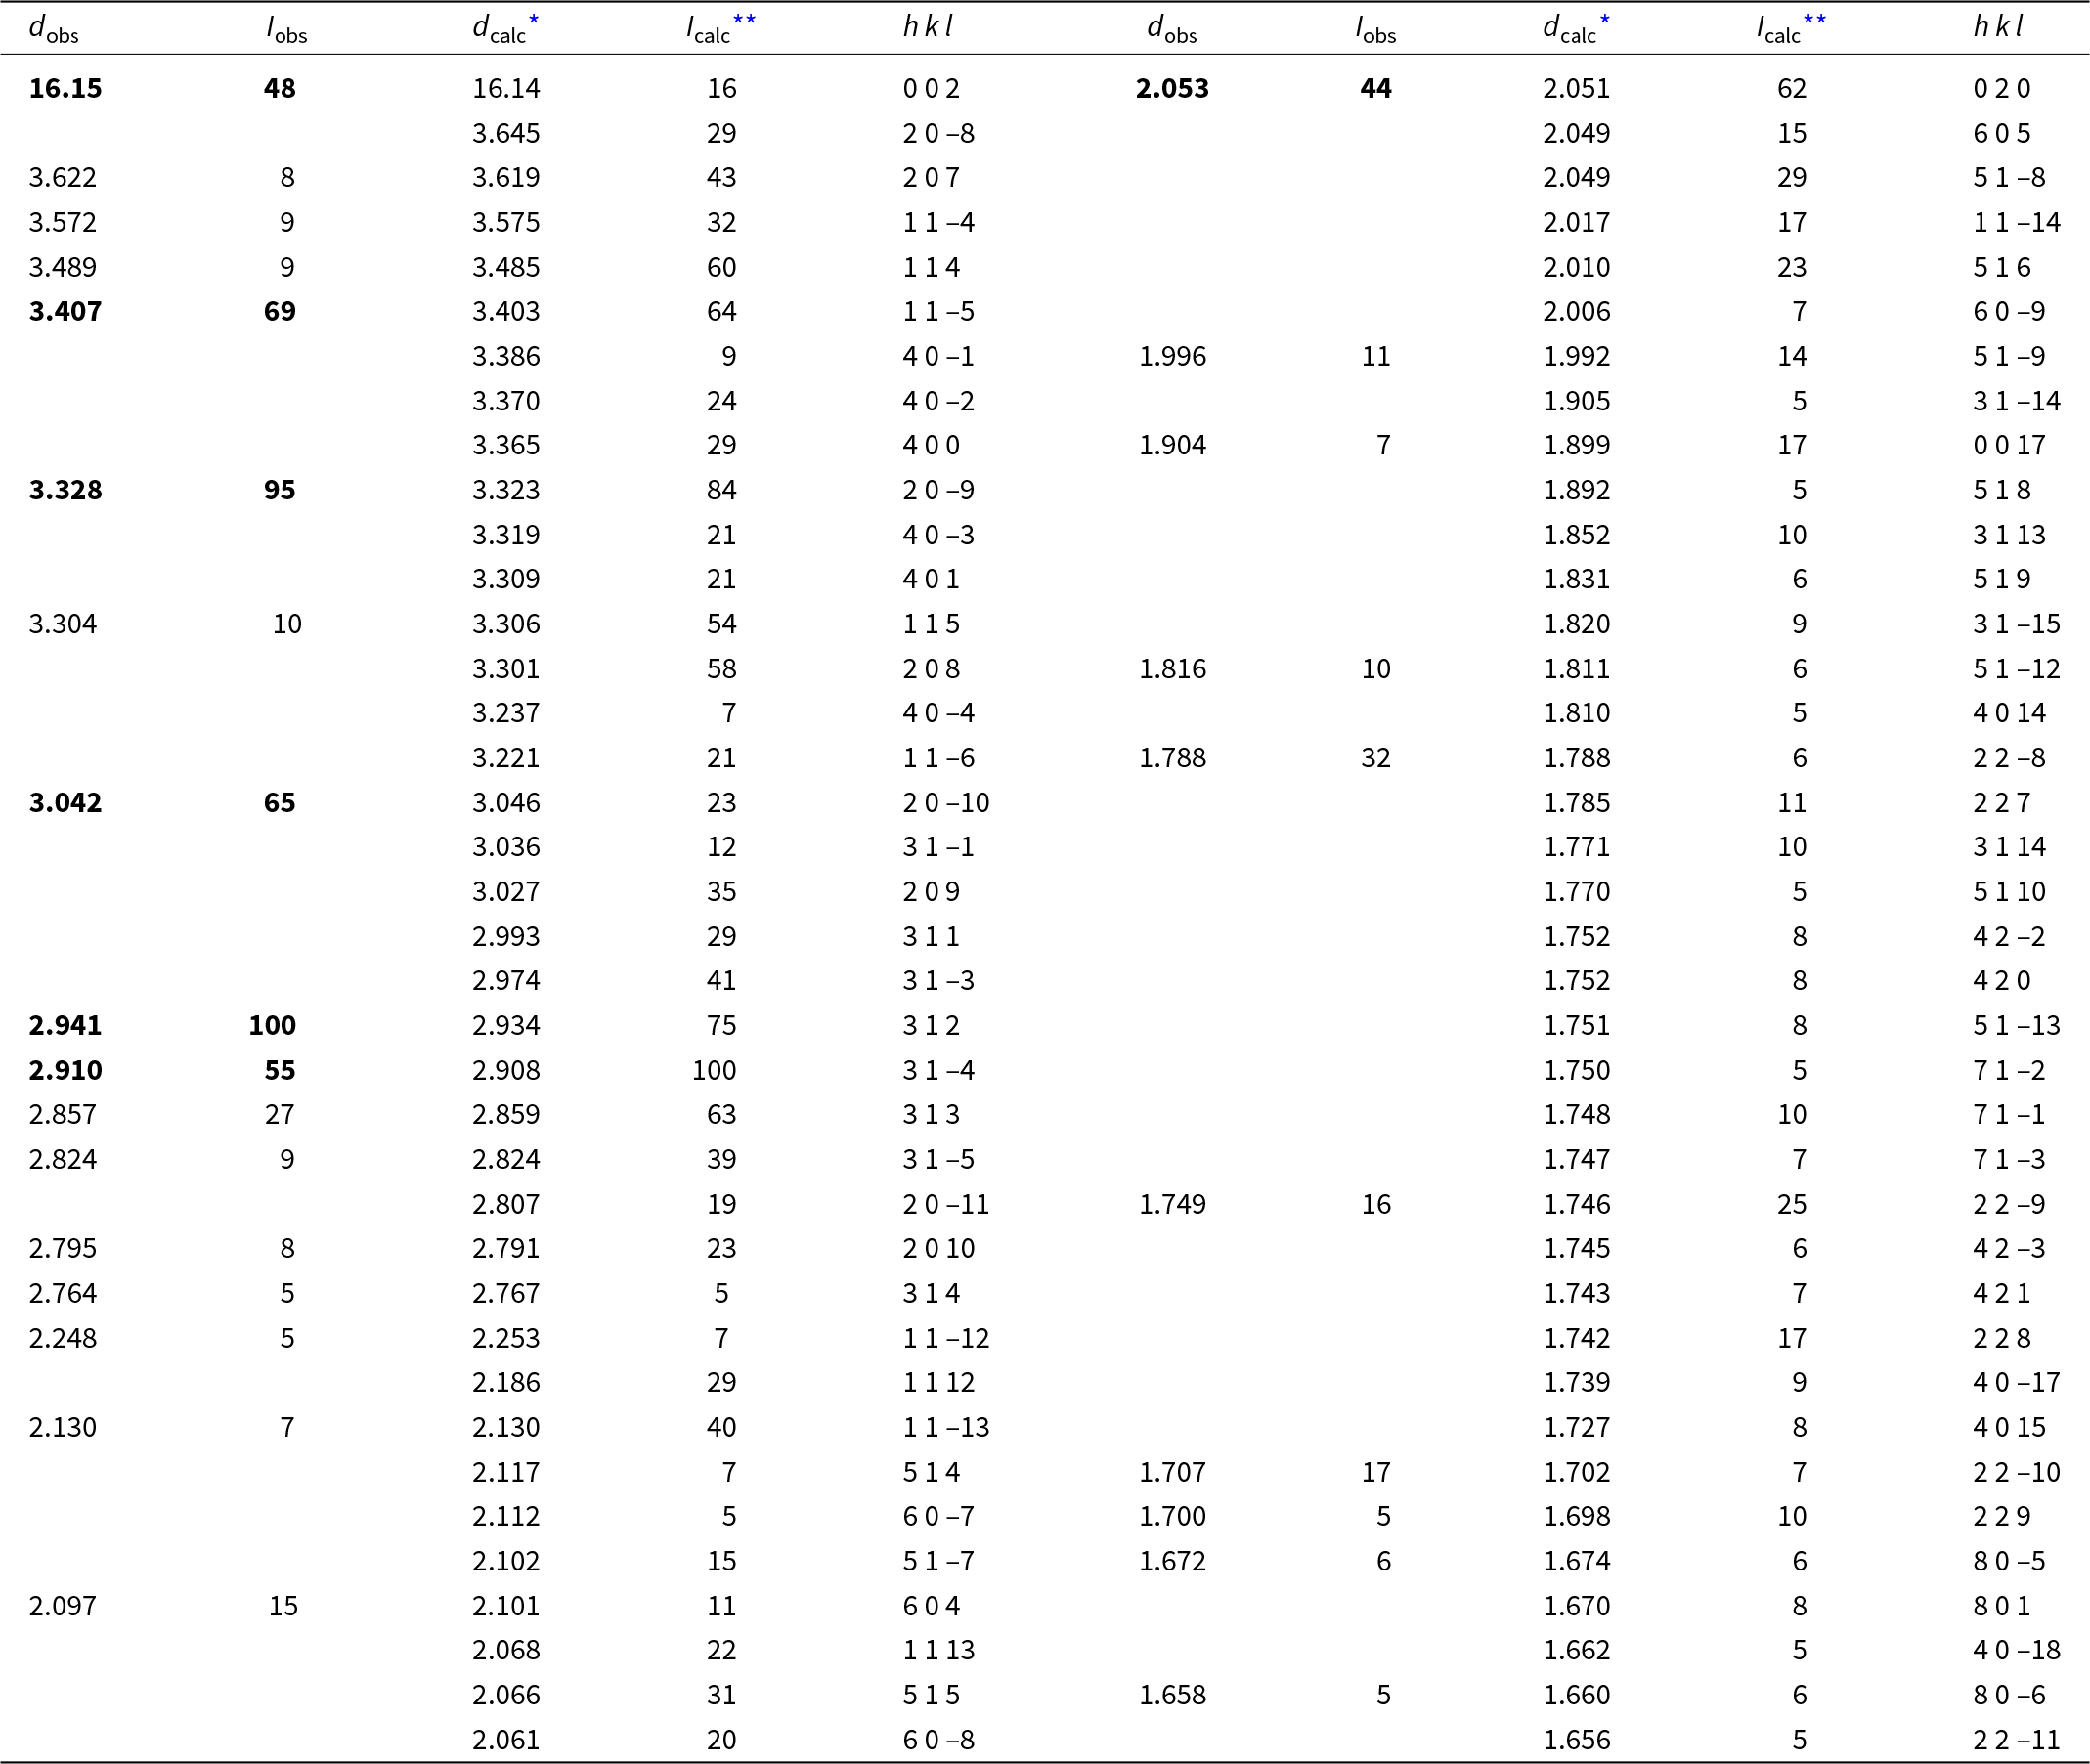
Powder X-ray diffraction (PXRD) data were collected by means of a Rigaku R-AXIS Rapid II single-crystal diffractometer equipped with a cylindrical image plate detector (radius 127.4 mm) using Debye–Scherrer geometry, CoKα radiation (rotating anode with VariMAX microfocus optics), 40 kV and 15 mA. The angular resolution of the detector is 0.045°2θ (pixel size 0.1 mm). The data were integrated using the software package Osc2Tab (Britvin et al., Reference Britvin, Dolivo-Dobrovolsky and Krzhizhanovskaya2017). The PXRD data of tarutinoite are given in Table 3 in comparison to that calculated from SCXRD data using the Vesta program (Momma and Izumi, Reference Momma and Izumi2011). Parameters of the monoclinic unit cell were refined from the observed d spacing data using UnitCell software (Holland and Redfern, Reference Holland and Redfern1997) and are as follows: a = 13.542(6), b = 4.107(3), c = 32.522(8) Å, β = 96.498(7)° and V = 1797.3(9) Å3. It should be noted that due to the lack of material, PXRD data were collected from the same grain which was used for SCXRD studies (see below). This issue with the preferential orientation of the single crystal during PXRD data collection also introduces a difference in the intensity of the peaks in the observed and calculated powder diffraction patterns while maintaining their angular positions (Table 3).
Powder X-ray diffraction data (d in Å) of tarutinoite.

* Notes: * For the calculated pattern, only reflections with intensities ≥5 are given. ** For the unit-cell parameters calculated from single crystal data. The strongest reflections are given in boldtype.
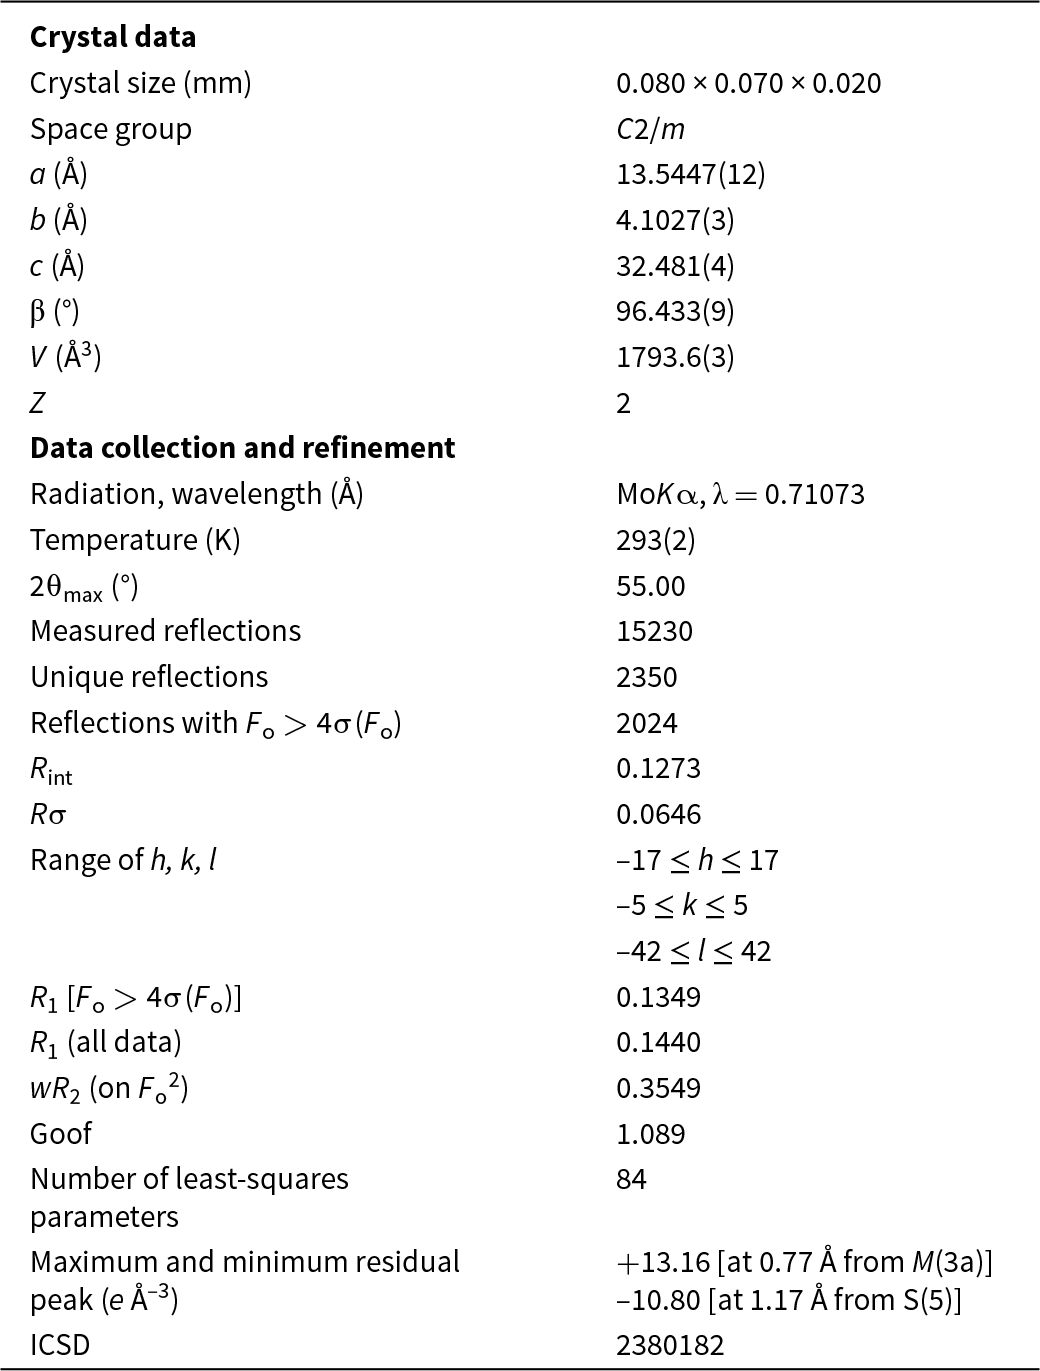
For the SCXRD study, a grain of tarutinoite, 0.080 × 0.070 × 0.020 mm in size, manually extracted from the polished section analysed using electron microprobe (Fig. 4b), was mounted on a glass fibre and examined through a Supernova Rigaku-Oxford Diffraction diffractometer equipped with a micro-source MoKα radiation (λ = 0.71073 Å; 50 kV and 0.8 mA) and a Pilatus 200K Dectris detector at the Dipartimento di Geoscienze (University of Padua, Italy). We collected intensity data over 27 runs (for a total of 1719 frames) and an exposure time of 26 seconds per degree of omega rotation for a total time of 12.33 hours. The data were processed by CrysAlisPro 1.171.41.123a software (Rigaku Oxford Diffraction) and are as follows: tarutinoite is monoclinic, space group C2/m, with unit-cell parameters a = 13.5447(12), b = 4.1027(3), c = 32.481(4) Å, β = 96.433(9)°, V = 1793.6(3) Å3 and Z = 2.
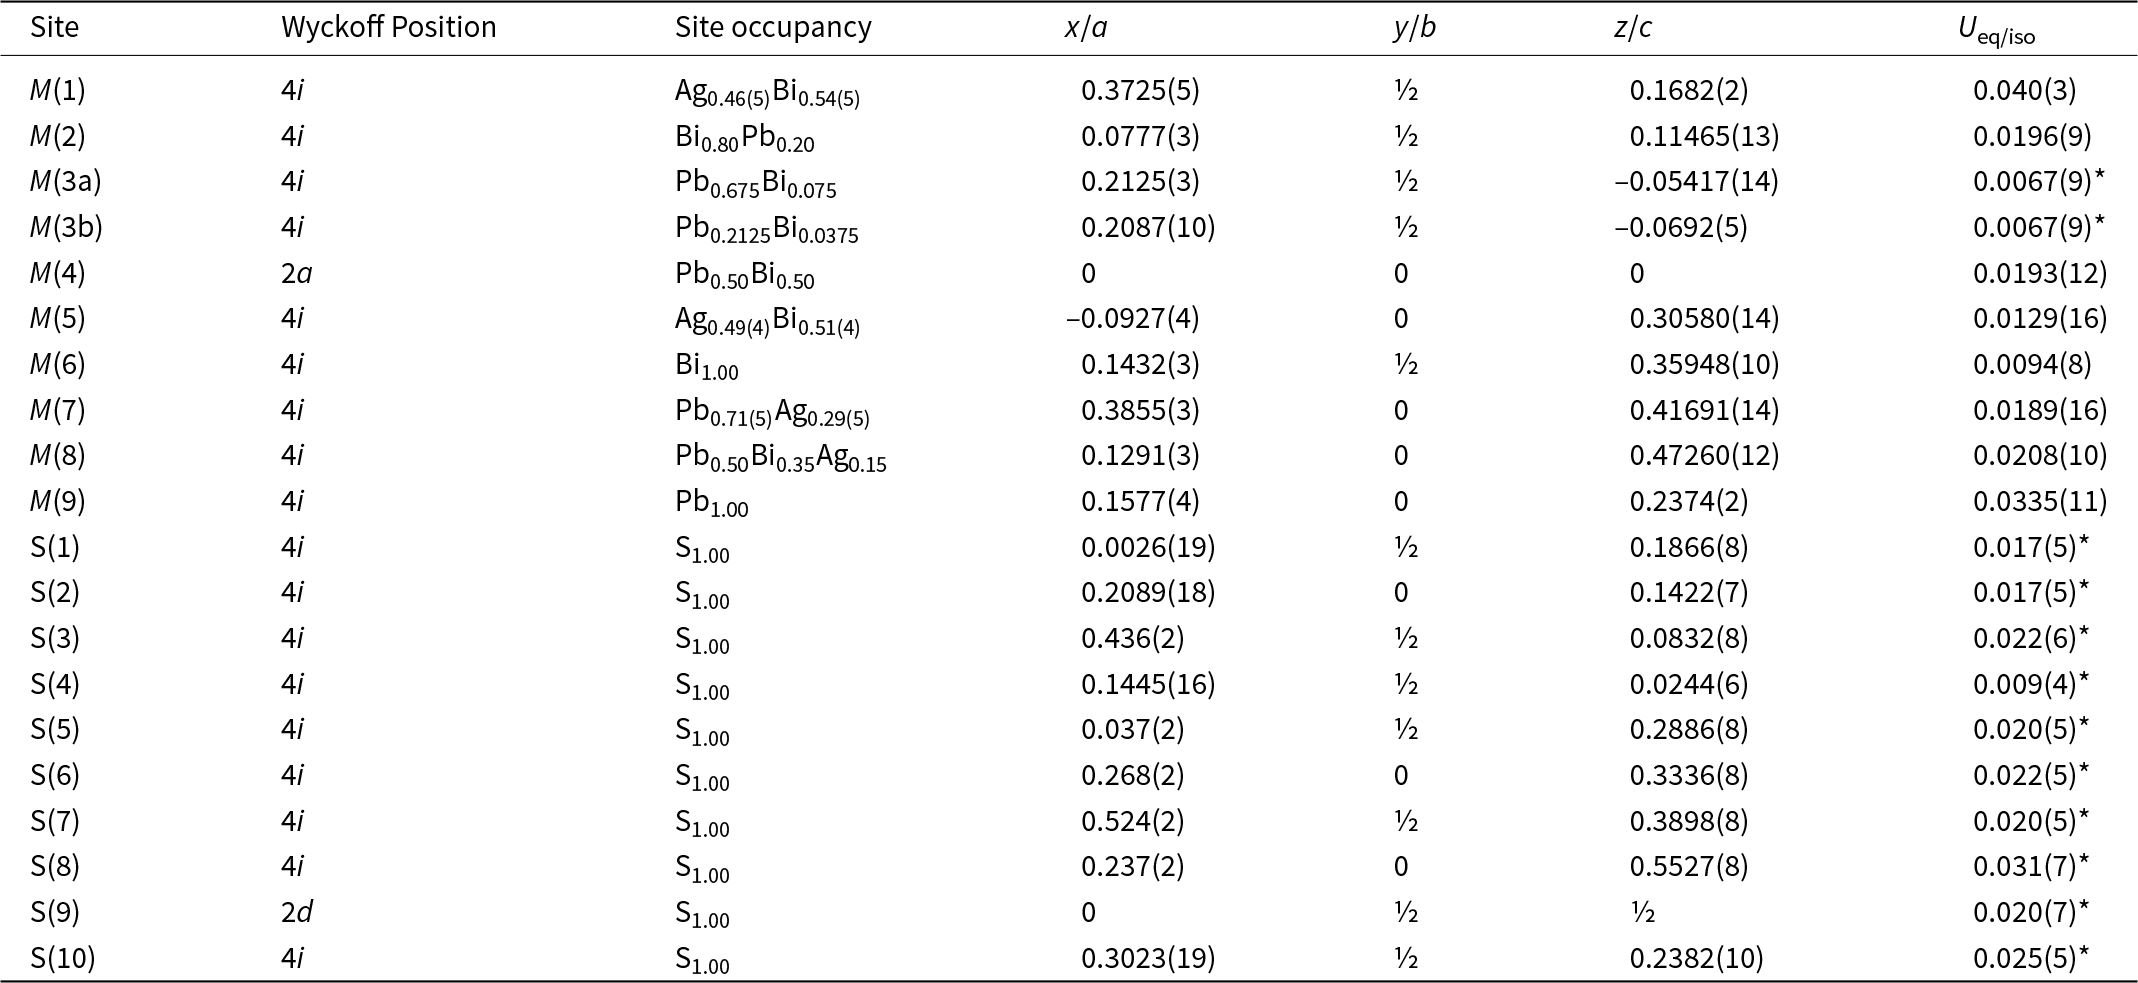
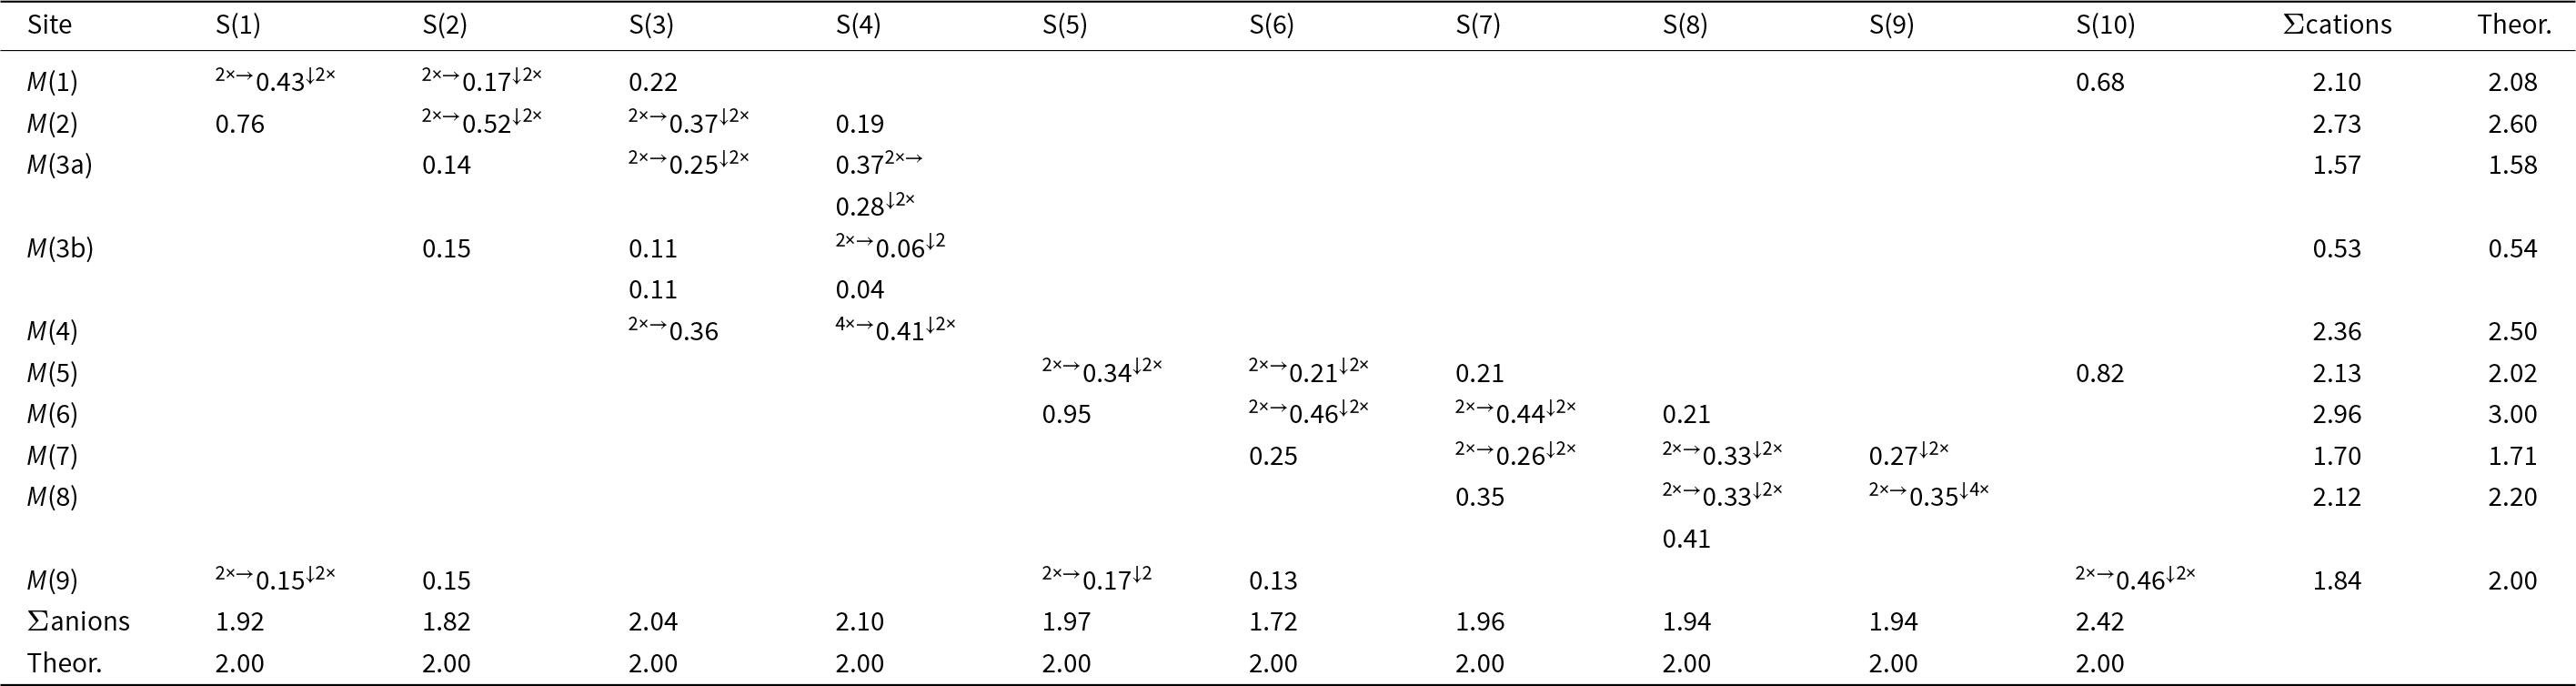
The crystal structure of tarutinoite was solved using Shelxs-97 in the space group C2/m and refined using Shelxl-2018 (Sheldrick, Reference Sheldrick2015). Neutral scattering curves for Ag, Pb, Bi and S were taken from the International Tables for Crystallography (Wilson, Reference Wilson1992). Nine cation and ten anion sites were located. The initial structural model refined to R 1 = 0.195 and was improved to R 1 = 0.157 after modelling the occurrence of twinning according to a two-fold axis along [100]. The site occupancies at the M(1)–M(9) sites were modelled considering both site scattering and bond-valence sums (using the bond parameters of Brese and O’Keeffe, Reference Brese and O’Keeffe1991). Indeed, Pb (Z = 82) and Bi (Z = 83) cannot be distinguished on the basis of site scattering only, and their site occupancies were fixed on the basis of the bond-valence approach. M(1) and M(5) sites were found to host Ag and a heavier element; on the basis of bond-valence sums, a mixed (Ag/Bi) occupancy was refined. Silver occurs also at the M(7) and M(8) positions. At the former, it occurs along with Pb, whereas at the latter site a mixed (Pb,Bi,Ag) occupancy was modelled, initially refining the Pb vs. Ag site occupancy and then adjusting the Pb/Bi ratio to optimise the bond-valence sum. M(6) and M(9) were modelled as pure Bi and Pb positions, whereas some mixed (Pb/Bi) sites were identified, namely M(2), M(3), and M(4). In particular, the M(3) site was found to be split into two sub-positions: the M(3a)/M(3b) site occupancy was initially refined and then the Pb/Bi ratio at the two sub-sites was fixed on the basis of bond-valence sums. Whereas the displacement parameters of cation positions were refined anisotropically (with the exception of the split M(3) position), the parameters of anion sites were modelled using isotropic displacement parameters, as some of them were negatively defined using the anisotropic model. After several cycles of refinement, the R 1 converged to 0.1349 on the basis of 2024 unique reflections with Fo > 4σ(Fo) and 84 refined parameters. Details of data collection and refinement are given in Table 4. Fractional atomic coordinates, site occupancies and displacement parameters are reported in Table 5. Table 6 reports selected bond distances. Table 7 gives the weighted bond-valence calculations calculated using the bond-valence parameters of Brese and O’Keeffe (Reference Brese and O’Keeffe1991). Supplementary crystallographic data (cif) were deposited in the Inorganic Crystal Structure Database (ICSD) and can be obtained by quoting the CSD 2380182 via www.ccdc.cam.ac.uk/structures/. They are also available as Supplementary material (see below).
Crystal and experimental data for tarutinoite.

Site, Wyckoff position, site occupancy, fractional atom coordinates, and equivalent isotropic or isotropic (*) displacement parameters (Å2) for tarutinoite.

Selected bond distances (in Å) for tarutinoite.

Weighted bond valence (in valence units) for tarutinoite.

Crystal structure description
The features of the crystal structure of tarutinoite (Fig. 6) agree with those of the members of the lillianite homologous series (e.g. Makovicky and Karup-Møller, Reference Makovicky and Karup-Møller1977a; Makovicky and Topa, Reference Makovicky and Topa2014). Tarutinoite shows two different kinds of PbS-like slabs, parallel to (001). Lead atoms on the composition planes of the unit-cell twinning (according to the definition first given by Andersson and Hyde, Reference Andersson and Hyde1974) show a bicapped trigonal prismatic coordination.
Crystal structure of tarutinoite as seen down b. Violet, grey, dark grey and yellow circles represent Bi-dominant, mixed (Ag/Bi), Pb-dominant, and S-hosting sites. Red lines indicate the composition planes of the unit-cell twinning separating the N = 7 and N = 8 slabs. Drawn using CrystalMaker ® software.

The two different slabs have a different diagonal width of the PbS-like octahedral layers, i.e. seven and eight, respectively.
The thinner (N = 7) t slab has composition M (1)(Ag0.92Bi1.08)M (2)(Bi1.60Pb0.40)M (3)(Pb1.78Bi0.22)M (4)(Pb0.50Bi0.50)S8 = Ag0.9Pb2.68Bi3.42S8 (Z = 2). The M(1) site is a mixed (Bi,Ag) site, with site occupancy Ag0.46(5)Bi0.54(5). It shows three distances distinctly shorter than 3 Å (average <Ag–S> distance of 2.67 Å), and three longer ones, ranging between 2.98 and 3.07 Å. Bond-valence sum (BVS) at the M(1) site is 2.10 valence units (vu), agreeing with the theoretical value based on site occupancy. The M(2) site is a mixed (Bi,Pb) site, with a Bi/(Bi+Pb) ratio of 0.8. The average <M(2)–S> is 2.87 Å. The octahedral coordination of this position is characterised by five Bi–S distances shorter than 3 Å (average value of 2.82 Å) and a sixth long distance of 3.16 Å. The BVS value is 2.73 vu. Electron density at the M(3) site was found to be split into two sub-positions, namely M(3a) and M(3b). This site was refined as a mixed (Pb,Bi) position. The sum of the BVS at these two sub-sites is 2.10 vu, to be compared with the calculated value of 2.12 vu on the basis of the site occupancy (Pb0.89Bi0.11). Finally, the M(4) site shows a nearly regular octahedral coordination, with average <M(4)–S> bond distance of 2.90 Å. The site occupancy was fixed to (Pb0.50Bi0.50) on the basis of the value of the BVS, i.e. 2.36 vu. Sulfur sites belonging to this slab are S(1)–S(4). Their BVS range between 1.82 and 2.10 vu.
The thicker (N = 8) T slab has composition M (5)(Ag0.98Bi1.02)Σ2.00M (6)Bi2M (7)(Pb1.42Ag0.58)Σ2.00M (8)(Pb1.00Bi0.70Ag0.30)Σ2.00S9 = Ag1.86Pb2.42Bi3.72S9 (Z = 2). The M(5) site shows a distorted octahedral coordination, with a mixed (Ag,Bi) occupancy, with three <M(5)–S> distances shorter than 3 Å (average 2.69 Å) and three longer ones (average 2.99 Å). The BVS, 2.13 vu, agrees with the refined (Ag0.49(4)Bi0.51(4)) occupancy of this position. The M(6) site is a pure Bi position, with five distances shorter than 3 Å (average value of 2.79 Å) and the sixth ligand at 3.12 Å. Its BVS, 2.96 vu, fully agrees with the occupancy by Bi3+. The M(7) site is a mixed (Pb,Ag) position, with an average <M(7)–S> bond distance of 2.94 Å. The BVS value, 1.70 vu, is in accordance with that calculated on the basis of the refined site occupancy Pb0.71(5)Ag0.29(5). Finally, the M(8) site is a nearly regular octahedron with a mixed (Pb,Bi,Ag) occupancy. The BVS, 2.12 vu, can be compared with the theoretical one, i.e. 2.20 vu. Anions, in this slab, are hosted at sites S(5)–S(9). Their BVS varies between 1.72 and 1.96 vu.
The composition plane of the unit-cell twinning of tarutinoite is composed by the sites M(9) and S(10). The M(9) site is a pure Pb site, with a trigonal bicapped prismatic coordination, with an average bond distance of 3.14 Å. The BVS at this site is 1.84 vu, whereas at the S(10) position is 2.42 vu. The chemistry of this composition plane is M (9)Pb2S2.
On the basis of the structural investigation, the formula of tarutinoite can be written as t[Ag0.92Pb2.68Bi3.40S8] + T[Ag1.86Pb2.42Bi3.72S9] + Pb2S2 = Ag2.78Pb7.10Bi7.12S19 (Z = 2), Ev = +0.9%. This formula agrees with the ideal one, Ag3Pb7Bi7S19 (Z = 2).
Notwithstanding the relatively high R value, i.e. 0.1349, the crystal structure of tarutinoite is physically sound, as proved by bond distances, bond-valence sums, and the fit between crystal structure and chemical composition. The high R value, as well as the relatively high residuals, could be due to the widespread twinning of tarutinoite [twin according to a two-fold axis along a, with a refined ratio between the two domains of 0.321(9)] and the possible occurrence of stacking disorder along the c direction.
Discussion
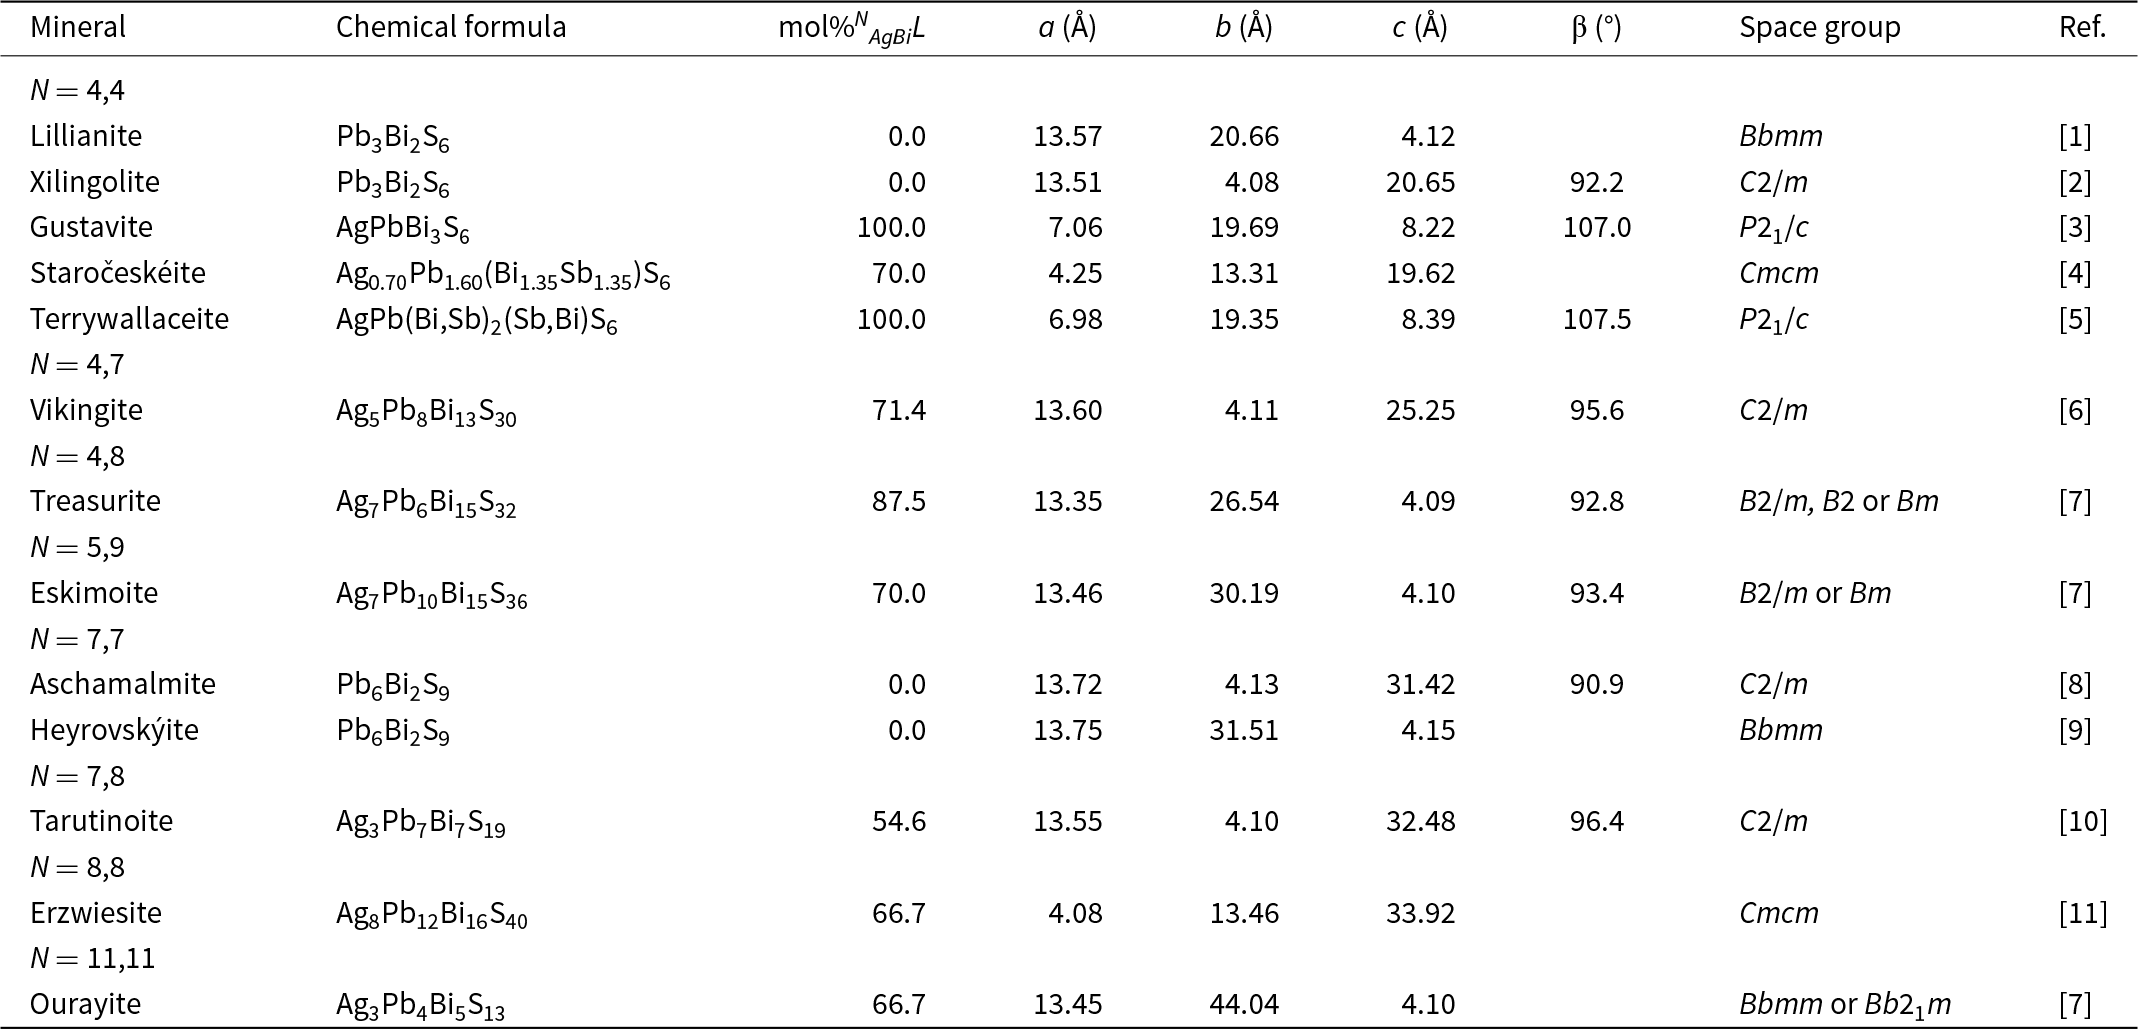
As shown above, tarutinoite is the first 7,8L member of the lillianite homologous series. While the natural member was unknown up-to-now, this kind of homologue has been reported in synthetic runs using high-resolution transmission electron microscopy by Skowron and Tilley (Reference Skowron and Tilley1990). Tarutinoite is the 13th member of the lillianite branch within the lillianite homologous series. Their comparison is given in Table 8.
Members of the lillianite branch within the lillianite homologous series.

Notes: N = homologue order. References: [1] Pinto et al. (Reference Pinto, Balić-Žunić, Garavelli, Makovicky and Vurro2006); [2] Berlepsch et al. (Reference Berlepsch, Armbruster, Makovicky, Hejny, Topa and Graeser2001); [3] Makovicky and Topa (Reference Makovicky and Topa2011); [4] Pažout and Sejkora (Reference Pažout and Sejkora2018); [5] Yang et al. (Reference Yang, Downs, Evans and Pinch2013); [6] Makovicky et al. (Reference Makovicky, Mumme and Madsen1992); [7] Makovicky and Karup-Møller (Reference Makovicky and Karup-Møller1977b); [8] Callegari and Boiocchi (Reference Callegari and Boiocchi2009); [9] Pinto et al. (Reference Pinto, Balić-Žunić, Garavelli and Vurro2011); [10] this paper; [11] Topa et al. (Reference Topa, Makovicky, Zagler, Putz and Paar2013).
The empirical formula of tarutinoite can be written as Cu0.18Ag3.01Cd0.01Pb6.98Bi7.00S18.42Se0.20Te0.20. Considering homovalent substitutions Cd2+ = Pb2+, Se2– = S2–, and Te2– = S2–, this formula can be modified to Cu0.18Ag3.01Pb6.99Bi7.00S18.82. Copper is probably hosted in tetrahedral voids within the crystal structure of tarutinoite, as observed in other lead sulfosalts (e.g. bournonite, Edenharter et al., Reference Edenharter, Nowacki and Takéuchi1970; and zinkenite, Biagioni et al., Reference Biagioni, Bindi and Moëlo2018). Unfortunately, owing to its relatively low abundance and the low quality of the structure refinement, this hypothesis cannot be confirmed experimentally. However, following Makovicky and Karup-Møller (Reference Makovicky and Karup-Møller1977a), Cu was excluded from the calculation of the homologue order. The homologue order of tarutinoite, calculated in agreement with Makovicky (Reference Makovicky2019) and references therein, is N chem = 7.52; the mole fraction of the Ag–Bi end-member L = 54.65%, and the substitution parameter in the general formula AgxPbN –1–2xBi2+xSN +2 is x = 1.51. Ideal tarutinoite, Ag3Pb7Bi7S19 has N chem = 7.50, L = 54.55% and x = 1.50, in agreement with values calculated from the empirical formula. This suggests the correctness of the assumption about the Cu role in tarutinoite.
Supplementary material
The supplementary material for this article can be found at https://doi.org/10.1180/mgm.2025.1.
Acknowledgements
We thank Associate Editor Owen Missen and two anonymous Reviewers for constructive comments that improved the manuscript. Maria D. Milshina is acknowledged for the help with the figures. The PXRD studies have been performed at the Research Centre for X-ray Diffraction Studies of St. Petersburg State University within the framework of the project AAAA-A19-119091190094-6.
Competing interests
The authors declare none.