Implications
Animal production and more specifically dairy production will face great challenges in the future, such as increasing world demand, environmental issues and adaptation to global climate change. The equations developed in this paper are aimed at predicting water needs, along with urinary and fecal excretion in dairy cows. They should contribute toward better prediction of water requirements and effluent volume in dairy farms according to the feeding system and the production level in order to better schedule water use and to evaluate their environmental consequences.
Introduction
Dairy cows require water for all of their life processes, to maintain the osmotic pressure in their cells and tissues, to eliminate waste materials (urine, feces and respiration) and to dissipate excess heat (perspiration) from the body. Water constitutes ∼56% to 81% of dairy cow live weight (Beede, Reference Beede1991). This pool of body water must be maintained through water intake from drinking, water contained in feed consumed and water resulting from metabolic oxidation of body tissues. Dairy cows lose water through evaporation, urine, feces and milk production.
Owing to the increase in the worldwide demand for animal products and to global warming, the use of water in livestock is an increasing issue (Chapagain and Hoekstra, Reference Chapagain and Hoekstra2003). Even if at the worldwide scale, the amount of water required for animal watering is small compared with the requirements for irrigation for feed production (Food and Agriculture Organization (FAO), 2006), it can represent a significant amount of high-quality water in competition with human uses during dry periods. In temperate areas, animal watering can represent a significant cost for the farm, supplied by potable public water. In all climatic contexts, this amount of water provided for herd watering cannot be reduced without seriously altering herd performance. Low water intake affects appetite, digestive response and production. For example, a 40% reduction in water intake was associated with a 16% decrease in the intake of dry matter (DM) and a concomitant 16% decrease in milk yield (Little et al., Reference Little, Sansom, Manston and Allen1976). In temperate zone dairy farms, the development of reliable equations to predict water needs for animal watering could contribute toward improved water management at the farm level by allowing better detection of water leakages on the underground pipe network that can be very large in dairy farms with pastures.
At the farm level, the volume of water excreted by livestock partly determines the size of manure storage facilities, which can in turn affect the dynamics of land application. Construction of equations able to predict fluxes of water excretion in dairy cow could be useful to predict the concentration of some minerals and the DM of freshly produced manure and slurry, which can impact certain processes such as volatilization of ammonia and nitrous oxide from effluents (Brown et al., Reference Brown, Wagner-Riddle and Thurtell2000). Although numerous empirical equations have been developed to predict water intake in dairy cows (Castle and Thomas, Reference Castle and Thomas1970; Paquay et al., Reference Paquay, De Baere and Lousse1970; Little and Shaw, Reference Little and Shaw1978; Murphy et al., Reference Murphy, Davis and McCoy1983; Stockdale and King, Reference Stockdale and King1983; Holter and Urban, Reference Holter and Urban1992; Dahlborn et al., Reference Dahlborn, Akerlind and Gustafson1998; Meyer et al., Reference Meyer, Everinghoff, Gödeken and Flachowsky2004; Cardot et al., Reference Cardot, Le Roux and Jurjanz2008), along with several empirical equations to predict urinary water flow (Bannink et al., Reference Bannink, Valk and Van Vuuren1999; Fox et al., Reference Fox, Tedeschi, Tylutki, Russell, Van Amburgh, Chase, Pell and Overton2004; Nennich et al., Reference Nennich, Harrison, VanWieringen, St Pierre, Kincaid, Wattiaux, Davidson and Block2006; Kume et al., Reference Kume, Nonaka, Oshita, Kozakai and Hirooka2008), only one study has addressed, through an integrated approach, the water balance (intake and excretions) in dairy cattle (Holter and Urban, Reference Holter and Urban1992). An advantage of this integrative approach is that it allows validation of water flow predictions consistent with the whole water balance of dairy cows. A limitation of the Holter and Urban (Reference Holter and Urban1992) study, however, is that it involved only data from cows fed diets with DM ranging between 28.3 and 89.9 g/100 g and thus these equations may not be directly applicable to grazing cows for which the water balance can be strongly modified. Among the predictive parameters of water intake used in the above-mentioned equations, dry matter intake (DMI) was included in 7 of the 9 equations but this parameter is not always easy to assess in practice on commercial farms. Both equations excluding this predictor were developed from datasets with a narrow range of milk yield (MY) and dietary DM variation (Castle and Thomas, Reference Castle and Thomas1970; Dahlborn et al., Reference Dahlborn, Akerlind and Gustafson1998) and may be difficult to use in situations with high-producing cows fed contrasted diets. Most of the other water intake predictors were easier to obtain from commercial farms, at least in the case of total mixed ration, and consisted of milk production, diet composition and climate parameters. Most published predictive equations of urinary water excretion are generally more precise than equations of water intake if we refer to the ratio of the mean prediction error to the average value of the flow. However, their use requires either chemical analyses of a representative sample of urine (Na, K content and urine specific gravity) or assessment of sodium intake, which is highly unpredictable, at least when mineral blocks are available, because of a large variability between individuals.
The main objective of this article was to establish a set of predictive equations for the main water flows at the animal level (free water intake (FWI), total water intake (TWI), urine and feces), according to parameters related to diet characteristics and animal performance in dairy cows under thermoneutral conditions, and covering a broad variety of diets from fresh herbage to diets based on dehydrated forages. Another objective was to evaluate the feasibility of predicting water flows without including predictive parameters related to intake in equations, at least in the case of total mixed rations.
Material and methods
Dataset used to construct empirical equations
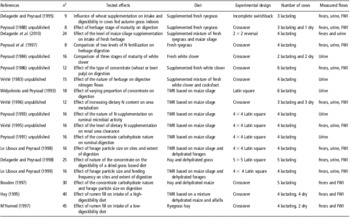
Empirical equations were constructed from a dataset gathered at the Méjussaume experimental farm (INRA Le Rheu – St-Gilles, France, 48°06′10″N 01°47′39″W, 60 m above sea level) during 18 energy and nitrogen balance trials conducted on dairy cows between 1983 and 2005. The trials differed mainly in terms of the type of diet fed, animal performance or stage of lactation. The dataset includes 342 individual measurements of main water flows at the individual level (FWI, water ingested with the feed, excreted in urine or feces, in milk). Each measurement corresponded either to different animals or to different experimental treatments for a given animal. Among the measurements, 281 were obtained from lactating cows (178 ± 80.9 DIM) and 61 were obtained from dry cows. All cows were Holstein. Seven trials, including 92 individual measurements, were conducted on cows kept indoors and fed diets based on freshly cut grass. The aim of these trials was to study the effect of concentrate or maize silage supplementation on the intake of cows fed perennial ryegrass (24 data, Delagarde et al., Reference Delagarde, Perez-Ramirez and Peyraud2010; 9 data, Delagarde and Peyraud, Reference Delagarde and Peyraud1995; 8 data, J.L. Peyraud, unpublished), the effect of ryegrass nitrogen fertilization levels on digestion and intake of lactating dairy cows (8 data, Peyraud et al., Reference Peyraud, Astigarraga and Faverdin1997), the effect of white clover stage of regrowth on its in vivo digestibility (16 data, J.L. Peyraud, unpublished), the effect of supplementation of white clover with wheat and beet pulp on digestibility (12 data, J.L. Peyraud, unpublished) or the impact of herbage species, white clover or cocksfoot on digestibility (15 data, R. Vérité, unpublished). A total of eight trials including 94 individual measurements were conducted on cows fed supplemented corn silage-based diets. These trials aimed to examine how digestion and ruminal fermentation in dairy cows were affected by the proportion and type of concentrate (16 data, R. Vérité, unpublished; 18 data, Widyobroto and Peyraud, Reference Widyobroto and Peyraud1993; 16 data, J.L. Peyraud, unpublished), the level of protein supplementation (12 data, R. Vérité, unpublished; 16 data, J.L. Peyraud, unpublished) or forage particle size (16 data, Le Liboux and Peyraud, Reference Le Liboux and Peyraud1998). A total of five trials, including 156 individual measurements, were conducted on cows fed dried diets (hay, dehydrated alfalfa and dehydrated whole-crop maize). These trials aimed to study the effect of the nature of concentrate on dairy cow digestibility (25 data, Delagarde and Peyraud, Reference Delagarde and Peyraud1998), the effect of forage particle size and feeding frequency on sites of digestion (16 data, Le Liboux and Peyraud, Reference Le Liboux and Peyraud1999), the effect of the interaction between the type of starch and forage particle size on digestibility (30 data, Boudon, Reference Boudon1997) and the effect of extended rumen fill on intake in lactating and dry dairy cows (40 data, Hay, Reference Hay1995; 45 data, M'Hamed, Reference M'Hamed1997). The details of the dietary treatments and balance trial procedures are described in the above-cited references and a summary is presented in Table 1 for unpublished results. All measurements were conducted in the same building using similar methodologies. Cows were housed in tie stalls in artificially ventilated barns and were allowed free access to water and feed, as well as to mineral blocks. Cows fed freshly cut grass-based diets were stall-fed ad libitum with herbage cut once daily and held at 4°C until required. In all trials, the barn was acclimatized with a set point between 15°C and 20°C according to the experiment. None of the 18 experiments were conducted between 1 July and 1 September, which are the warmest months of the year in this area of France under oceanic influence. For all trials, cows were allowed to adapt to experimental conditions and diets for at least 10 days before excreta collections, and these lasted for 5 days. Urine and feces were collected around 0800 h. Water was available individually and continuously in individual water bowls. The amount of water drunk was measured daily at the time of excreta collection using volumetric water meters with mechanical readings (Model P38, Schlumberger Ltd (Water & Heat, Montrouge, France), nominal flow rate 1.5 m3/h, maximal allowable pressure 12 bar) associated with each water bowl. Composite samples of diets, orts and feces were dried at 80°C, ground through a 0.8 mm screen and analyzed for DM, crude protein (CP) and Van Soest constituents (NFD, ADF or ADL; Van Soest et al., Reference Van Soest, Roberson and Lewis1991). Urine was collected with harnesses and acidified with 500 ml sulfuric acid 6N to prevent ammonia volatilization. Usually, animals were weighed at the end of each experimental period of the trials, that is, for each experimental treatment. For one trial, animals were only weighed at the beginning and at the end of the trial and the averages of both weights were considered for the four experimental treatments of this trial. They were milked twice a day. The measured values required to perform the present study included data related to the composition of mixed ration, DM of the total diet (g/100 g), proportion of concentrate in the diet (CONC, g/100 g) and the dietary content of CP ingested with concentrate (CPc, g/kg DM) or with forage (CPf, g/kg DM). CPc and CPf were calculated as the product of the content of CP of concentrate or forage and the proportion of concentrate or forage in the diet. We considered dehydrated alfalfa and dehydrated whole-crop-maize as a concentrate because of their form of presentation, that is, chopped ground and pelleted in all the experiments. Animal characteristics included DMI, FWI (kg/day), fecal water (kg/day), urine water (kg/day), MY (kg/day), milk fat and protein content, body weight (BW, kg) and stage of lactation and/or pregnancy (days).
List of the experiments included in the dataset used for the development of predictive equations of water flows

TMR = total mixed ration; FWI = free water intake.
1 n = data number.
Choice of explanatory variables to predict water flow variations
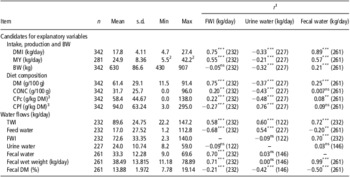
The variables considered as candidates for inclusion as independent variables in the regression equations were as follows: DMI (kg/day), MY (kg/day), BW (kg), DM (g/100 g), CONC (g/100 g), CPc (g/kg DM), CPf (g/kg DM), square of the content of CP ingested with concentrate (CPc2) and square of the content of CP ingested with forage (CPf2). Table 1 shows the mean, minimum, maximum and standard deviation values for each of the candidate variables representing linear effects. The variables DMI, DM, BW and MY were chosen to be included in the regression model because it has been shown that they are related to water flows at the animal scale (Murphy et al., Reference Murphy, Davis and McCoy1983; Meyer et al., Reference Meyer, Everinghoff, Gödeken and Flachowsky2004; Cardot et al., Reference Cardot, Le Roux and Jurjanz2008). The contents of CP ingested with forage and concentrate were added because elimination of urea in urine can partly drive water excretion and thus water balance at the animal scale (Bannink et al., Reference Bannink, Valk and Van Vuuren1999; Nennich et al., Reference Nennich, Harrison, VanWieringen, St Pierre, Kincaid, Wattiaux, Davidson and Block2006; Kume et al., Reference Kume, Nonaka, Oshita, Kozakai and Hirooka2008). These variables were also used because the mineral load (K and Mg) is partly positively correlated to the CP content among and between feedstuffs (Institut National de la Recherche Agronomique (INRA), 2007) and the CP content is generally better known than the mineral content. CPf and CPc were included as two independent variables because CPf allows a better description of fresh herbage-based diets compared with diets based on conserved forages. CPf and CPc were also included in their quadratic form because graphic analyses showed curvilinear effects of these variables on TWI, urine and fecal water. With the exception of DMI, we assumed that all the variables included in our equations could be determined in dairy farms with automatic recording systems or at least estimated with reasonable accuracy in most of the commercial farms. If necessary, CPf and CPc could be estimated from feed tables (National Research Council (NRC), 2001; INRA, 2007). Because DMI could be difficult to assess, two sets of independent variables were used to construct predictive equations.
Construction of empirical prediction equations
The relationships between water flows, animal production and diet composition were established first by a graphic analysis in order to determine the simple or the quadratic effect of each regressor on water flows. A matrix of correlations between water intake, fecal losses and urinary excretion and data on animal and diets characteristic was generated. Empirical equations were constructed by multiple regressions in a stepwise manner (SLENTRY = 0.01 and SLSTAY = 0.01) using the SAS REG procedure (SAS, 2009). The order of inclusion of regression was maintained to rank the variables in the equations of this article. An F test was used to evaluate model fitness with respect to the residual sum of squares, the number of observations and the number of parameters in the model. In the predictive equations, the decimal number of each regression parameter was chosen by reference to the first significant decimal number different from 0 of its standard deviation. R.s.d. was given for each predictive equation; a relative r.s.d. was calculated as the ratio between the r.s.d. and the average of the observed values.
Internal validation of the predictive equations
To calibrate the equations, lactating and dry cows were used together. Internal validation consisted of testing the accuracy of the predictive equations on both subpopulations of lactating and dry cows to determine whether there was any bias in both groups of cows. Regression of predicted v. observed values was performed using the REG procedure of SAS (SAS, 2009). F tests were used to compare the 0 intercept and the slope of the regression to the 1 : 1 line. The mean square prediction error was calculated according to formula (1) and decomposed, according to Bibby and Toutenburg (Reference Bibby and Toutenburg1977), into errors due to a bias on central tendency, error due to a bias on the slope and errors due to random disturbances:

where n is the number of pairs of values of Obs (observed) and Pred (predicted) being compared. The root mean square prediction error (RMSPE) was also calculated for comparison with the predicted value in a given unit.
Dataset used for external validation
The dataset used for external validation included 196 water flow results collected from 43 studies published in the literature. The objective of this dataset was to test the robustness of empirical equations on a broader range of environments and animals, compared with the conditions described in the dataset used to construct the equations. References retained in the dataset were first obtained from bibliographic research in the CAB Abstract (2010), using the following keywords: water intake, lactating cows and digestibility and then from the bibliographic list of retained references. To be included in the dataset, the references had to provide data on production (DMI, MY, BW), diet characterization (DM, CPf, CPc, CONC) and at least one of the water flow types. All data were average values of several lactating or dry dairy cows given the same treatment. The treatments involved feeding trials with lactating and dry cows fed ad libitum either grass silage, whole-crop silage (corn, wheat, alfalfa), hay, partly or completely supplemented with concentrate feeds differing both in amount and in composition or freshly cut pastures. Ambient temperature was included in the dataset when available (102 data). This information was always available for the 26 data obtained from trials aimed at testing heat stress conditions, with ambient temperatures above 25°C. When ambient temperature was not available, we estimated that it was in a restricted range of thermoneutrality for dairy cows (5°C to 20°C) after checking consistency with the geographic localization and period of the year indicated in the ‘Material and methods’ section. The list of references included in this dataset is given in Table 3.
Evaluation of predictions
To evaluate the constructed equations, regression of predicted versus observed values was performed using the SAS REG procedure. F tests were used to compare the 0 intercept and the slope of the regression to the 1 : 1 line. MSPE and RMSPE were calculated as defined above and MSPE was decomposed, according to Bibby and Toutenburg (Reference Bibby and Toutenburg1977). Relative RMSPE was defined as the ratio between RMSPE and the average value of observed data.
Results
Ranges of variation in the dataset used to construct equations
The dataset used to construct the equations included 342 measurements of water flow in dairy cows, among which were 232 measurements of free water intake, 227 measurements of urine water and 261 measurements of fecal water. The average DMI for all the measurements was 17.8 kg/day and ranged between 4.7 and 27.5 kg/day (Table 2). The average MY of the 281 measurements performed on lactating cows was 24.9 kg/day and ranged between 5.5 and 42.2 kg/day. The diet DM ranged between 11.5 and 91.4 g/100 g, with a mean of 61.4 g/100 g, and the CONC in the diet ranged between 0 and 96.0 g/100 g.
Means and range of variables and correlation coefficients (r) between selected variables used for the development of predictive equations (n = 281 lactating cows and 61 dry cows)

FWI = free water intake; DMI = dry matter intake (kg/day); MY = milk yield (kg/day); BW = body weight (kg); DM = dry matter content of the diet (g/100 g); CONC = proportion of concentrate in diet (g/100 g); CPc = dietary content of CP ingested with concentrate (g/kg DM); CPf = dietary content of CP ingested with forage (g/kg DM); TWI = total water intake.
***P < 0.001, **P < 0.01, ns P > 0.05.
1Correlation coefficient, numbers in brackets indicate the number of data available for correlation.
2Min and max MY are given for lactating cows.
3CPf and CPf were calculated as the products of the content of CP of forage or concentrate and the proportion of forage or concentrate in the diet.
FWI and water ingested with feed averaged 72.6 and 17 kg/day, respectively, with high s.d. (33.35 and 27.52, respectively) (Table 2). Among the candidates for explanatory variables, FWI was best correlated to the DMI (r = 0.75, P < 0.001) and DM (r = 0.75, P < 0.001). Water excreted in feces averaged 33.3 kg/day and was best correlated to DMI (r = 0.89, P < 0.001). Water excreted in urine averaged 24 kg/day and was best correlated to the content of CP ingested with forage (r = 0.76, P < 0.001).
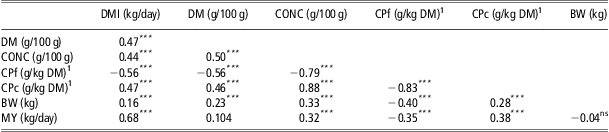
The coefficients of correlation between the candidate variables for stepwise regression are presented in Table 3. The highest correlations were observed between CPc and CONC (r = 0.88, P < 0.001), DMI and MY (r = 0.68, P < 0.001), CPf and CONC (r = −0.79, P < 0.001) and CPf and CPc (r = −0.83, P < 0.001).
Pearson correlation coefficients for selected variables used for the development of predictive equations

DMI = dry matter intake (kg/day); DM = dietary dry matter content (g/100 g); CONC = proportion of concentrate in diet (g/100 g); CPf = dietary content of CP ingested with forage (g/kg DM); CPc = dietary content of CP ingested with concentrate (g/kg DM); BW = body weight (kg); MY = milk yield (kg/day).
***P < 0.001, ns P > 0.05.
1CPf and CPf were calculated as the products of the content of CP of forage or concentrate and the proportion of forage or concentrate in the diet.
Ranges of variation in the dataset used for external validation
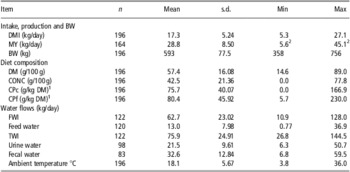
In the dataset constructed for external validation, the average DMI and BW were, respectively, 17.3 kg/day and 593 kg (n = 196, Table 4). For lactating cows, the average MY was 28.8 kg/day (n = 164). The ranges of these variables were as high as those in the dataset used to construct the equations. The diet DM averaged 57.4 g/100 g and had a narrower range compared with the diet DM observed in the building dataset. Similarly, CONC, CPf and CPc were less variable in the validation dataset compared with the building dataset. Ambient temperature was estimated in 47% of the data used in the validation dataset and varied from 3.8°C to 36.0°C, with an average of 18.1°C.
Means and range of variables used for the external validation of the predictive equations (n = 164 lactating cows and 32 dry cows)Footnote 3

DMI = dry matter intake (kg/day); MY = milk yield (kg/day); BW = body weight (kg); DM = dietary dry matter content (g/100 g); CONC = proportion of concentrate in diet (g/100 g); CPc = dietary content of CP ingested with concentrate (g/kg DM); CPf = dietary content of CP ingested with forage (g/kg DM); FWI = free water intake; TWI = total water intake.
1 CPf and CPf were calculated as the products of the content of CP of forage or concentrate and the proportion of forage or concentrate in the diet.
2 Min and max MY from lactating cows.
3 References used in the dataset: Burgos et al., 2001 (American Journal of Physiology Regulatory, Integrative and Comparative Physiology 280, 418–427); Cardot et al., Reference Cardot, Le Roux and Jurjanz2008 (Journal of Dairy Science 91, 2257–2264); Chaiyabutr et al., 2008 (International Journal of Biometeorology 52, 575–585); Dado and Allen, 1994 (Journal of Dairy Science 77, 132–144); Dahlborn et al., Reference Dahlborn, Akerlind and Gustafson1998 (Swedish Journal of Agricultural Research 28, 167–176); Delagarde et al., Reference Delagarde, Perez-Ramirez and Peyraud2010 (Animal Feed Science and Technology 161, 121–131); Dewhurst et al., 1998 (Animal science 66, 543–550); Dewhurst et al., 2010 (Animal 4, 732–738 ); Doelman et al., 2008 (Journal of Animal Science 91, 3998–4001); Escobosa et al., 1984 (Journal of Dairy Science 67, 574–584); Gozho and Mutsvangwa, 2008 (Journal of Dairy Science 91, 2726–2735); Gressley and Armentano, 2007 (Journal of Dairy Science 90, 1340–1353); Gustafson, 2000 (Acta Agriculturae Scandinavica, Section A Animal Science 50, 111–120); Harlan et al., 1991(Journal of Dairy Science 74, 1337–1353); Hill et al., 2007 (Journal of Dairy Science 90, 5634–5642); Holter et al., 1982 (Journal of Dairy Science 65, 1175–1188); Holter et al., 1990 (Journal of Dairy Science 73, 3502–3511); Holter et al., 1992 (Journal of Dairy Science 75, 1480–1494), Janicki et al., 1985 (Journal of Dairy Science 68, 1995–2008); Kauffman and St Pierre, Reference Kauffman and St Pierre2001 (Journal of Dairy Science 84, 2284–2294); Knowlton et al., 2002 (Journal of Dairy Science 85, 3328–3335); Knowlton et al., 2010 (Journal of Dairy Science 93, 407–412); Kojima et al., 2005 (Animal science 76, 139–145); Kume et al., 2001 (Animal Feed Science and Technology 93, 157–168); Kurihara et al., Reference Kurihara, Shibata and Mukai1984 (Japonese Journal of Livestock Management 20, 61–67); Leiber et al., 2009 (Journal of Animal Physiology and Animal Nutrition 93, 391–399); Little and Shaw, Reference Little and Shaw1978 (Animal Production 26, 225–227); Mackle et al., 1996 (New Zealand Journal of Agricultural Research 39, 341–356); McDowell et al., Reference McDowell, Moody, Van Soest, Lehmann and Ford1969 (Journal of Dairy Science 52, 188–194); Monteils, 2002 (Reproduction Nutrition Development 42, 545–557); Murphy et al., Reference Murphy, Davis and McCoy1983 (Journal of Dairy Science 66, 35–38); Osborne et al., 2002 (Canadian Journal of Animal Science 82, 267–272); Osborne et al., 2009 (Journal of Animal Science 92, 698–707); Richards, Reference Richards1985 (Tropical Animal Health and Production 17, 209–217); Shalit et al., 1991 (Journal of Dairy Science 74, 1874–1883); Silanikove et al., 1997 (Journal of Dairy Science 80, 945–956); Solomon et al., 1995 (Journal of Dairy Science 78, 620–624); Thomas et al., 2007 (Journal of Animal Science 90, 3831–3837); Vagnoni and Oetzel, 1998 (Journal of Dairy Science 81, 1643–1652); Valadares et al., 1999 (Journal of Dairy Science 82, 2686–2696); van Dorland et al., 2007 (Livestock Science 111, 57–69); Wattiaux and Karg, 2004 (Journal of Dairy Science 87, 3492–3502); Weiss et al., 2009 (Journal of Dairy Science 92, 5607–5619).
Predictive equations
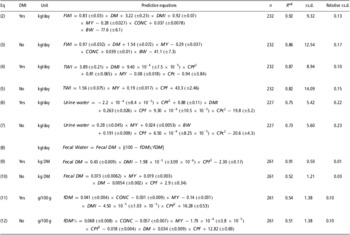
The result of applying the variable selection to all the water flows is given in Table 5. FWI was predicted in equation (2) when DMI was included in the list of candidate regressors and in equation (3) when DMI was excluded. In both equations, the DM content of the diet explained most of the variability of the FWI, with a partial r 2 of 0.57 in both cases. The partial r 2 values were lower than 0.05 for all other parameters, except for DMI in equation (2), where it was 0.27, and for MY in equation (3), where it was 0.24.
Predictive equations of water flows with or without DMI in the list of candidate regressors

FWI = free water intake; TWI = total water intake; Fecal DM = fecal DM excreted (kg/day); fDM% = dry matter content of the feces (g/100 g); DM = dietary dry matter content (g/100 g); MY = milk yield (kg/day); BW = body weight (kg); CONC = proportion of concentrate in diet (g/100 g); CPf = dietary content of CP ingested with forage (g/kg DM); CPc = dietary content of CP ingested with concentrate (g/kg DM).
Both (CPf and CPc) parameters were calculated as the products of the content of CP of concentrate or forage and the proportion of concentrate or forage in the diet.
DMI (dry matter intake, kg/day) included as a candidate explanatory variable in the stepwise regression (Yes) or not (No).
n = number of observation; relative r.s.d. = calculated as the ratio between the r.s.d. and the average of the observed values.
The TWI (FWI and water ingested with the feed) was predicted in equation (4; Table 5) when DMI was included in the list of candidate regressors and in equation (5) when DMI was excluded. In equation (4), the DMI explained most of the variability of the TWI, followed by the CPf2, with a partial r 2 of 0.51 and 0.26, respectively. The partial r 2 value of CPc was lower than 0.05. When DMI was excluded from the list of regressors, the MY partial r 2 value was higher compared with that of CPf (0.51 and 0.16, respectively). The relative r.s.d. of the predictive equations of TWI with or without including DMI as a regressor, 0.10 and 0.15, respectively, were always lower than those of the predictive equation of FWI intake, 0.13 and 0.17, respectively, including or excluding intake (Table 5).
The result of applying the variable selection on urinary water is given in equation (6) when DMI was included in the list of candidate regressors and in equation (7) when DMI was excluded (Table 5). In both equations, all the selected regressors had a partial r 2 value lower than 0.10, except for the CPf2, where it was 0.58 in equation (6).
To avoid a negative prediction of fecal water with low-producing cows, fecal water was predicted as the product of the amount of fecal DM excreted daily (kg) and the water content of feces calculated from the fecal DM content (Table 5). The regressions obtained from the stepwise procedure for fecal DM are given in equation (9) when DMI was included in the list of candidate regressors and in equation (10) when DMI was excluded (Table 5). The regressions obtained from the stepwise procedure for fDM% are given in equation (11) when DMI was included in the list of candidate regressors and in equation (12) when DMI was excluded (Table 5). The proportion of variability of fecal DM explained by DMI was high when it was included in the candidate regressors. In equation (9), the partial r 2 value of DMI was 0.89, whereas the partial r 2 value of MY in equation (10) was 0.30. The variable CONC explained a large part of variability of the fDM% in equations (11) and (12), with a partial r 2 of 0.32.
Internal validation
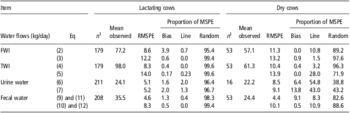
For predictive equations where DMI was included in the regressors, RMSPE of FWI (equation (2)), TWI (equation (4)) and water excreted in urine (equation (6)) were higher for dry than for lactating cows (Table 6). However, RMSPE of water excreted in feces (equations (9) and (11)) was very similar between both groups of cows. For dry cows, equation (6) tended to underestimate water excreted in urine for the lower excretion, with 54.8% of the mean error of prediction provided by a bias on the slope between observed and predicted flows.
Statistical evaluation of the accuracy of the predictive equation, with or without DMI in the list of the candidate regressors, to estimate actual water flows (internal validation, subpopulations of lactating v. dry cows of the dataset used to construct equations were evaluated separately using the predictive equations listed in Table 4)

DMI = dry matter intake; MSPE = mean square prediction error; RMSPE = root mean square prediction error; FWI = free water intake; TWI = total water intake.
1 n = number of observations.
When DMI was excluded from the list of candidate regressors, RMSPE remained higher for dry than for lactating cows for urine and fecal water predictions but was similar for TWI (Table 6). RMSPE of FWI was also higher for dry than for lactating cows, but the difference was attenuated compared with equation (3).
External validation
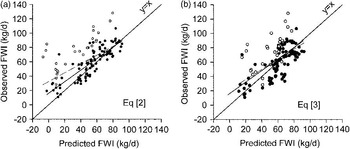
Predictive equations were validated first with data from the literature obtained at ambient temperatures below 25°C. The RMSPE of FWI estimated from equation (2) was 13.6 kg/day (Figure 1a), representing a relative RMSPE of 0.22. The equation tended to underestimate FWI by on average 5.6 kg/day but more than 72% of the MSPE was attributed to random variations. Compared with equation (2), the RMSPE of FWI, estimated from equation (3) (DMI excluded from the list of candidate regressors), was 1.3 kg/day higher, causing a slight increase in the relative RMSPE (0.25 v. 0.22; Figure 1b). In equation (3), more than 94% of the MSPE was due to random variations.
Relationship between observed free water intake (FWI) and FWI estimated from the prediction equation. (a) Prediction equation of FWI including the variable dry matter intake (DMI) in the stepwise regression. (b) Prediction equation of FWI excluding the variable DMI from the stepwise regression. (•) FWI obtained at ambient temperature <25°C. (○) FWI obtained at ambient temperature >25°C. The solid line represents regression of data obtained at ambient temperature <25°C. The dashed line represents regression with the whole dataset.

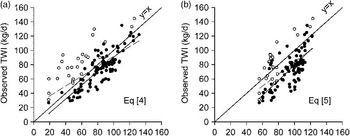
The RMSPE of TWI by equation (4) was 15.5 kg/day with data obtained under thermoneutral conditions, that is, 0.20 of relative RMSPE, which was close to the relative RMSPE of FWI in equation (2) (Figure 2a). This equation, however, has a higher proportion of the MSPE, due to a bias in the average (35.4%). Excluding DMI from the candidate regressors increased the mean prediction error of TWI by 10.8 kg/day (Figure 2b), particularly due to an increased bias in the average.
Relationship between observed total water intake (TWI) and TWI estimated from the prediction equation. (a) Prediction equation of TWI including the variable dry matter intake (DMI) in the stepwise regression. (b) Prediction equation of TWI excluding the variable DMI from the stepwise regression. (•) TWI obtained at ambient temperature <25°C. (○) TWI obtained at ambient temperature >25°C. The solid line represents regression of data obtained at ambient temperature <25°C. The dashed line represents regression with the whole dataset.

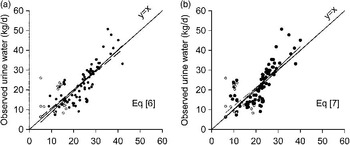
The RMSPE of water excreted in urine was 5.5 and 6.1 kg/day using equations (6) and (7), respectively (Figure 3a and Figure 3b), representing high relative mean prediction errors of 0.26 and 0.28. For both equations, more than 98% of the prediction error was due to random variations.
Relationship between observed urine water and urine water estimated from the prediction equation. (a) Prediction equation of urine water including the variable dry matter intake (DMI) in the stepwise regression. (b) Prediction equation of urine water excluding the variable DMI from the stepwise regression. (•) Urine water obtained at ambient temperature <25°C. (○) Urine water obtained at ambient temperature >25°C. The solid line represents regression of data obtained at ambient temperature <25°C. The dashed line represents regression with the whole dataset.

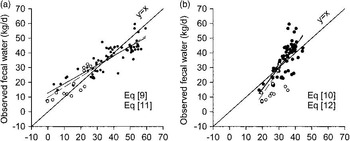
The RMSPE of water excreted in feces was 7.5 kg/day using equation (8), when DMI was included as a predictive parameter (equations (9) and (11)), representing a relative RMSPE of 0.22 (Figure 4a). The proportion of MSPE due to slope bias was 51%, with a slope between observed and predicted values significantly different from 1 (0.63, P < 0.0001). When DMI was excluded from the regressors, the mean prediction error increased to 7.6 kg/day and the slope between the observed and the predicted value clearly increased to 1.45 (Figure 4b).
Relationship between observed fecal water and fecal water estimated from the prediction equation. (a) Prediction equation of fecal water including the variable dry matter intake (DMI) in the stepwise regression. (b) Prediction equation of fecal water excluding the variable DMI from the stepwise regression. (•) Fecal water obtained at ambient temperature <25°C. (○) Fecal water obtained at ambient temperature >25 °C. The solid line represents regression of data obtained at ambient temperature <25°C. The dashed line represents regression with the whole dataset.

When predictive equations were validated on the whole dataset (including data with ambient temperature higher than or equal to 25°C), RMSPE increased clearly for FWI compared with the restricted temperature range dataset (23.8 v. 13.6 kg/day for equation (2) and 19.8 v. 14.9 kg/day for equation (3); Figure 2). For TWI, the increase in RMSPE was less significant when data with ambient temperature above 25°C were included (19.7 v. 15.5 kg/day for equation (4); Figure 3). For both excreted urine and fecal water, RMSPE only slightly increased when data with ambient temperature above 25°C were included (Figures 3 and 4).
Discussion
Diet DM content is a strong determinant of FWI
We could list from the literature 9 publications proposing equations to predict FWI (Castle and Thomas, Reference Castle and Thomas1970; Paquay et al., Reference Paquay, De Baere and Lousse1970; Little and Shaw, Reference Little and Shaw1978; Murphy et al., Reference Murphy, Davis and McCoy1983; Stockdale and King, Reference Stockdale and King1983; Holter and Urban, Reference Holter and Urban1992; Dahlborn et al., Reference Dahlborn, Akerlind and Gustafson1998; Meyer et al., Reference Meyer, Everinghoff, Gödeken and Flachowsky2004; Cardot et al., Reference Cardot, Le Roux and Jurjanz2008). The dataset used to construct equations in the present study included 281 measurements performed on lactating cows and 61 measurements on dry cows, which was in the range of the number of observations of the datasets used by Holter and Urban (Reference Holter and Urban1992) or Murphy et al. (Reference Murphy, Davis and McCoy1983), lower than Meyer et al. (Reference Meyer, Everinghoff, Gödeken and Flachowsky2004) with 12 281 data or Cardot et al. (Reference Cardot, Le Roux and Jurjanz2008) with 1837 data, but higher than all the other above-cited papers. An advantage of the dataset used to construct the equation in this paper, however, is that all the data were obtained either on different animals or on different treatments, thus limiting the dependence between data.
Compared with previously published equations predicting water intake in dairy cows, the main strength of the equations proposed in this paper is that they were constructed from a dataset with a high variability in water intake due to the concomitant presence of diets based on conserved forage (silages or dry forages) or on fresh herbage. In the dataset used to construct the equations presented in this paper, the standard deviation of FWI was 33.4 kg/day, whereas it was between 9 kg/day in the dataset used by Stockdale and King (Reference Stockdale and King1983) and 19 kg/day in the dataset used by Meyer et al. (Reference Meyer, Everinghoff, Gödeken and Flachowsky2004), which had the highest range of variation among the above-cited papers. This was very likely related to the fact that the standard deviation of diet DM contents in the dataset used in this paper was the highest among the datasets used in the above-cited publications, with a value of 29.1 g/100 g compared with the highest in the cited literature, that is, 7.2 for Holter and Urban (Reference Holter and Urban1992), 9.5 for Meyer et al. (Reference Meyer, Everinghoff, Gödeken and Flachowsky2004) or 5.0 for Cardot et al. (Reference Cardot, Le Roux and Jurjanz2008).
It appeared in our equations that, while the DM content of the diet was by far the first predictor of FWI, DMI and the CP content ingested with forage were the first predictors of TWI. The fact that DMI was an important determinant of the TWI is consistent with the observation that whole-body water turnover is related to energy turnover or oxygen consumption (Silanikove, Reference Silanikove1989). Langhans et al. (Reference Langhans, Rossi and Scharrer1995) also reported that the act of eating can, in itself, produce several thrust stimuli, such as a sensation of dryness in the mouth, increased ruminal osmotic pressure and postprandial hypertonicity of extracellular fluid or even of plasma, even though these stimuli may be less clear in ruminants compared with monogastric animals. The fact that DMI explained much less FWI variability compared with TWI and that DM content is the best predictor of FWI could be related to a compensation between water ingested with feed and FWI. TWI comprised FWI and water ingested with the feed. At a given DMI level, when the DM content of the feed decreased, the amount of water ingested with feed decreased and the cows had to increase their FWI intake to maintain an amount of TWI consistent with DMI. This was also observed by Kume et al. (Reference Kume, Nonaka, Oshita and Kozakai2010). The inclusion of DM content as an important predictor of FWI has been considered by, at least, all the authors who considered diets based on fresh herbage, such as Paquay et al. (Reference Paquay, De Baere and Lousse1970), Stockdale and King (Reference Stockdale and King1983) and Castle and Thomas (Reference Castle and Thomas1970). It has also been reported by Paquay et al. (Reference Paquay, De Baere and Lousse1970) and Stockdale and King (Reference Stockdale and King1983) that feed DM content had a negative impact on TWI, indicating that the FWI would replace feed water at rates below 1, when feed DM contents increase. The main reason suggested by Paquay et al. (Reference Paquay, De Baere and Lousse1970) was that low DM content diets were also those with high N and K contents, requiring additional ingestion of water to allow urinary excretion. In our equations, the DM content was not retained as a predictive parameter of TWI, likely because a positive and quadratic effect of the content of CP ingested with forage was retained, confirming the hypothesis of Paquay et al. (Reference Paquay, De Baere and Lousse1970). The content of CP ingested with forage may also represent a part of the variability of the amount of K ingested with forage if we consider that a positive correlation between these contents exists when comparing feeds.
It is interesting to note that DMI was retained as the second predictor of FWI after diet DM content and as the first predictor of TWI, whereas MY explained only small proportions of FWI and TWI variability. The fact that DMI and MY are often correlated can induce collinearity problems and instability in the predictive equations. In many published predictive equations of FWI, both these variables were included (Little and Shaw, Reference Little and Shaw1978; Murphy et al., Reference Murphy, Davis and McCoy1983; Holter and Urban, Reference Holter and Urban1992; Cardot et al., Reference Cardot, Le Roux and Jurjanz2008) and indeed a high degree of parameter estimate variability could be observed between equations. The fact that DMI was adopted as a main predictor of FWI and TWI instead of MY in our equations may be due to the fact that we treated dry and lactating cows on the same level. When DMI was excluded from the candidate parameters, MY actually entered into the equation as a main predictor and explained the same range of variability as DMI, but the prediction error increased.
Can urine water flow be predicted without considering the electrolyte content of the diet?
In the present study, the content of CP ingested with forage and concentrate expressed in g/kg DM were the principal factors affecting urine water. Dietary CP was included in other published predictive equations of urine water (Holter and Urban, Reference Holter and Urban1992; Fox et al., Reference Fox, Tedeschi, Tylutki, Russell, Van Amburgh, Chase, Pell and Overton2004), but in none of these equations did dietary CP explain alone the entire variability in urine water excretion. In our equation, CPc and CPf were the best predictors of urine water, probably due to their association with DMI in equation (6) or MY in equation (7). Under these conditions, they likely constitute a broad indicator of the excess of dietary N intake in relation to the physiological use of N, a better indicator being plasma urea concentration. Nennich et al. (Reference Nennich, Harrison, VanWieringen, St Pierre, Kincaid, Wattiaux, Davidson and Block2006) reported that urine water could be predicted from milk urea nitrogen alone with an r.s.d. of 5.8 kg/day on a dataset of 372 data and Kauffman and St Pierre (Reference Kauffman and St Pierre2001) quantified close relationships between milk urea N concentration, plasma urea N concentration and daily urea excretion in urine. These results indicate that the amount of urea to be excreted is a strong determinant of urine water excretion, and likely of urine osmolarity, at least under the conditions in which these data were obtained, that is, at thermoneutrality, excluding poor N diets. Maltz and Silanikove (Reference Maltz and Silanikove1996) clearly illustrated that cows have a poor ability to concentrate urine and that an increase in the amount of urea to be excreted, for instance high protein intake at the onset of lactation, leads to an increase in urine volume, with a notion of urinary fixed osmotic ceiling. This is different in humans or dogs, in which urine osmolarity could be enhanced by the excretion of high amounts of urea.
However, it is likely that our predictive equation of urine water may have been more precise if Na, and possibly K intake were included as candidate regressors because these minerals also contribute to the osmotic pressure of urine (Bannink et al., Reference Bannink, Valk and Van Vuuren1999; Nennich et al., Reference Nennich, Harrison, VanWieringen, St Pierre, Kincaid, Wattiaux, Davidson and Block2006; Kume et al., Reference Kume, Nonaka, Oshita, Kozakai and Hirooka2008). Maltz and Silanikove (Reference Maltz and Silanikove1996) reported an inversely proportional relationship between urea and electrolyte solute concentration. They illustrated in dairy cows that an increase in the amount of urea to be excreted leads to a decrease in urinary electrolyte concentration without any significant change in urinary osmotic pressure. This should also mean that an increase in the amount of Na to be excreted could induce a decrease in the urinary urea concentration. Nennich et al. (Reference Nennich, Harrison, VanWieringen, St Pierre, Kincaid, Wattiaux, Davidson and Block2006) reported that the addition of Na intake to milk urea nitrogen as a predictive value significantly improved the prediction of urine water. Bannink et al. (Reference Bannink, Valk and Van Vuuren1999) were able to predict urine water from Na and K intake with an SE of 4.22 L from a dataset of 67 data obtained from trials of N, minerals and water balance and the addition of N intake as a regressor did not improve the prediction. In the equation of Bannink et al. (Reference Bannink, Valk and Van Vuuren1999), Na intake caused approximately twice more urine water excretion than K intake per unit weight and this may be linked to the fact that the molar mass of K is almost twice that of Na and thus the impact of the excretion of 1 g of K on the osmotic gradient would be half of that of 1 g Na, in relation to the concept of a fixed urinary osmotic ceiling defended by Maltz and Silanikove (Reference Maltz and Silanikove1996).
Although Na and K intake could have improved the urine water prediction presented in this paper, these parameters are very difficult to determine in practice, particularly if the animals have unrestricted access to mineral licks. However, the inclusion of the content of CP ingested with forage as a regressor in the predictive equation presented in this paper probably allowed to partially account for the electrolyte content of the diet and more specifically for the K content. Kume et al. (Reference Kume, Nonaka, Oshita, Kozakai and Hirooka2008) found a high positive correlation between CP and K in first-cut alfalfa, but a clear correlation could also be observed between the CP content and the mineral content of forages and more specifically the K content when different forages were compared (INRA, 2007). This is particularly clear when comparing grazing and conserved forage-based diets (de Boer et al., Reference de Boer, Smits, Mollenhorst, van Duinkerken and Monteny2002).
It is interesting to note that the content of CP ingested with concentrate appeared only in the prediction equation of urine water and TWI. The major difference between the content of CP ingested with forage and concentrate in our dataset is that the former is often correlated to the amount of mineral ingested with forage and more particularly to the amount of K (INRA, 2007), whereas the latter could integrate a significant proportion of urea. Both protein or electrolytes in excess can potentially lead to an increase in urine output in order to eliminate the higher quantity of nitrogenous waste produced or to maintain the blood electrolyte balance (Maltz and Silanikove, Reference Maltz and Silanikove1996; Sannes et al., Reference Sannes, Messman and Vagnoni2002).
Fecal water predictions
Published predictive equations of fecal water specific to dairy cows are scarce (Paquay et al., Reference Paquay, De Baere and Lousse1970; Holter and Urban, Reference Holter and Urban1992). In the present paper, to avoid a negative prediction of fecal water, particularly during the external validation step, fecal water must be broken down into a prediction of fecal DM excreted (fecal DM) and DM of the feces (fDM%). As expected, DMI was the first predictor of fecal DM, which is consistent with the fact that the range of variation of DMI in the dataset was significantly higher than that of DM digestibility. As already underlined by Holter and Urban (Reference Holter and Urban1992), the CONC in the diet was the first determinant of fDM%. The content of CP ingested with forage was also a predictive parameter of fDM%, likely because this parameter accounts for the huge difference between diets based on stored forage and grazing. De Boer et al. (Reference de Boer, Smits, Mollenhorst, van Duinkerken and Monteny2002) reported that grass contains a high amount of minerals compared with corn silage for instance, particularly potassium. This mineral load is excreted into the urine by the kidney but only to a certain extent, and a large amount of potassium in particular can be excreted with water in the feces.
FWI and TWI predictive equations should not be used when ambient temperature exceeds 25°C
The FWI and TWI predictive equations were clearly less precise when external validation was performed on the full validation dataset compared with the dataset restricted to data obtained under 25°C, but the precision of the predictive equations of urine and fecal water did not decrease, at least when DMI was included as a predictive parameter. It clearly appears that equation (2) underestimated FWI by 41.1 kg/day on average for data obtained with an ambient temperature above 25°C and equation (4) underestimated TWI by 26.63 kg/day. Thus, the use of these equations must be restricted to situations in which ambient temperatures do not exceed 25°C. The impact of ambient temperature on our predictions is highly consistent with the fact that an increase in ambient temperature above an upper critical temperature makes cows, as all other homeothermic mammals, exponentially increase the flow of water loss by evaporation in order to regulate their body temperature (Johnson, Reference Johnson1970). At 39°C, the evaporation of 1 kg of water allows a dissipation of ∼2500 kJ as latent heat. Maia et al. (Reference Maia, daSilva and Battiston Loureiro2005) observed that evaporation significantly increases in dairy cows when ambient temperature exceeded 25°C, even though the increase in latent loss starts at a lower temperature. The fact that the inclusion of data obtained at a temperature exceeding 25°C affected the prediction of FWI and TWI, but not of urine and fecal water, could suggest that the cows compensate for the increase in evaporative water loss at a higher temperature mainly by increasing their water intake. In the few published studies of the effect of ambient temperature on water flow partitioning in dairy cows (McDowell et al., Reference McDowell, Moody, Van Soest, Lehmann and Ford1969; Kurihara et al., Reference Kurihara, Shibata and Mukai1984; Richards, Reference Richards1985), it has been observed that urine water flow increased when ambient temperature exceeded 25°C but the range of increase remained generally low compared with the increase in water intake, at least in lactating cows. These studies also reported a significant decrease in fecal water when the temperature increased, but this decrease was generally proportional to the decrease in feed intake and could thus be indirectly accounted for in our predictive equation. It is likely that the association of the predictive equation of FWI and TWI developed in this paper with a simple thermic model of cows able to predict latent loss and then evaporated water (Commission International du Genie Rural (CIGR), 1984; Ehrlemark, Reference Ehrlemark1988) could allow the impact of temperature on water intake to be predicted under a broad range of climatic conditions.
Prediction validity when DMI is not available or for dry cows
In this study, for each water flow, predictive equations that did not include DMI as a predictive parameter were always proposed to allow predictions under conditions for which DMI would not be available but the diet would be well known. This could be, for instance, the case of commercial dairy farms when the cows are fed a total mixed ration, as in this case, the CONC in the diet or the amounts of CP of the diet ingested with concentrate and forage expressed in g/kg of DM could be evaluated. The inclusion of DMI as a predictive parameter in the prediction of FWI decreased the RMSPE of external validation from 14.9 to 13.6 kg/day (Figure 1). This decrease was very limited compared with that obtained for TWI (26.2 v. 15.5 kg/day; Figure 2). For this reason, to predict TWI, the use of DMI predictive systems, among which are the fill unit system in France (INRA, 2007), the ‘Verzadigingswaarde’ in the Netherlands (CVB, 2007), the CNCPS (Roseler et al., Reference Roseler, Fox, Chase, Pell and Stone1997) or the system developed in Nordic countries (NorFor, 2011), can also be considered to allow the use of equation (4) including DMI as a predictive parameter. However, there are also errors associated with those DMI predictions. We estimated that the RMSPE of TWI prediction was 14.0 kg/day with equation (5) on the dataset used to construct the equations and was 22.2 kg/day with equation (4) including DMI predicted by the fill unit system (INRA, 2007). Unfortunately, this comparison could not be carried out on the dataset used for external validation due to the difficulties in determining all the parameters necessary to use the fill unit system. The strategy of using DMI predictive systems must be considered when concentrate and forage are given separately or at grazing, in order to evaluate the CONC in the diet or the content of CP ingested with concentrate and forage expressed in g/kg DM. The use of the equation excluding DMI to predict urine flow would also lead to a slight decrease in precision, but the choice of this equation for fecal water prediction can have a strong impact, even though the RMSPE of both equations, whether excluding DMI or not, are very similar because of a significant change in the bias observed in the slope between the observed and the predicted value.
Another choice in this paper was to develop common equations for dry and lactating cows. It was shown by internal validation that the predictive equations developed here were always less accurate for dry compared with lactating cows. The main reasons for this may be that the dataset used to develop the equations had more than 82% of data obtained on lactating cows and that the range of the DM content of the diet fed to dry cows was low compared with lactating cows. The decrease in accuracy between dry and lactating cows remained limited for all flows when DMI was included as a predictive parameter. However, when DMI was excluded, for all flows, except for FWI, the decrease in accuracy was more significant. Thus, for dry cows, when DMI is not available, a DMI predictive system, along with an equation including DMI as a predictor for the prediction of urine and fecal water, should also be used.
Conclusion
This study provided a new set of equations to predict the water intake and excretion flows in dairy cows from cow production status and the nature of the diet under conditions of thermoneutrality. A main strength, among others, of these equations is that they were constructed from a dataset with a large variability in diet DM. It thus appears that the DM content of the diet was the main determinant of FWI in dairy cows and that this flow could be predicted, even if DMI was unknown, with an RMSPE of 20% of the observed flows across a broad range of situations found in the literature. It has also been shown that a prediction of urine flow with an equation excluding electrolyte intake that is often difficult to obtain in practice is possible with an RMSPE of 20% of the observed flows from several studies in the literature. It appeared from the external validation that the equation proposed in this paper clearly underpredicted water intake when the ambient temperature was higher than 25°C. In a context of global climate change, this illustrates the need, in the future, to include climatic parameters in the predictive equations, in such a manner that they can be used across geographic localizations and climates.
Acknowledgement
The authors thank all the members of the ‘physiology’ team of the experimental farm of Mejussaume and the ‘lab’ team of the former SRVL and UMR PL for their carefull collection of the data necessary to this paper during the last 30 years. The authors also thank R. Delagarde, J.L. Peyraud and R. Vérité to have allowed the use of their original data. The authors are thankful to the agency Caractères et Caetera for its assistance in editing this manuscript.