What political conditions permit the establishment of a state legal institution capable of widespread property rights enforcement? Much seminal work on this question argues that legal institutions benefit states by enabling long-term, taxable economic growth, and concludes that their establishment requires rulers who are politically secure: there would be little incentive to invest in developing or administering law without the expectation of reaping the future benefits of this investment (Olson, Reference Olson1993; Besley and Persson, Reference Besley and Persson2011). Yet, even a canonical example of legal development—the emergence of property rights institutions in England—does not clearly conform to this theory. While some scholars argue that widespread property security in England materialized only after a constitutional monarchy was established in 1688 (North and Weingast, Reference North and Weingast1989; DeLong and Shleifer, Reference DeLong and Shleifer1993; Olson, Reference Olson1993), many historians have described the English common law system as providing widely accessible property protections from the medieval period onward (Pollock and Maitland, Reference Pollock and Maitland1895; Clark, Reference Clark1996; Baker, Reference Baker2002; Ogilvie and Carus, Reference Ogilvie, Carus, Aghion and Durlauf2014), in spite of the significant political insecurity of England's medieval monarchs (see, e.g., Bartlett, Reference Bartlett2000).
In this paper, I suggest an explanation for the development of property rights institutions under at least one form of political insecurity: when leaders face internal threats to their rule. Such leaders need both political support and revenue, but may be constrained in the means of obtaining them. While political threats, by increasing the need for revenue, are generally thought to motivate fiscal capacity building (e.g., Tilly, Reference Tilly1990; Besley and Persson, Reference Besley and Persson2011), rulers facing domestic threats may fear the political consequences of taxation (Dincecco et al., Reference Dincecco, Federico and Vindigni2011). Legal institutions provide an alternative, less politically controversial, means of raising short-term revenue—through legal fees and fines. Moreover, the extension of new legal protections to subjects may be one rapid means of gaining domestic support.
To investigate whether rulers facing domestic threats do use legal institutions to generate support and revenue, and whether this contributes to the establishment of strong property rights enforcement, I turn to the canonical example mentioned above.Footnote 1 England's medieval monarchs faced near-constant internal threats during the period in which the common law system first emerged from the English Royal Court. Moreover, a wealth of administrative records from this period survive. I leverage these records to produce two original datasets on English court activity. My primary dataset contains information on over 40,000 debts owed and paid into the English treasury from 1183 to 1203, including over 16,000 court fees and fines. A secondary dataset contains approximately 1200 Royal Court litigation settlements recorded between 1182 and April 6, 1199.
To mitigate problems of confounding, I conduct my main analysis by leveraging an exogenous shock to domestic political security in England: the shipwreck and subsequent kidnap of King Richard I for ransom in 1192. This event motivated an internal rebellion by Richard's younger brother John; thus, in its aftermath, the crown badly needed both political support and revenue. Geographic variation across England in the threat John posed allows me to parse the two mechanisms by which this threat might have affected legal activity, by investigating whether the Royal Court was deployed to build support in areas at greatest risk from John, and to generate revenue elsewhere.
I find evidence that, immediately post-kidnap, Royal Court activity focused on the counties in England most threatened by John. In those areas, the Court increased its provision of property protections and other services and reduced the burdens it imposed upon the populace. By contrast, while throughout the 20-year period under study, the crown derived substantially more revenue from court fees and fines than from taxes, I find little evidence that the Court targeted safer parts of England for revenue generation immediately after the kidnap.
After discussing alternative explanations and potential threats to inference, I examine the kidnap's effect over a longer time period to understand its broader relevance. I find that higher Court service provision and lower burdens persisted in threatened areas for some time after the threat of John had diminished, and that many of these benefits spread to safe areas. I speculate that these patterns indicate a sustained expansion in the Royal Court's capacity and accessibility. Consistent with this account, I show that post-kidnap, judicial specialization, investment in local justice provision, and court usership all increased.
These findings suggest one way to reconcile the existing theories of legal development with the historical fact that legal institutions have sometimes developed under rulers focused on short-term survival. They do so by providing a new explanation for the emergence of property security and a professional judiciary in medieval England: by rendering political support essential (and high taxes dangerous), English monarchs’ frequent internal insecurity motivated investment in and deployment of the Royal Court. Because they suggest that political stability and the disinterested maintenance of legal institutions by the state are not necessarily preconditions for the establishment of property security, these insights may also be interesting to policymakers.
1 Background
Richard Lionheart became king of England on September 3, 1189. He left England the following January to join the crusades, financing the expedition by selling valuable royal privileges (lucrative administrative posts, the guardianship of minor heirs) and extracting heavy fines for “corruption” from some wealthy, less-popular members of his father's administration. His biographer, John Gillingham (Reference Gillingham1999), notes that imposing a general tax would have been too politically risky. Before departing, he appointed regents to oversee the country, and, to dampen his brother John's royal ambitions, gifted him six counties and a number of smaller territories (Morris, Reference Morris1992). While John nevertheless began conniving to acquire the throne as soon as Richard's ship sailed, he was threatened into good behavior by the regents, and for the most part, affairs in England proceeded routinely (Gillingham, Reference Gillingham1999). This state of affairs continued until December 1192, when the returning king was shipwrecked and kidnapped for ransom by the Holy Roman Emperor, Henry VI.
The kidnap was wholly unanticipated. According to Gillingham, “the provisions Richard had made for defending and governing his dominions during his absence …had worked well. …But his imprisonment provoked a totally unforeseeable crisis” (Reference Gillingham1999, 251). Henry VI described the capture as follows (Gillingham, Reference Gillingham1999, 222):
[A]s [Richard] was crossing the sea on his way back to his dominions[, h]is ship was driven by winds onto the Istrian coast and there it was wrecked at a place between Aquileia and Venice. By God's will he and a few others escaped. …But the roads were watched and guarded, and our dearly beloved cousin, Leopold duke of Austria, captured the king in a disreputable house near Vienna.
For the emperor, the shipwreck was lucky indeed: he needed money both to combat an internal rebellion and to fund external military campaigns (Gillingham, Reference Gillingham1999). He therefore promised to release Richard upon payment of a ransom.
When the news reached England, John immediately claimed the throne and allied himself with King Philip of France, forcing the regents to simultaneously raise the ransom and defend the kingdom from John and a potential French invasion. But John proved unable to extend his reach far beyond his own lands. While he apparently enjoyed support in these areas, and among some noblemen in the counties that neighbored his northern military strongholds, he failed to build a broad coalition against Richard, and Philip never invaded (Howden,1201, Reference Howden1870). Consequently, most of John's castles, outside these northern strongholds, were confiscated in the first three months after the kidnap. An uneasy peace prevailed through the following year, as the regents organized a special treasury to collect the ransom, raising funds through a general tax and loans from the churches (Devizes,1192; Reference Devizes1841; Howden, 1201, Reference Howden1870; Morris, Reference Morris1992; Gillingham, Reference Gillingham1999). In February 1194, after England's payment of 100,000 marks, Richard was released. He returned that spring, conquered John's northern castles, then departed to retake territory annexed by Philip during his captivity, tasking the Chief Justice of the Royal Court with replenishing the treasury, repaying the church loans, and funding the French expedition. He died in 1199 having never returned to England.
1.1 The Royal Court
The late 12th century Royal Court was a body composed of the king and his justices—not judges in the modern sense, but advisors who often held other ministerial positions as well—who periodically traveled, together or separately, through the kingdom dispensing royal justice. It worked largely by the imposition of fees and fines. While serious felonies—theft, murder, and forgery—were punishable with death or mutilation, minor criminal acts against other individuals or the crown, and serious violations of Court procedure, were punished by fine. The Court also, for a fee, adjudicated disputes, granted licenses for economic activity, allowed the King's tenants to sell or bequeathe their estates, and sold royal privileges. Finally, it oversaw a kind of bail system, where litigants obtained the continued hearing of their cases, or their own release from pre-trial imprisonment, by the promise of monetary sureties to guarantee their continued appearance.Footnote 2
Over the reigns of Henry II (1154–1189), Richard I (1189–1199), and John (1199–1216), the Royal Court expanded from a body with limited capacity and jurisdiction into a country-wide institution with broad authority (Baker, Reference Baker2002, 13–32). At the beginning of Henry's rule, the Court was neither affordable nor powerful enough to play a role in the lives of most English subjects; by its end, the Court could punish a wide range of conduct and adjudicate all property disputes falling under a broadly interpreted set of royal decrees. Under Richard, “men of humble station” gained physical and financial access to the Court (Pollock and Maitland, Reference Pollock and Maitland1895, 138); by his reign's end, they were coming in droves before it, “prepared to pay money for royal justice” (Baker, Reference Baker2002, 13–4). In 1215, the Court's preeminence was solidified by the Magna Carta, which confirmed that English subjects were entitled to have Court deputies come into every county four times a year to resolve property disputes (Pollock and Maitland, Reference Pollock and Maitland1895, 151). Remarkably, this rapid development occurred during a period in which England's kings were beset almost continuously by external and internal threats.
1.2 Royal politics
John's treachery during Richard's captivity was the rule, not the exception, in medieval politics. Every medieval English king faced the threat of overthrow by ambitious kinsmen and other nobles, as well as by foreign powers. Richard's own family history is illustrative. His father Henry became king of England after an 18-year civil war. During his 35-year reign, he began an intermittent, century-long war with France and faced down rebellions by the Scots, the Welsh, and various powerful noblemen—including, at different points, each of his sons (Warren, Reference Warren1977). Richard himself was forced to quash his brother John's rebellion, and spent his last years at war with France (Gillingham, Reference Gillingham1999). Less able than his relatives, John lost most continental territory to France within five years of becoming king, and was eventually forced by a successful baronial rebellion to sign the Magna Carta (Morris, Reference Morris1992).
Kings needed a continual flow of money and support to face these constant threats. Military campaigns required funding to succeed. Survival also necessitated balancing “the very greatest men against each other or against groups of lesser men,” and preventing “the formation of an opposition faction of any size” (Bartlett, Reference Bartlett2000, 58). The support of the general population was important, since both the king's and his opponents’ power depended ultimately on whether, and how willingly, knights and peasants would fight for their local lords as opposed to their king (Salzmann, Reference Salzmann1917). Several examples illustrate this point. Henry II's predecessor Stephen was at last defeated because of the disloyalty of his vassals: feudally obligated to join his army, they showed where their support really lay by being “very slack and negligent in their services” and attempting to secretly negotiate a truce with Henry (Warren, Reference Warren1977, 50). A rebellion by Henry's sons in 1173–74 turned in Henry's favor after supportive local landowners raised a private army to aid one of Henry's besieged castles (Warren, Reference Warren1977, 135), and the citizens of London gave Henry their support (Bartlett, Reference Bartlett2000, 57). In 1215, these same citizens lent their support to the barons rebelling against King John, forcing John to come to terms (Bartlett, Reference Bartlett2000, 64).
2 The political value of a legal institution
There is substantial evidence that legal institutions are often used to generate income (e.g., Rhode, Reference Rhode2004; Klerman, Reference Klerman2007) and build support (e.g., Onoma, Reference Onoma2009; Holland, Reference Holland2016). Intuitively, the value of maintaining and deploying a legal institution for these purposes should depend upon both how badly a government needs support and revenue, and how many ways it has to secure them. I argue that domestic political insecurity should increase this value, by increasing a ruler's need for both revenue (to fund conflicts) and political support (to win conflicts), while limiting the means of obtaining them. For example, domestic unrest likely renders the imposition of new taxes politically risky (Dincecco et al., Reference Dincecco, Federico and Vindigni2011). Similarly, under conditions of unrest, alternative ways of building support, such as by providing durable public goods to important factions, might take too long, require the imposition of unpopular taxes, or be too vulnerable to exploitation by domestic enemies.
In the medieval English case, it seems likely that domestic insecurity made legal fees and fines a politically appealing alternative to general taxation: unlike taxes, fines affected only a small minority of individuals, and fees were voluntary payments for a service. Domestic instability also increased rulers’ need for widespread support, and the Royal Court was uniquely placed to promote such support. First, it was one of the only state institutions with the ability to provide anything close to a public good, meaning the easiest way to provide new benefits to subjects would likely have been through the Court: by multiplying the services it offered, or lessening the burdens it imposed. Second, because the Court was still closely tied to the king, there was no guarantee that rights extended by one ruler would be maintained by another. This gave subjects strong incentives to support a king under whom they enjoyed new protections (Salzmann, Reference Salzmann1917). Two hypotheses follow from these arguments:
Hypothesis 1 (Support-seeking) Domestic political insecurity caused the Royal Court to expand the legal services and protections it offered the population, while decreasing the burdens it imposed, in order to build political support for the crown.
Hypothesis 2 (Revenue-seeking) Domestic political insecurity caused the Royal Court to adapt legal fees and fines in order to raise revenue for the crown.
There is some qualitative evidence for both hypotheses. With regard to the first, some medieval writers praised the Royal Court for giving the poor access to justice (de Diceto, Reference de Ralph1876; Nigel, Reference Nigel1983). One historian, Salzmann (Reference Salzmann1917), argued that Henry II's legal reforms were in part implemented to gain popular support, and attributed Henry's long hold on power partly to the fact that the general population “had every reason to appreciate his rule and to fear the victory of the feudal reactionaries” (189). And Richard at least knew the political usefulness of forbearance: one of his first acts as king was to give a very popular pardon to all subjects standing accused of a range of minor crimes (Howden,1201, Reference Howden1870; Gillingham, Reference Gillingham1999).
With regard to the second, various historians have noted that rulers like Henry II and Richard I understood, and tried to avoid, the political risks of taxation (Salzmann, Reference Salzmann1917; Gillingham, Reference Gillingham1999). Medieval chroniclers have also described the Royal Court under Henry II and his sons as a “seller of justice” (e.g., Niger, Reference Niger1851); certainly, one of the Court's chief justices cited the huge revenue he had already generated for the Crown in a plaintive letter to King Richard asking to be allowed to retire (Cheney, Reference Cheney1967, 97). As a result, scholars like Baker (Reference Baker2002) and Pollock and Maitland (Reference Pollock and Maitland1895) have suggested that the Court's profitability probably helped motivate royal investment in it, although they do not link this profitability to domestic insecurity.
These accounts suggest that England's medieval kings may indeed have maintained and deployed the Court to generate revenue and support in the face of domestic insecurity. But it seems unlikely that the Court could have achieved both goals in the same place, at the same time. Extending services and protections to a wider segment of the population would presumably involve lowering fees while investing in greater capacity, which—especially given medieval England's wealth inequality—might not have been financially optimal: specializing in service provision to the wealthy might have been more profitable. Moreover, a Court seeking support might not wish to impose heavy fines, while a revenue-seeking Court might decrease fees for services to incentivize purchase, but should always extract the maximum possible in fines. However, if the threat of domestic unrest varied across regions in England, it is possible that the Court could have targeted support-seeking strategies to counties where that threat was highest, and revenue-generating strategies to places where the risks attendant on alienating the local population were low. I argue below that, because counties varied in their proximity to John's rebellion, King Richard's kidnap constituted a domestic security shock with precisely this sort of heterogeneous severity. I therefore empirically test the hypotheses above by leveraging the heterogeneous effect of the kidnap shock on local support for the king, using county-specific data on Royal Court activity.
3 Data
My data are primarily drawn from two decades of yearly English government records (the “Pipe Rolls”), from the fiscal year ending September 29, 1183 to that ending September 29, 1203 (Hunter, Reference Hunter1844b; The Pipe Roll Society, 1911–1938. Each year, on this date, crown officials from every county would meet in the royal treasurer's office, and begin the process of recording all debts paid or owed to the treasury that year for feudal taxes, rents and profits on crown property, and court fees and fines. Each debt specified the debtor's name and county of residence, the reason for the debt, and where relevant, the Court justices who imposed it. Since the county was the relevant administrative unit, debts were organized by county or county-pairFootnote 3 : neither precise dates nor debtors’ locations within a county were recorded. Individual debts often took years to clear, with debtors frequently paying down their obligations by the same proportion of the original amount every year. Many debts thus took the form of accounts: the current balance was listed each year until the debt was cleared.Footnote 4 Whether an entry recorded a new debt was often, though not always, stated.
These documents are generally viewed as relatively complete, accurate records of yearly payments owed and made to the royal treasury. While omission or misrepresentation of accounts by corrupt or incompetent officials cannot be fully ruled out, the treasury had an effective system in place to prevent this, and from the perspective of historians, the largest threat to the integrity of the Pipe Rolls appears to be (the relatively rare incidence of) water damage (The Pipe Roll Society, 1884). However, these payments do not comprise all income collected by the crown, because the records do not include information on sums that did not pass through the treasury. In the period under study, the proceeds of two emergency taxes—the crusade tax of 1188, and the tax imposed to pay Richard's ransom in 1193—fit this bill. Much of these proceeds were sent to separate, emergency treasuries, the records of which do not survive (Stenton, Reference Stenton1925). The Pipe Rolls also include little information on areas not under Crown control: baronial land, the semi-autonomous regions of Cheshire and Durham, and the land held by John 1190–1194.
To supplement my analysis, I also collected data on all medieval final concords concluded before the Royal Court from 1182 to Richard’s death in April of 1199 and preserved in the English Public Records office (Hunter, Reference Hunter1844a; The Pipe Roll Society, 1894–1900).Footnote 5 These documents were, nominally, agreements to settle litigation over land. Some portion of them, however, are better understood as contracts or deeds: because final concords were available only to litigants, but were a valuable means of recording property ownership, by the late 1190s large numbers of people were bringing fictitious disputes to the Court in order to record the terms of property exchanges (Pollock and Maitland, Reference Pollock and Maitland1895, 94–103). Each final concord states the parties to the agreement, the county containing the disputed land, a description of the land, the settlement terms, the date, and the justices who witnessed it.
Both the Pipe Rolls and these final concords were originally recorded in abbreviated Latin script on parchment. In recent centuries, both have been transcribed and printed for preservative purposes, primarily by the Pipe Roll Society. During this process, the records’ Latin abbreviations were sometimes expanded. I converted expanded Latin documents into editable files using Optical Character Recognition software, supplemented by manual error-checking. If a document's Latin abbreviations were intact, I manually expanded the abbreviations and entered the data into an editable format. Figure A1 in the Supplementary Appendix shows an excerpt from the printed, abbreviated Pipe Roll of 1189, and a rough translation.
This effort generated over 1200 individual final concords between 1182 and April 6, 1199, and 92,000 Pipe Roll debts between 1183 and 1203. Because many Pipe Roll debts belonged to accounts spanning multiple years, I used a fuzzy string-based matching algorithm to match accounts in year t − 1 with those in year t. This method identified over 40,000 new accounts between 1184 and 1203, of which 16,577 are court-related debts. Tables A1–A3 in the Supplementary Appendix provide descriptive statistics.
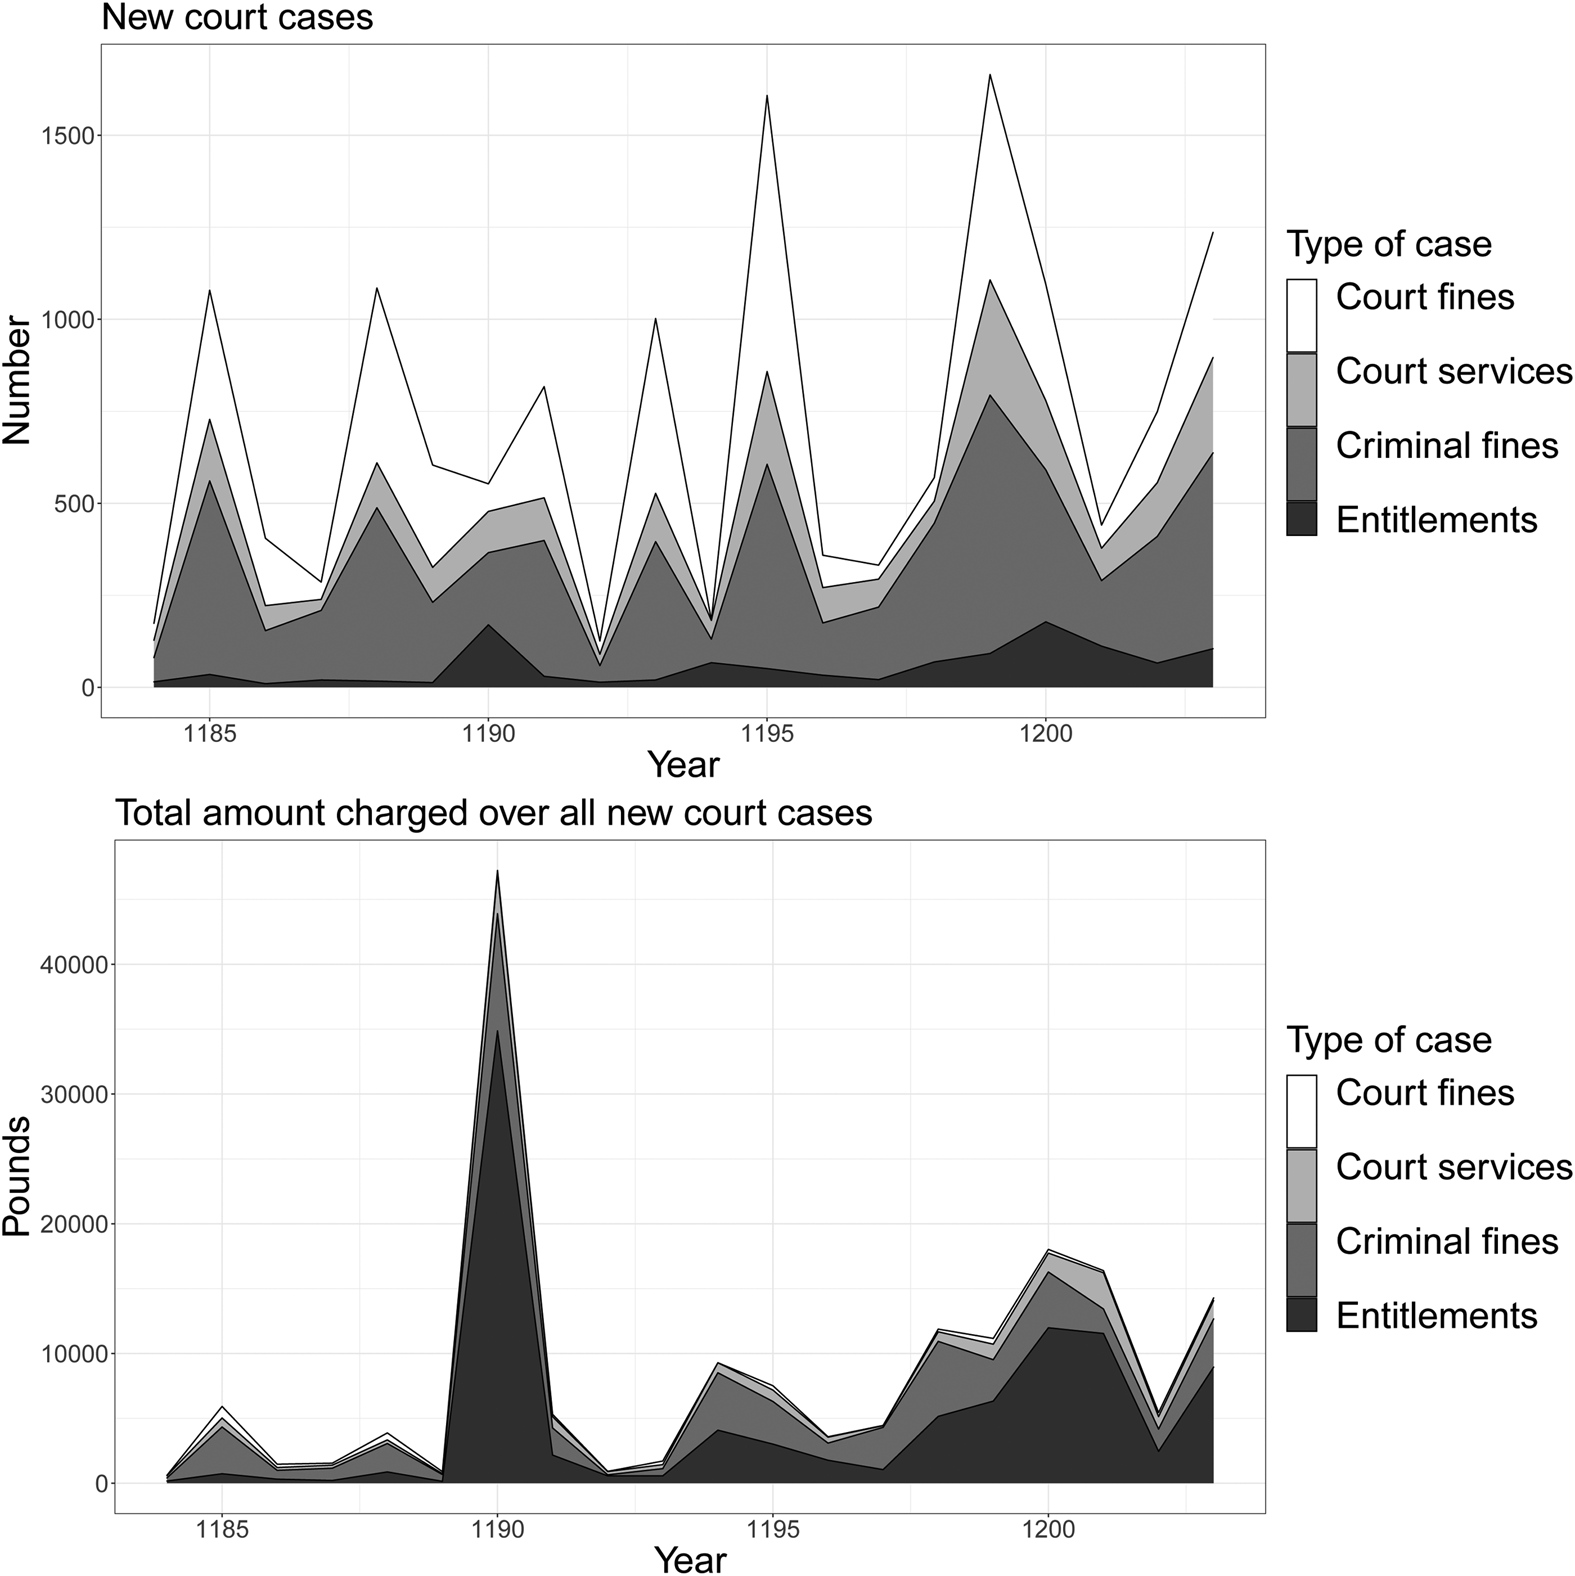
The number of new court debts recorded each year between 1184 and 1203, and the total yearly amounts charged by the Court, are shown in Figure 1. To illustrate the sorts of business the Court handled, I disaggregate court debts into four (noisy) categories. Criminal fines were imposed for violations of the rights of other individuals (infringing on private property, defrauding consumers) or of the state (poaching or gathering firewood on state land, failing to maintain communal order). Court fines were imposed for violations of court procedure. Court services encompass two types of services provided by the court: the direct adjudication of rights, and the continued hearing of a case or release of (usually) a defendant from pre-trial imprisonment in exchange for a bail payment if the individual withdrew his suit or absconded. Finally, entitlements include payments for privileges (marry an heiress, hold a lucrative administrative post), for license to conduct economic activity (e.g., land development), and to stay legal judgment or a court sentence.
Distribution across years of types of new cases and total amounts charged on each category. Top panel: Total number of new court cases recorded each year, stacked by categories. Bottom panel: Total pounds charged each year for cases in each type, stacked by categories. Counties not controlled by the crown throughout excluded; inclusion does not alter patterns depicted here.

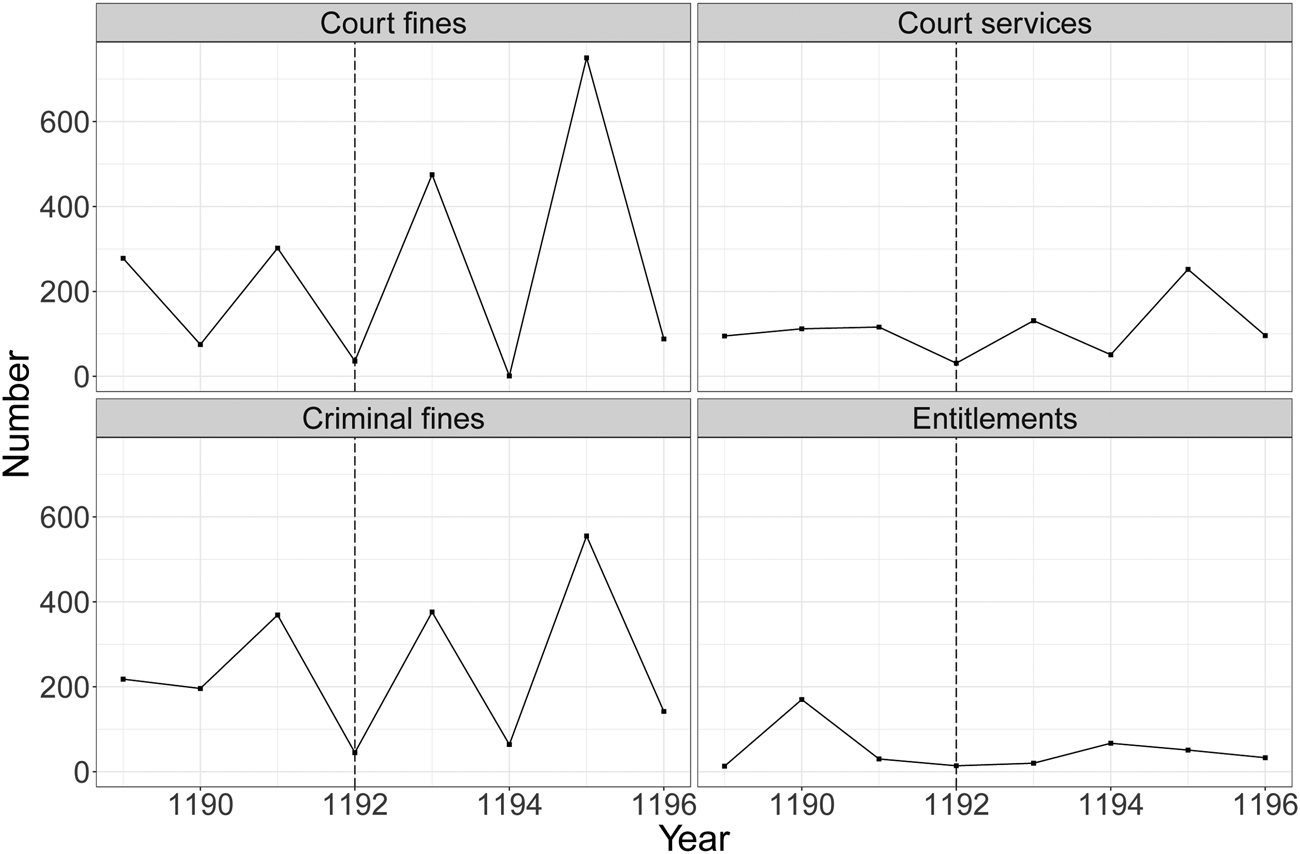
Several patterns are visible. First, over the entire period, both the annual number of new cases and the total charged for them increased significantly. Second, the annual number of new court cases fluctuated substantially, due to yearly variation in both how many counties the justices visited and how many debts they collected in each. During the earlier part of this period, justices appear to have focused on judicial business, on average, every other year, perhaps because they had other administrative duties (Hudson, Reference Hudson2012, 544–5). Although the pattern over the entire period is not clearly biennial, a biennial pattern in fines is evident between 1190 and 1196, as shown in Figure 2. Analytically, this suggests a direct comparison of 1192 (the last year before the kidnap) to 1193 (the first year after) might be inappropriate. Finally, there is a large 1190 spike in entitlements: this corresponds to Richard's efforts to raise crusade funds without imposing new taxes, by selling the rights to valuable lands and offices. (Richard's father had eschewed such sales, because in crown hands these lands and offices brought in yearly revenue.)
New court cases, disaggregated by type, for the years surrounding the kidnap in 1192. Total number of new cases handled by the Royal Court 1189–1196, disaggregated by type. The dashed line shows the last fiscal year before the kidnap: 1192. Counties not directly controlled by the crown throughout excluded; inclusion does not alter patterns depicted here.

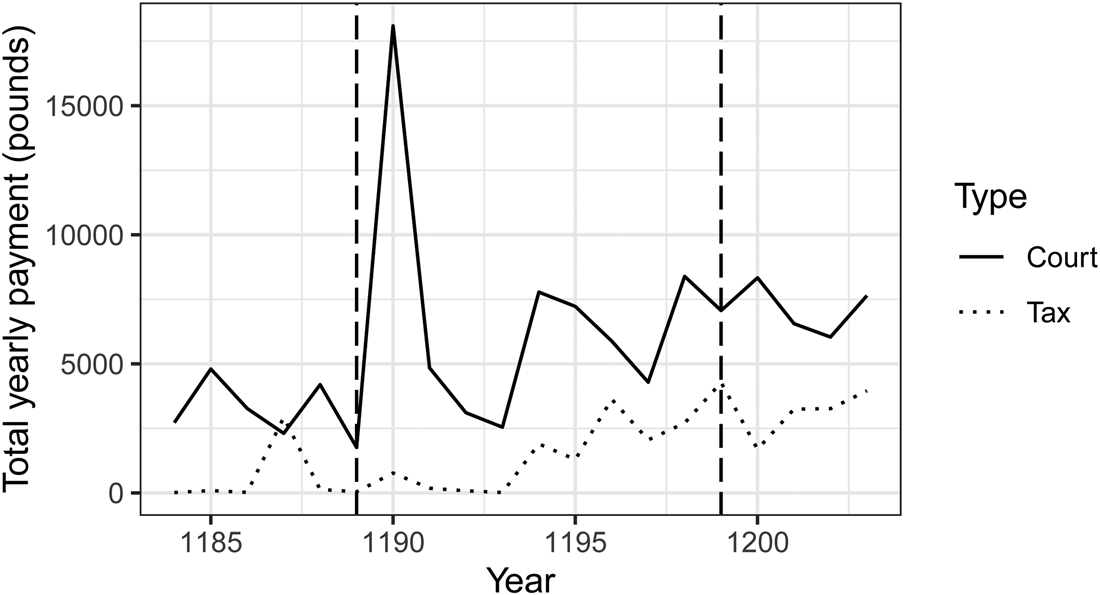
One last pattern of interest is shown in Figure 3. This figure depicts the total yearly amounts paid into the treasury for feudal taxes and court debts between 1184 and 1203. Although, as noted above, the data do not contain the full amounts of the extraordinary taxes imposed in 1188 and 1193, several conclusions may be drawn. First, the fact that individuals could pay (collectively) large amounts in legal fees and fines implies that a substantial amount of wealth was not expropriated through taxes. Second, since yearly court payments were usually two to three times higher than tax payments, either England's kings were more willing to demand court payments than taxes, or its subjects were more willing to provide them. Finally, Court revenue was substantially higher, on average, than tax revenue: over this 20-year period, the Royal Court generated an average of 6652 pounds in annual revenue; taxes generated just 1988 pounds.
Feudal tax debts paid versus court debts paid, 1184–1203. Dotted line shows all tax payments; solid line shows all Court payments. Horizontal lines demarcate the beginnings of Richard I's (1189) and John's reigns (1199). Counties not controlled by the crown throughout excluded; inclusion does not alter patterns depicted here.

4 Main empirical strategy
I leverage Richard I's 1192 shipwreck and kidnap as an unanticipated shock to the crown's domestic security and expenditure needs, and use the data described above to explore its effect on Royal Court activity. The kidnap's randomness alleviates concerns about the possible endogeneity of domestic instability to Court activity, allowing me to make simple pre- and post-kidnap comparisons. To minimize the risk of confounding from other events or trends, I focus primarily on Court activity within a range of short time windows around the kidnap. However, to assess the kidnap's long-term significance, I also evaluate the kidnap's effect over Richard's entire reign, and in the context of the full 20 years between 1184 and 1203.
While the kidnap affected all England, the political unrest it sparked was largely confined to areas under John's control. Thus, its precise effect on Richard's political security varied geographically, suggesting that the Court's response may have varied geographically as well. I conjecture the following: in areas where John posed a substantial threat, security concerns dominated, and in line with Hypothesis 1, the Court prioritized support-building by extending services and protections while decreasing financial burdens. In politically safer areas, financial concerns dominated, and the Court prioritized revenue generation through fees and fines, in line with Hypothesis 2.
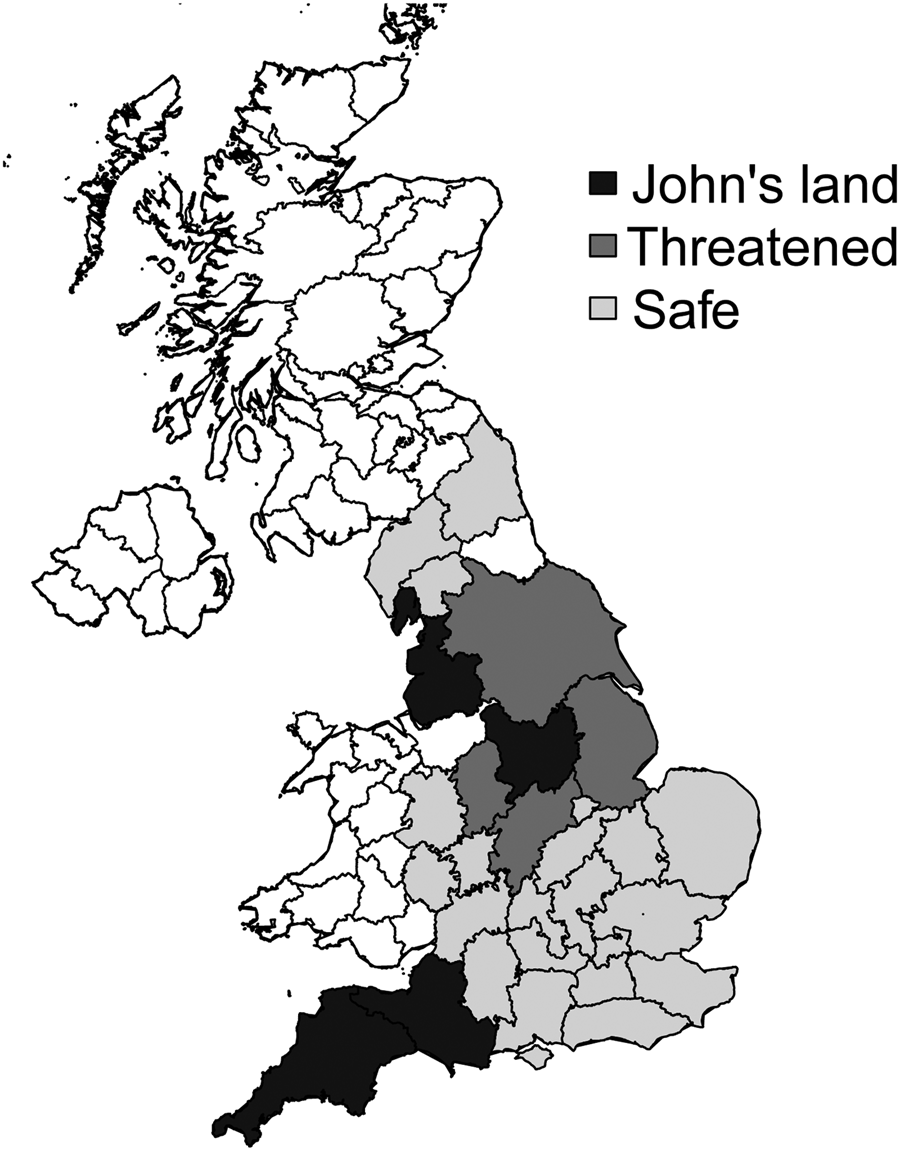
I operationalize the threat posed by Prince John with a simple measure that labels counties as threatened if they shared a border with militarily important territories of John's, and safe otherwise. I define militarily important territories as those in which John's major military forces were consistently present 1191–1194: the county pair Nottinghamshire and Derbyshire, and a region called Tickhill in crown-held Yorkshire (Devizes,1192; Reference Devizes1841; Foulds, Reference Foulds1991). This categorization is shown in Figure 4: all full counties held by John are in black; counties adjoining Nottinghamshire, Derbyshire, or Tickhill are in dark gray, and safe counties are in light gray.
Counties of England, proximity to John's major military strongholds. John's six counties are in black. The counties neighboring John's strongholds at Tickhill and in Nottinghamshire and Derbyshire are Lincolnshire, Leicestershire and Warwickshire, Staffordshire, and Yorkshire. They are labeled “Threatened” and colored dark gray. All other crown counties are labeled “Safe” and colored light gray. The two white English counties are the semi-autonomous palatinates of Durham and Cheshire. Data from the Historic County Borders Project, http://www.county-borders.co.uk/.

While this measure is coarse, it has several advantages. First, the measure is simple and transparent. More complex measures would be both more opaque and more ad hoc, given the unknowability of John's anticipated military strategy or its determinants—geography, local networks, and county administrations. Second, there is some evidence that the counties I label threatened were indeed especially vulnerable to John: his forces would have had to pass through them to get anywhere else, and John appears to have been connected with their noblemen. The only powerful nobles described by a contemporary chronicler, Roger Howden, as sympathetic to John were from threatened counties (Howden,1201, Reference Howden1870, 288–9, 316). These counties may also have been an important defense against John: they formed a geographic buffer, and may have been viewed as a potential source of manpower for attacks on John's strongholds. Indeed, the regency did levy an army in one threatened county for an attack on John's Tickhill castle (Howden,1201, Reference Howden1870, 314).
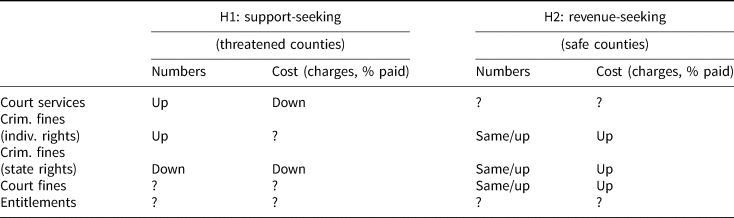
The theory that the Court aimed to build support in threatened counties has a number of observable implications. Since the main services the Court provided were to set bail and adjudicate disputes, court fees and bail payments (these were the subset of bonds forfeited, but all else equal they should reflect changes in bonds posted) should increase in threatened counties post-kidnap, while their cost should decrease—via a reduction in the price charged, amount paid immediately, or both. The Court's protections should also expand in these counties, as measured by the number of criminal fines imposed for violations of private property rights and consumer protection laws. (Whether the amounts fined for these crimes should have increased or decreased is hard to predict: increases would alienate perpetrators, but please victims.) However, fines imposed for minor crimes against the state (e.g., poaching) were a significant burden on the peasant population (Baker, Reference Baker2002); their number and cost should drop. It is unclear how the kidnap should have affected entitlement sales or court fines. The latter presumably burdened their targets but improved the Court's general efficacy.
The clearest observable implication of a revenue-seeking strategy in safe counties is that the number and average cost of both criminal and court fines should increase in these counties, post-kidnap. This strategy's implications for the number and cost of (voluntarily purchased) services and entitlements is less clear: the expected direction of the effect would depend on both the demand for such services and the administrative costs of providing them. While Hypothesis 2 also has implications for how the ratio of tax revenue to court revenue might change, post-kidnap, in safe and threatened counties, I cannot test these implications, because my data largely exclude the taxes levied to ransom Richard.
Table 1 summarizes these predictions. I evaluate them separately for threatened and safe counties, as follows. To ascertain whether the kidnap affected Court activity levels, I compare average case numbers pre- and post-kidnap, across case categories. To determine whether the kidnap affected costs imposed by the Court, I estimate a series of regressions, beginning with a simple bivariate regression of the form

where y ict represents the amount charged or proportion paid immediately for each new case in a given county-year, and kidnapt is a dummy variable that takes on the value of 1 after the kidnap.Footnote 6 I then incorporate county fixed effects, and account for the biennial pattern around the kidnap with an “even year” indicator variable and by comparing 1191 (not 1192) to 1193 in all one-year evaluations. (Given my hypotheses, using 1192 would substantially strengthen my results.) I balance the risk of confounding that accompanies longer time series analyses with the imprecision that accompanies a small number of observations by conducting these assessments for one, two, and three-year intervals around the kidnap. I limit myself to these intervals because the fourth year before the kidnap saw war between Richard and Henry II as well as Richard's subsequent coronation, suggesting that its inclusion might bias the results. Throughout, I define an account as new if I am unable to match it to an earlier account and its placement in the Pipe Rolls suggests that it is new.
Expected effect of the kidnap in threatened and safe counties

5 Main results
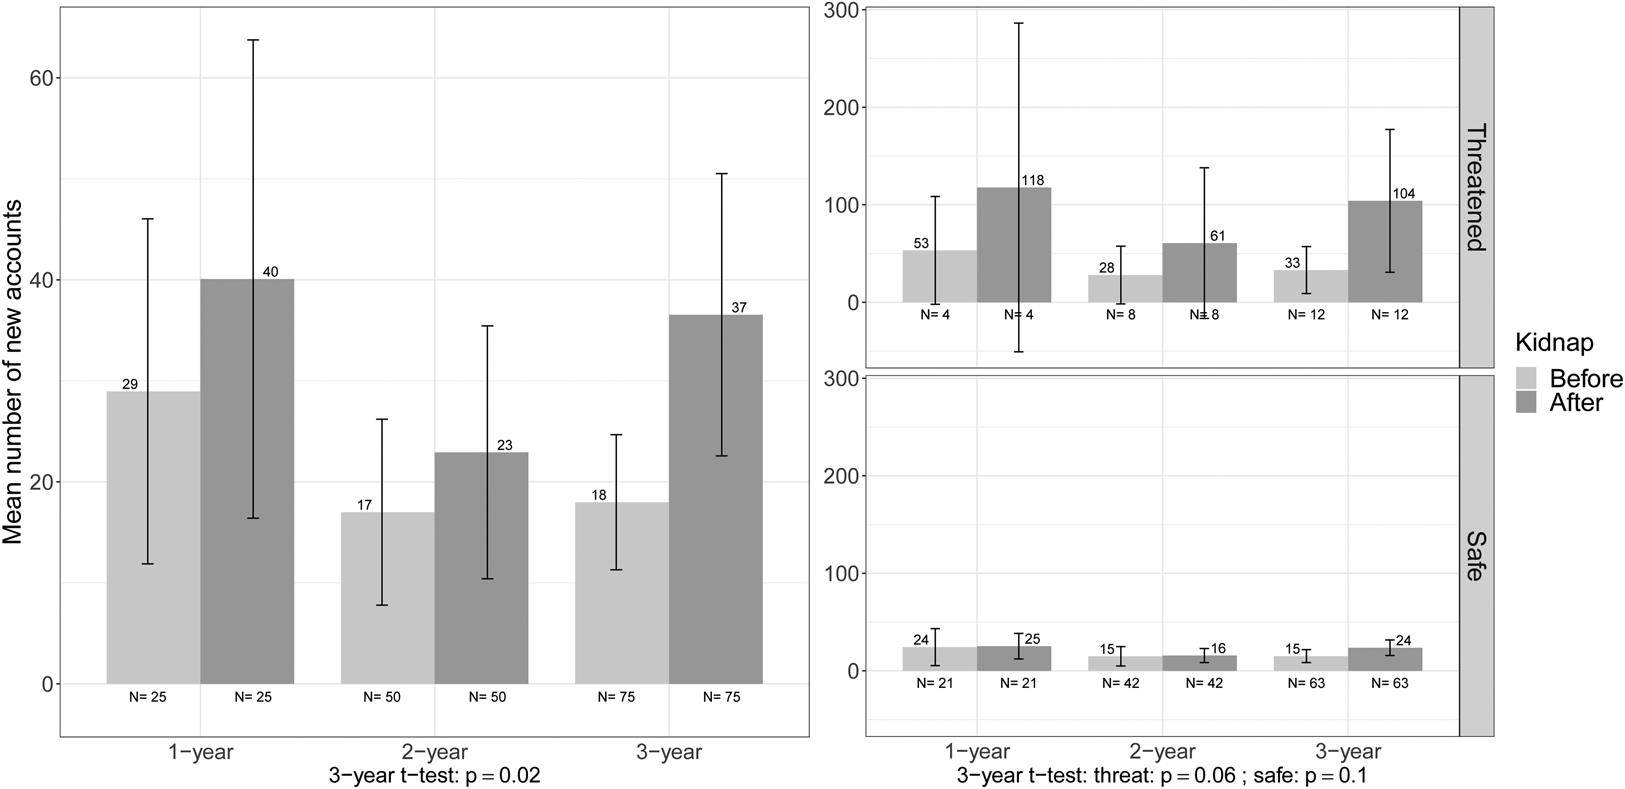
I find that in threatened counties, court activity increased substantially post-kidnap. Figure 5 shows the average number of new accounts opened before and after the kidnap for all counties (left panel) and for threatened and safe counties separately (right panel). As the right panel shows, both threatened and safe counties saw a statistically significant increase in court activity in the first three years post-kidnap, relative to the last three years pre-kidnap. However, in threatened counties the Court's caseload doubled or tripled across all time frames, while in safe counties, no change in activity is apparent until the three-year comparison.
Effect on Court activity in all, threatened, and safe counties. The left panel shows the average number of new court accounts opened, per county, in one, two, and three year intervals around the kidnap. The right panel disaggregates these results for threatened and safe counties. One-year comparisons use 1191. Numbers above graph bars show mean cases per year-threat combination, rounded to the nearest integer. Numbers below graph bars show number of observations used to calculate each mean. Error bars represent 95 percent confidence intervals, t-tests assume unequal variance.

These patterns in Court activity suggest that the Court prioritized threatened counties post-kidnap. While threatened counties saw more court cases in the pre-kidnap period as well, this disparity is likely due merely to differences in population. The three threatened geographic units—Yorkshire, Lincolnshire, and Leicestershire and Warwickshire—that drive the disparity contained one-fifth of the total population in the 25 units analyzed here.
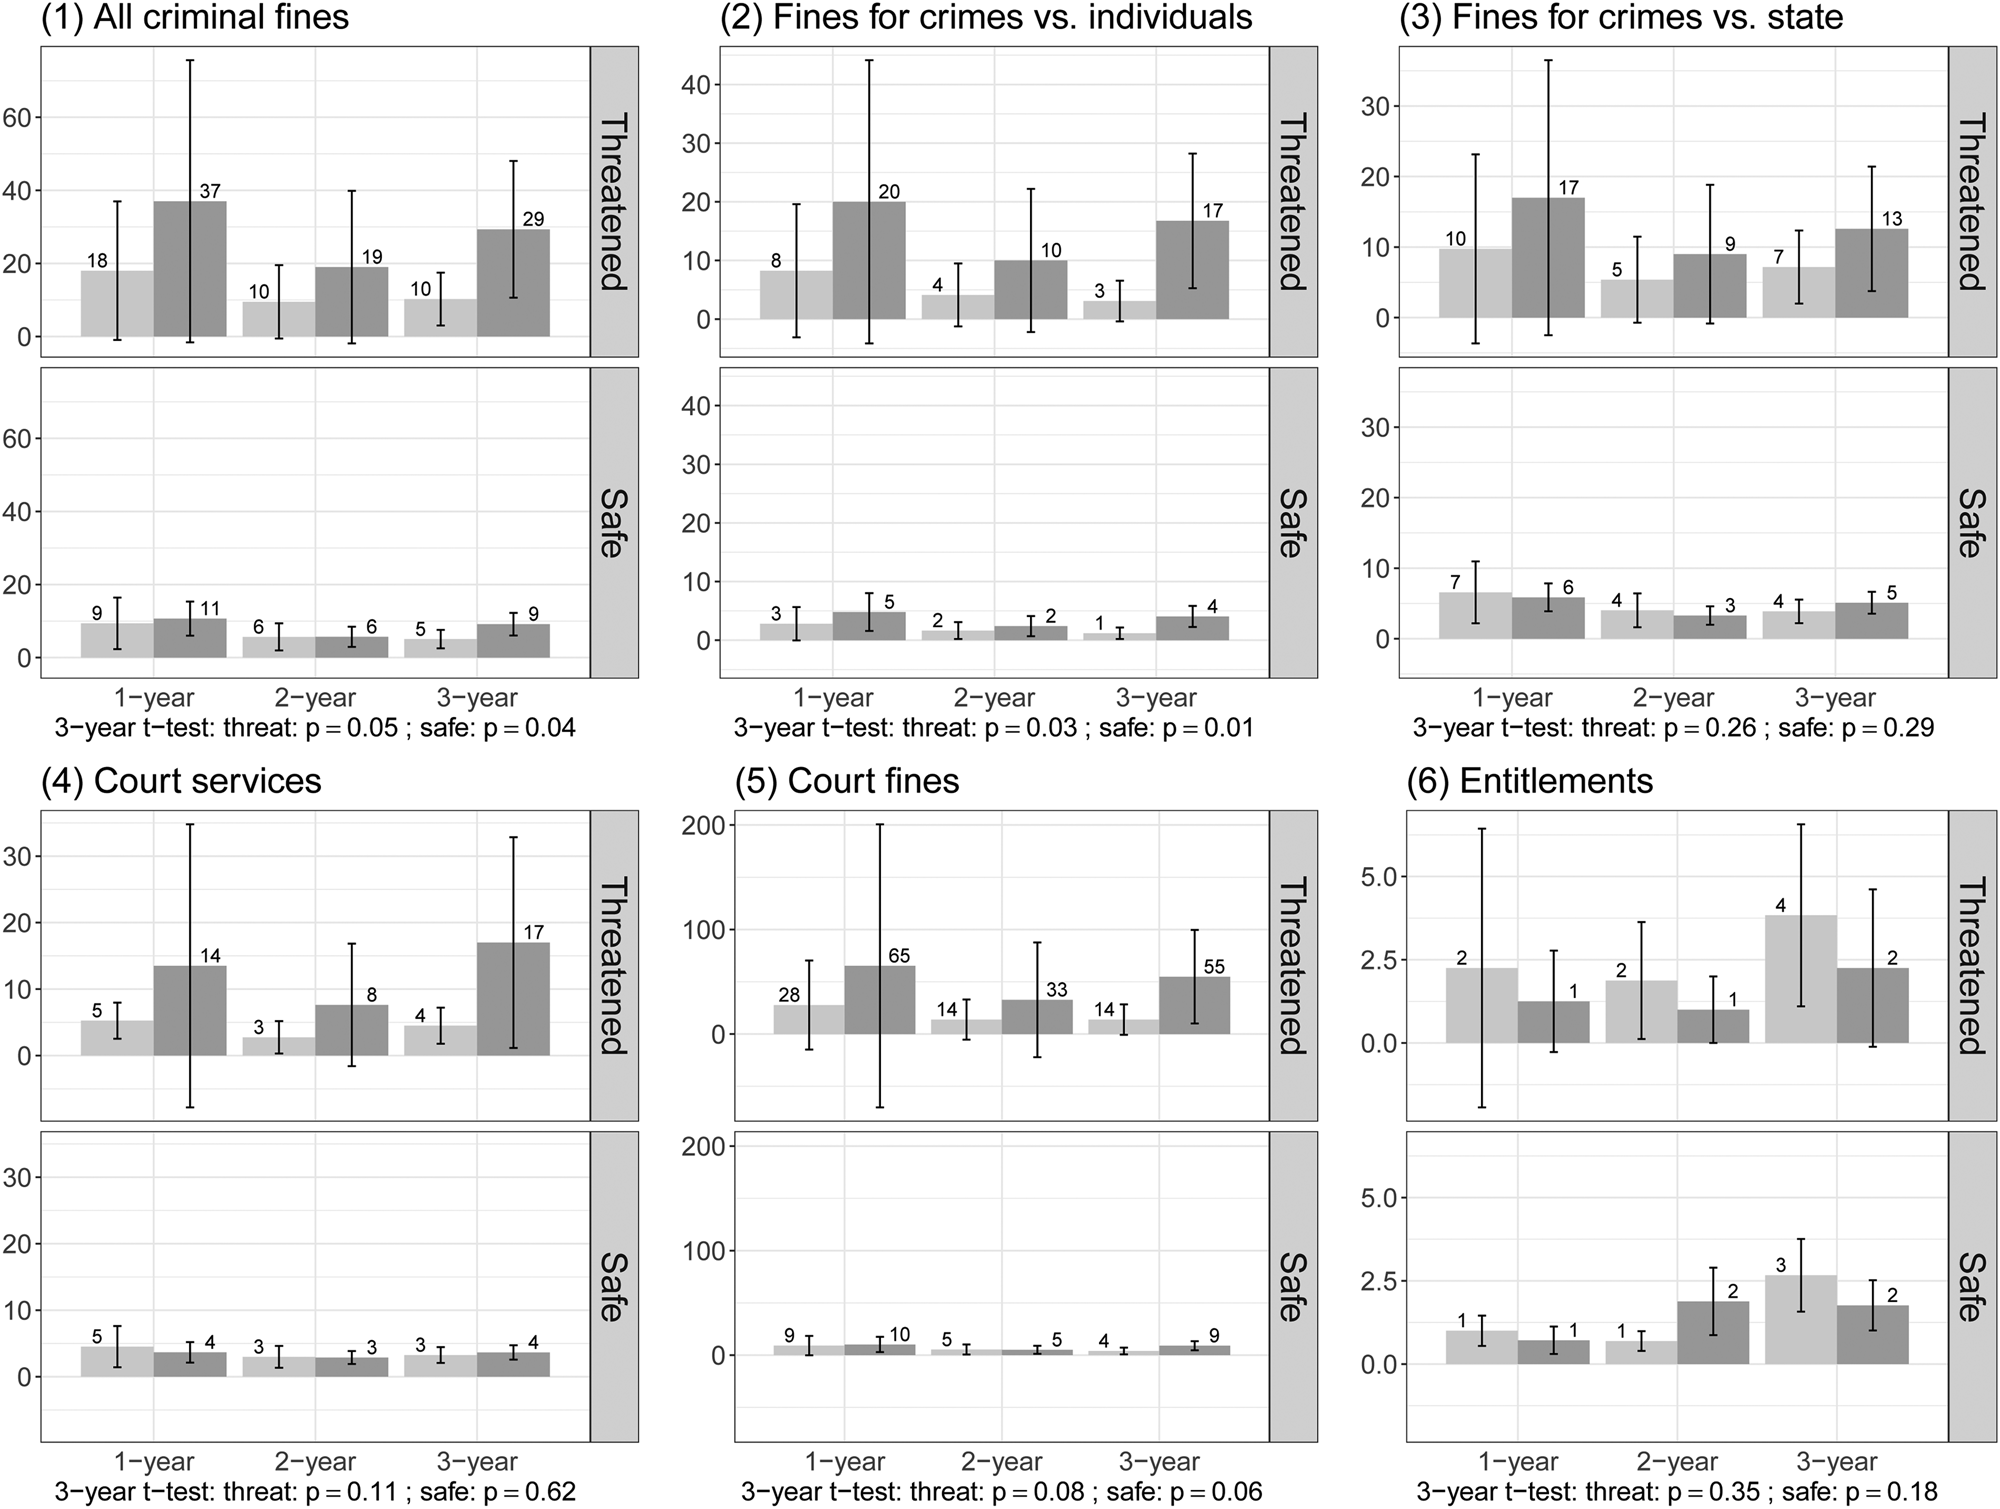
Disaggregation by category yields additional evidence of support-seeking in threatened counties, but very limited evidence of revenue-seeking in safe counties. The top row of Figure 6 shows the kidnap's overall effect on the average number of criminal fines imposed in threatened and safe counties (panel 1), then separates them into fines for violations of individual or state rights (panels 2 and 3). The bottom row shows the kidnap's effect on court services, court fines, and entitlements.
Effect on Court activity in threatened and safe counties, by case types. Panels show average numbers of new accounts opened for three time intervals around the kidnap, disaggregated by threat level and case type. N = 4 (1-year), 8 (2-year), 12 (3-year) in threatened counties; N = 21 (1-year), 42 (2-year), 63 (3-year) in safe counties. Numbers above graph bars show means, rounded to the nearest integer, error bars represent 95 percent confidence intervals, and t-tests assume unequal variance.

In threatened counties, there are consistent, large increases, across all time windows, in fines for individual rights violations, and much smaller (and statistically insignificant) increases in fines for state rights violations. There is also a consistent, large post-kidnap increase in the average number of court services provided. This is largely, though not entirely, in line with Table 1's predictions: post-kidnap, the court appears to have substantially increased its protection of individual property rights and its provision of services. There is also a consistently large increase in court fines, although I make no predictions about this category.
The figure shows little evidence consistent with my conjectures regarding safe counties: there were no increases in the fines imposed for crimes against the state, and until the three-year time windows, negligible increases in court fines and fines for crimes against individuals. The kidnap also appears to have had no effect on the number of court services and entitlements provided in safe counties, although it is not clear what revenue-seeking would have entailed for these categories.
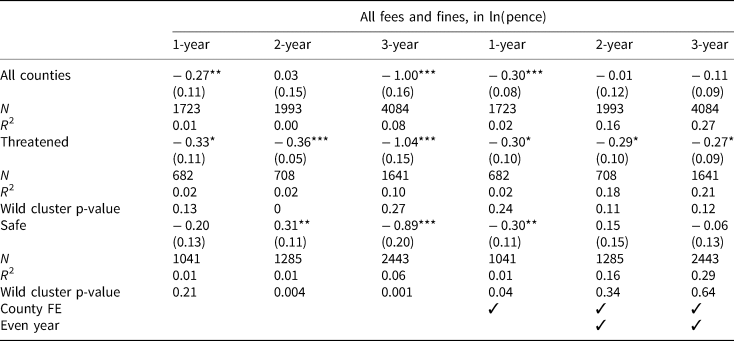
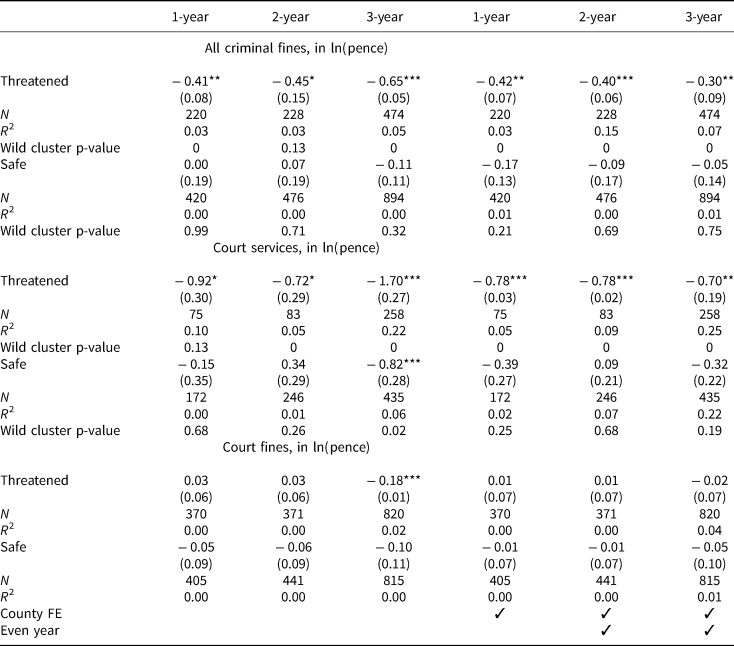
Table 2 presents the effect of the kidnap on the average amounts charged for court fees and fines overall, then in threatened and safe counties separately. In safe counties there is no consistent effect. In threatened counties, however, the kidnap's effect on charges is negative and significant throughout. Because the number of clusters is small, the bottom rows in this and the following tables show the robustness of consistently significant patterns of results to the wild bootstrap procedure discussed in Cameron et al. (Reference Cameron, Gelbach and Miller2008) and Esarey and Menger (Reference Esarey and Menger2018).
Kidnap's effect on fees and fines, overall and disaggregated by threat level

One-year comparisons compare 1191 to 1193. Cluster-robust standard errors in parentheses. There are four clusters in the high-threat analysis, and 19, 20, and 21 in the 1-, 2-, and 3-year safe analyses.
To better understand these effects, I disaggregated the data into the categories above and redid the analysis. Table 3 displays the kidnap's effect on average charges for (all) criminal fines, court services, and court fines. While safe counties saw no change, in threatened counties there were consistent, significant decreases in charges for both court services and criminal fines. Because the late 12th century featured moderate inflation (Barratt, Reference Barratt2001), in real terms this decrease was likely larger. This provides additional support for the theory that the Court sought to build support in threatened counties by increasing access to services while decreasing the financial burden of interaction with the Court. Interestingly, average charges for court fines did not change, suggesting that the large post-kidnap increase in the number of such fines may have been aimed at improving the fairness of court proceedings.
Kidnap effect on fines, disaggregated by threat level and type

Cluster-robust standard errors in parentheses. There are four clusters in the high-threat analysis and between 18 and 21 clusters in the safe analysis.
Table A4 in the Supplementary Appendix shows the kidnap's effect on fines for violations of individual rights, violations of state rights, and entitlements. In threatened counties, the kidnap did not affect the amounts charged for entitlements or individual rights violations. But as predicted, it consistently decreased average charges for violations of state rights. Since such violations were largely very minor crimes of poverty, such as gathering firewood or poaching on crown land, this result is consistent with a support-seeking Court reducing the burden on the peasant population. In safe counties, there was no post-kidnap change in charges for either type of criminal fines. Charges for entitlements generally decrease, but given the negligible change in the number of entitlements sold in safe counties, it is difficult to interpret this as a sign of revenue-generation. Supplementary Appendix Tables A5–A7 display the kidnap's largely null effects on the fraction of a debt that was paid immediately, suggesting that the relief provided to threatened counties was in the form of decreased charges, rather than a change in payment requirements.Footnote 7
These results are consistent with the Court's pursuit of support-building in threatened areas after the kidnap, although they provide very little evidence of revenue-seeking in safe counties. There are a number of possible explanations for the kidnap's limited effect in safe counties. First, perhaps, in spite of historians’ and contemporaries’ claims, the Court was not much used to extract revenue. This seems unlikely, however: as Figure 3 shows, over this general period large amounts of revenue were pulled in from fees and fines.Footnote 8 Second, perhaps threat heterogeneity, or some other confounder, masks an effect in safe counties. This possibility cannot be entirely rejected, but is somewhat ruled out in Supplementary Appendix Section B, where I show that both the kidnap's effect in threatened counties and the absence of an effect in safe counties are generally robust to the omission of the largest charges, the recategorization of safe counties as either “low-threat” or completely “safe,” and to a plausible addition to the threatened counties. Third, perhaps the Court simply did not have the capacity to pursue all its goals throughout the country—especially given the concurrent demands of defending against John—, and so it focused on the counties facing the greatest threat.
While it is difficult to assess the Court's precise capacity at the moment of the kidnap, in the next section, I provide some speculative evidence of the role of the kidnap in increasing Court capacity going forward. First, however, I rule out some alternative mechanisms that could plausibly have generated the results above, including a breakdown in law and order in threatened counties, refugee movement into those counties from John's strongholds, and pre-kidnap trends. I also discuss the possibility of unobserved confounding due to other events or features of threatened and safe counties. Finally, I evaluate the effect of the kidnap in the context of a wider time interval, and the extent to which the Royal Court's differential treatment of threatened and safe counties persisted after the immediate threat produced by the kidnap had subsided.
5.1 Alternative mechanisms and confounders
Could the kidnap have affected the Court's treatment of threatened counties through some other mechanism? For example, a widespread post-kidnap breakdown in law and order, or mass migration from John's lands, might simply have required a greater Court presence in threatened areas. While it is difficult to rule out all possible alternative mechanisms, there is little evidence for these particular theories. There is no historical documentation of widespread unrest in threatened counties, and the Court's behavior was inconsistent with an attempt to restore order. Such an attempt would have involved vastly increasing the number and severity of punishments imposed for crimes against the state, leaving little time for service provision. But instead, punishments for these crimes diminished, there was no great change in their number, and service provision significantly increased. Similarly, there is no historical evidence of a mass migration, and medieval England's rigid, land-based social structure would have rendered one difficult. Because John's territories were omitted from crown records while he held them, the data cannot speak to this question directly; however, there is no Pipe Roll evidence of post-kidnap migration from threatened into safe counties.
Could pre-existing trends in Court behavior merely have given the appearance of a kidnap effect? Pre-kidnap changes in court practice can be ruled out: none occurred between 1190 and 1192 (Gillingham, Reference Gillingham1999). Richard's departure in 1190 may have increased political instability pre-kidnap, but this would suggest that I have underestimated the effect of domestic threat on Court behavior. Moreover, the results in Tables 2, 3, and A4, are generally robust to the inclusion of a year trend (Table A19). To check for changes in court behavior that may have begun with Richard's coronation, I replicate all main results above, coding years from 1190 onward as treated. The results, in Supplementary Appendix Section D.2, suggest that Richard's takeover caused, if anything, a decrease in Court activity and service provision in threatened counties, and an overall increase in the amounts it charged.
While pre-treatment trends do not seem to have driven my results, the somewhat disparate effects of Richard's succession on threatened and safe counties does raise the possibility that these regions differed on some other dimension that motivated the Court's differential treatment of them post-kidnap. Although I cannot rule out this possibility, I suggest one such dimension that would not invalidate the support-seeking theory: as a group, the threatened counties had a history of political oppression. Almost all of Yorkshire, and swathes of other threatened areas, were ravaged by William the Conqueror in 1070 in retribution for a rebellion. The loss of life was so huge that some historians have called it an act of genocide (e.g., Kapelle, Reference Kapelle1980). Although the region had probably recovered economically by Richard's time (Broadberry et al., Reference Broadberry, Campbell, Klein, Overton and van Leeuwen2015), it is possible that these areas were treated from 1070 onward as conquered territories from which to extract resources. Under this interpretation, the kidnap suddenly made the support of these regions relevant, motivating a switch to support-seeking behavior.
This possibility raises broader questions about the persistence of the kidnap's effect on Court behavior in threatened and safe counties, and whether the kidnap had any other long-term effects on the Court. I therefore replicate the main analysis above, first for Richard's entire reign, and then for the entire period 1184–1203. The results are shown in Supplementary Appendix Section C. While these longer time windows increase the risk of confounding, I find that most effects in threatened counties continued throughout Richard's reign, and higher levels of service provision and property protection persisted into John's. Interestingly, over these longer intervals, similar patterns emerged in safe counties, suggesting a gradual post-kidnap expansion of Court service provision into safe areas. In the next section, I produce suggestive evidence that this expansion signified a sustained increase in Royal Court capacity and accessibility between 1193 and 1203.
6 The kidnap's long-term consequences
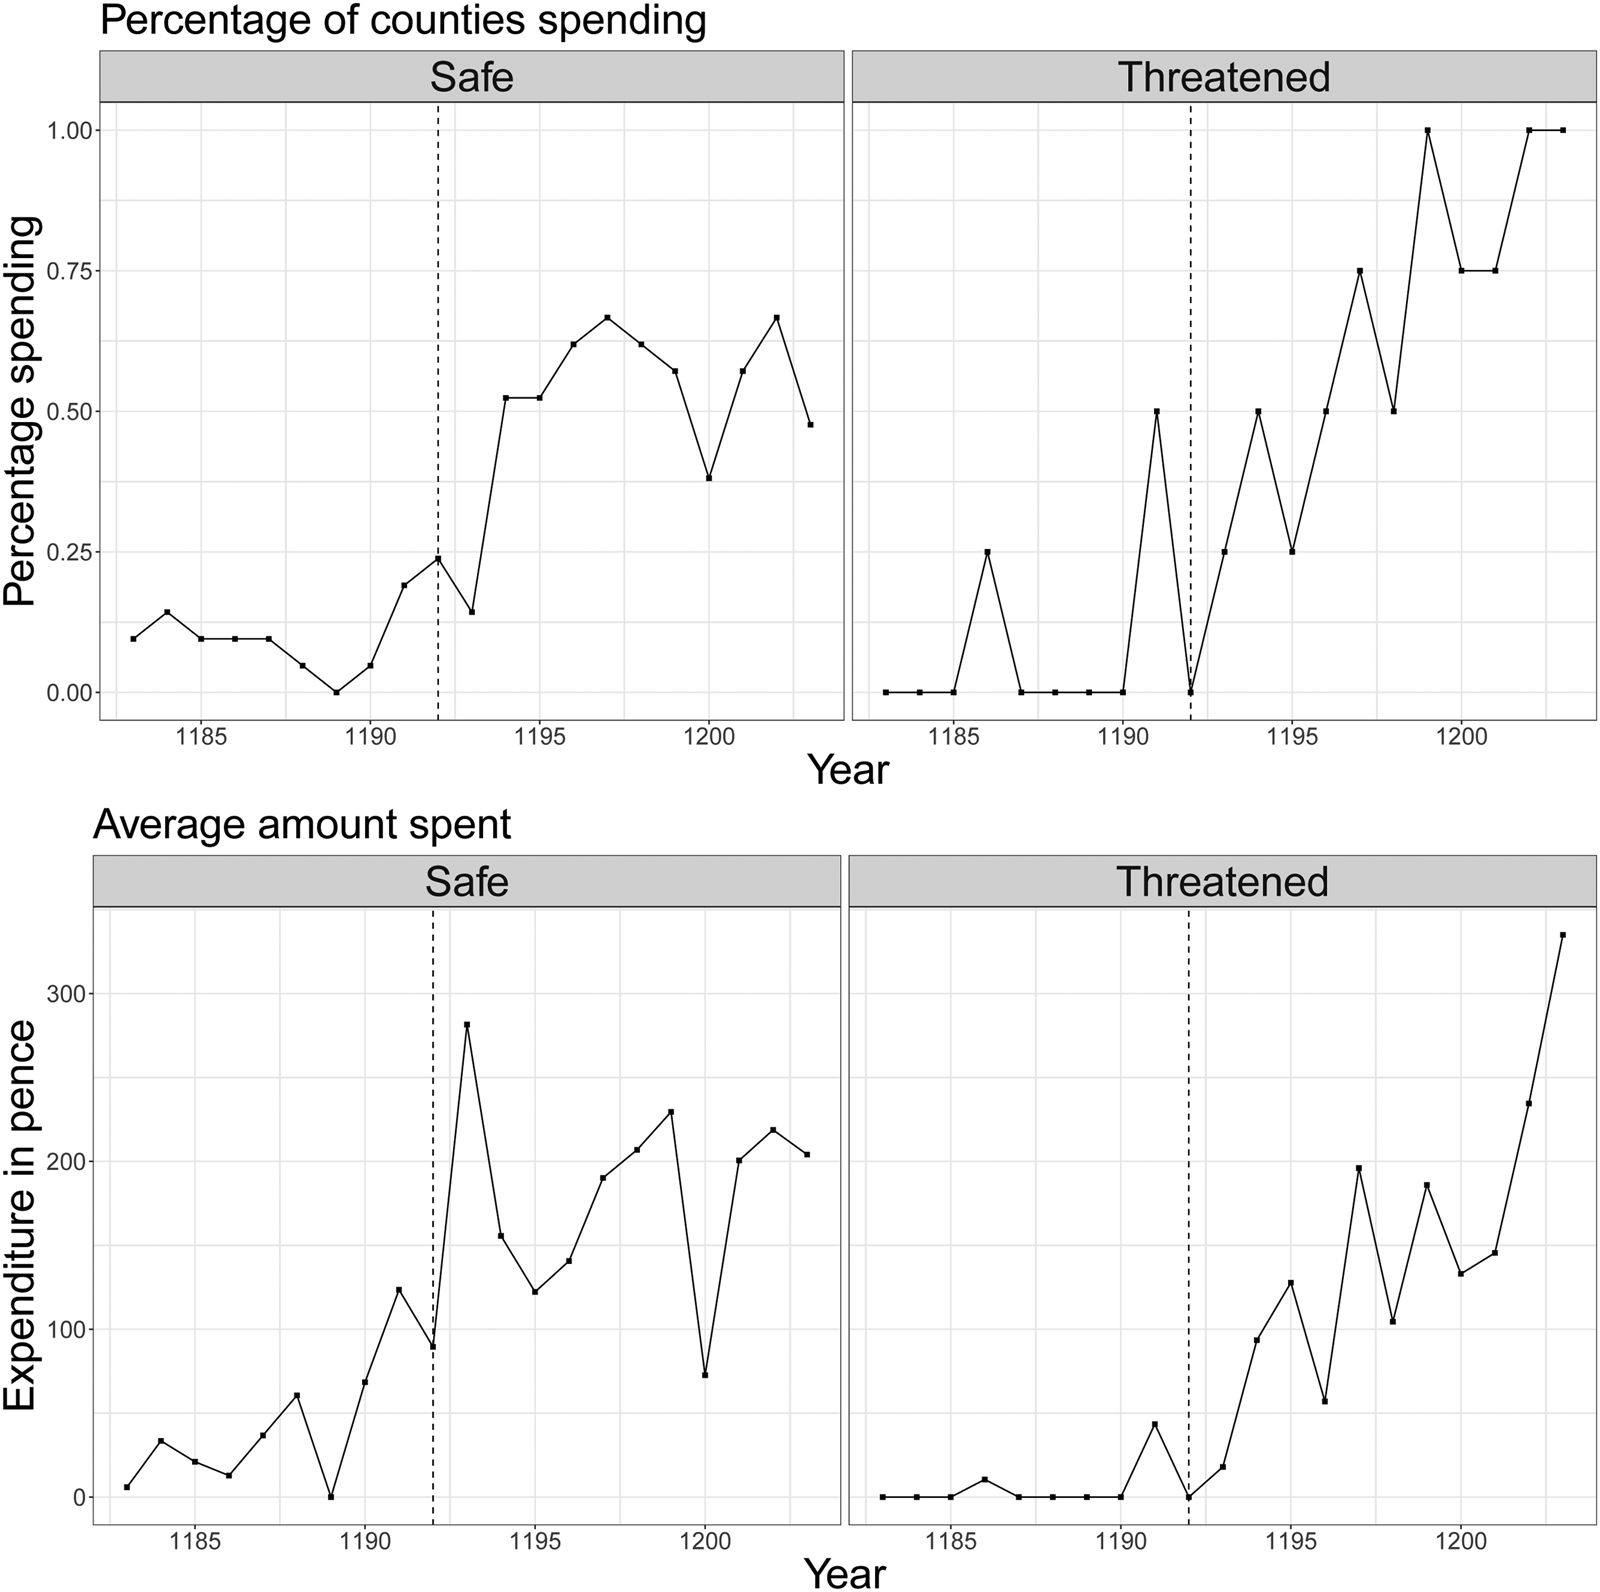
There is some evidence of a general expansion of Royal Court capacity during the ten years following the kidnap. First, between 1183 and 1192, an average of two counties per year reported spending an average of 37 pence on justice provision; between 1193 and 1203, those numbers increased to an average of fourteen counties reporting average expenditures of 177 pence. The top panel of Figure 7 displays the yearly percentage of threatened and safe counties spending a positive amount of crown revenue on justice provision before and after the kidnap; the bottom shows the average amount of such revenue spent across all counties in each category over the same period. While growth is especially striking in threatened counties, safe counties also experienced significant post-kidnap expansion.
Average amounts spent on justice; proportion of counties spending. From 1183 to 1203, top panel shows percentage of threatened and safe counties spending crown money on justice provision, bottom panel shows average amount spent. The vertical line indicates 1192. The spike in the amount spent in safe counties in 1193 is due to a large sum spent in London and Middlesex (the seat of the Royal Court).

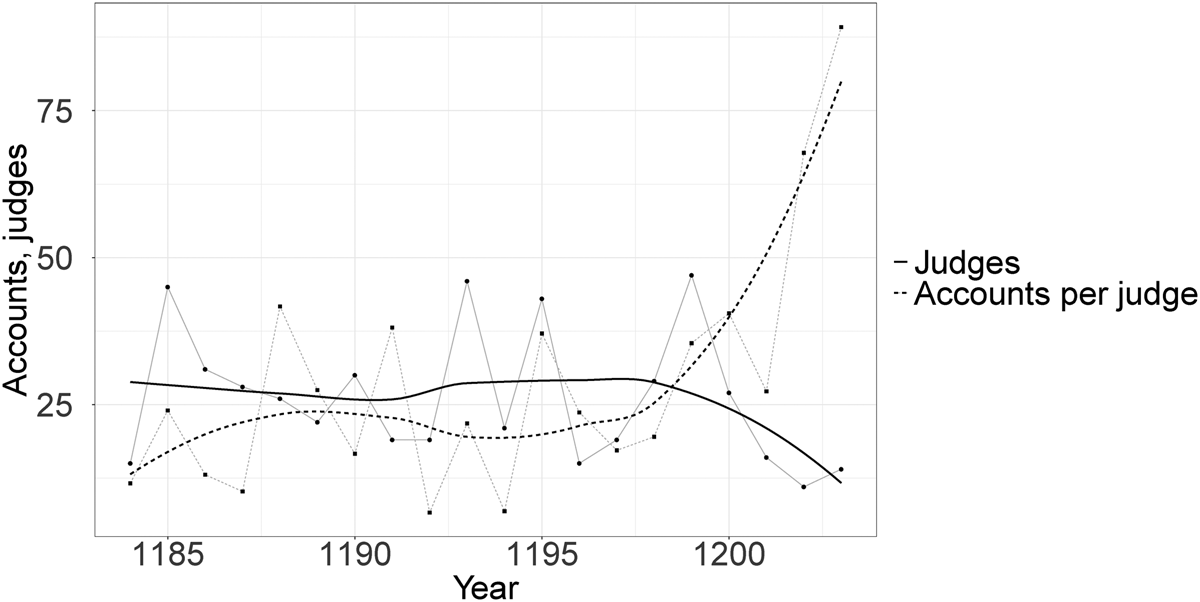
Figure 8 displays additional evidence of a sustained increase in Court capacity after the kidnap. The dashed gray and black lines show the average yearly judicial caseload; the solid lines show the yearly number of justices working. As the total amount of Court business increased in the last ten years of the data, the number of judges handling it first increased slightly, and then sharply decreased, resulting in an approximate doubling of judicial caseloads relative to pre-kidnap levels. This suggests substantial efficiency gains, consistent with other historical accounts: Pollock and Maitland (Reference Pollock and Maitland1895, 183) believed that by the beginning of the 13th century the royal justices had specialized in law and “disengaged from [other] governmental business.” Heiser (Reference Heiser1990, 225) records a similar caseload increase in the 1190s among royal justices handling property settlements, and also attributes it to specialization and professionalization.
New pleas collected and total number of justices working, 1184–1203. Yearly counts fitted with loess curves to show trends. Dashed lines represent number of judges named in court records each year. Solid lines represent average yearly caseloads of these judges.

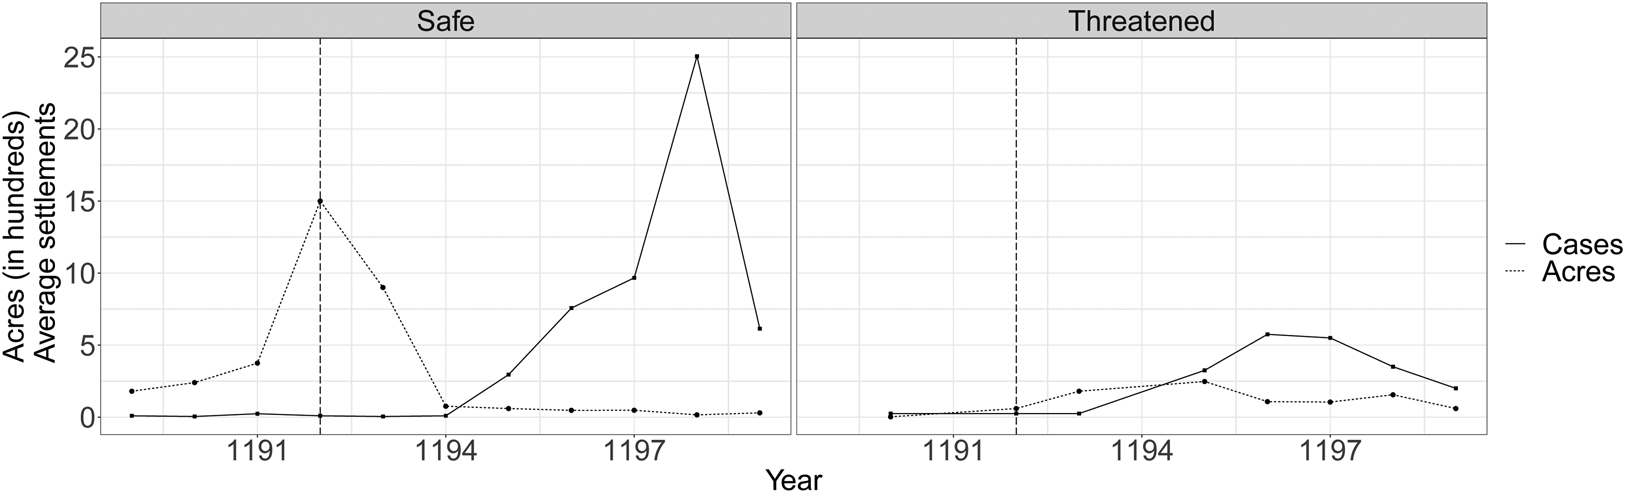
Finally, Figures 9 and 10 provide additional suggestive evidence that the Court sought to build support in threatened areas by expanding services and protections, and that this expansion eventually spread throughout England. Figure 9 demonstrates that from the mid-1190s onward, in both threatened and safe counties, the average per-county number of litigation settlements concluded before the Court rose sharply, while the median amount of land at issue fell significantly. Historians have argued that this pattern indicated an increase in peasant access to the Court (Pollock and Maitland, Reference Pollock and Maitland1895, 138; Hudson, Reference Hudson2012). Interestingly, these changes are more pronounced in safe areas, suggesting either unobserved differences across counties, or later attempts at revenue generation.
Yearly settlement numbers and median acres at issue in settlements, disaggregated by threat level, 1189–April 6, 1199. Settlements normalized by number of threatened/safe counties. Acres measured in hundreds. Concords between 1182 and 1188 are excluded because they did not mention acreage.

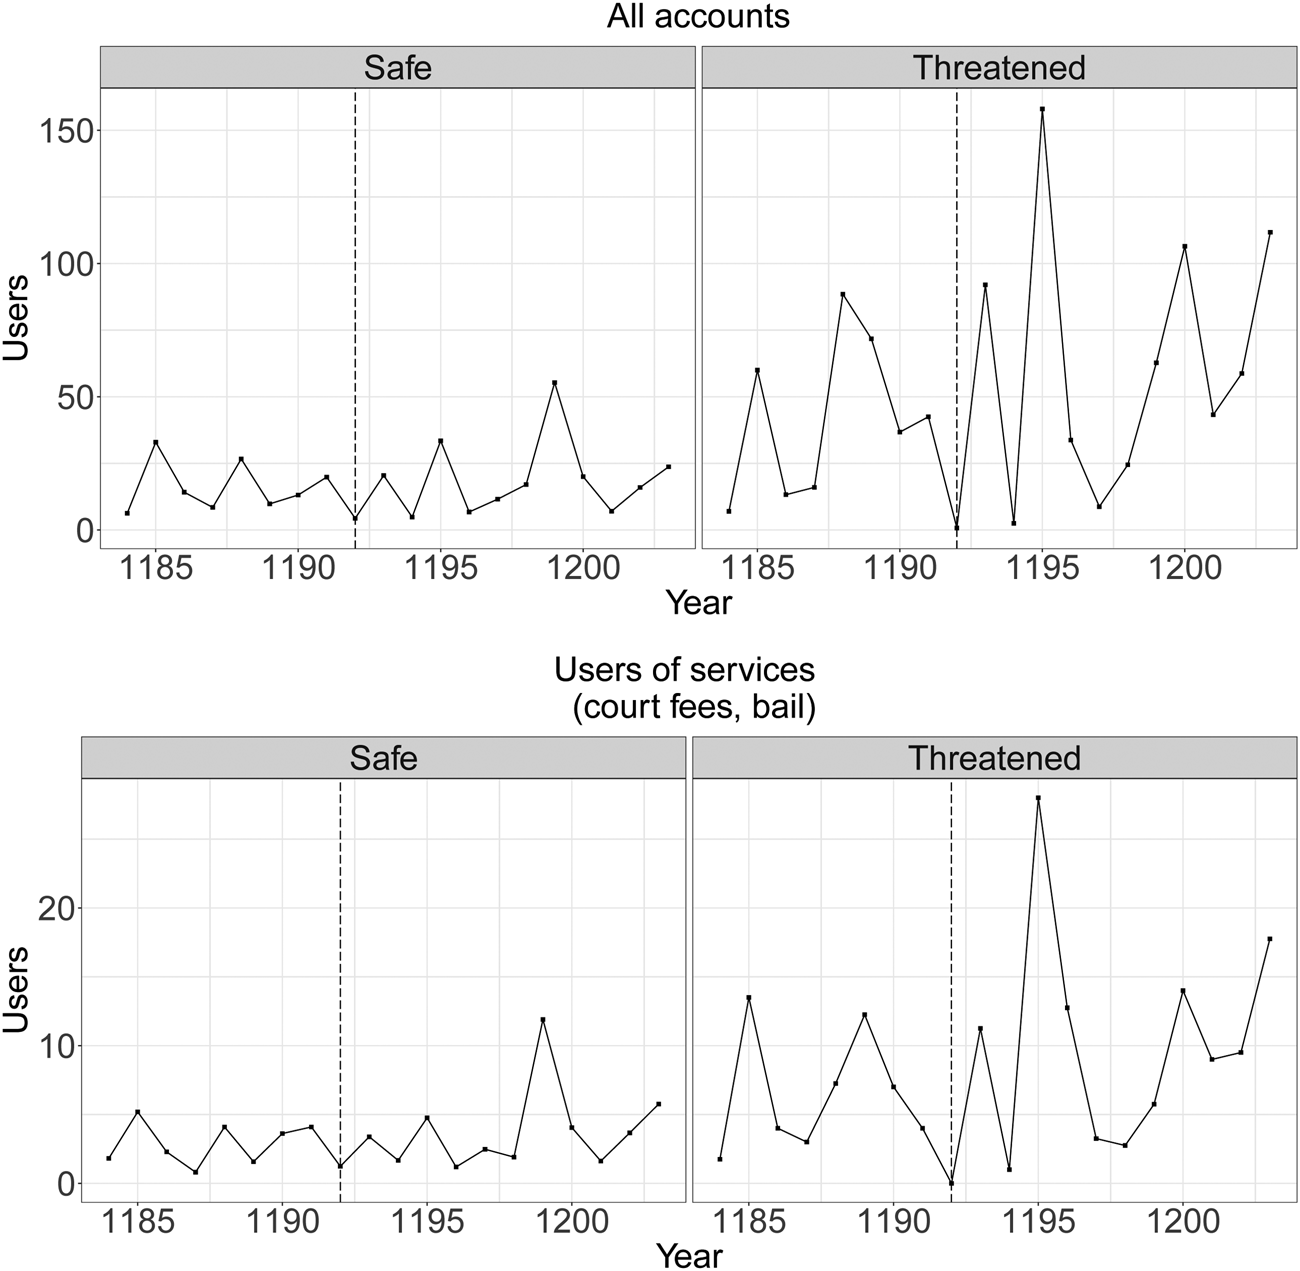
Average number of new account-holders per county, overall and for Royal Court services, disaggregated by threat level, 1184–1203. Top panel shows average number of individuals involved with the Royal Court per county, per year. Bottom panel shows average number of unique individuals per county, per year, who obtained a service from the Royal Court in that year. Vertical line denotes 1192.

Figure 10 displays the average per-county number of unique court users in threatened and safe counties between 1184 and 1203, for all court cases (top panel) and for services (bottom panel). Unique users were determined with a conservative matching approach: within each county-year, all near-identical names were treated as belonging to a single person. This likely substantially undercounts the true number of unique individuals, since many users are listed by “first name” plus “father's first name,” e.g., “John son of John.” Nevertheless, the figure shows large spikes in unique users in threatened counties in 1195, and a general post-kidnap upward trend in these counties between 1193 and 1203, providing additional evidence of a sustained increase in access to the court over the post-kidnap period.
7 Conclusion
This paper contributes to the vast literature on state capacity and institutional development by suggesting a new explanation for the emergence of property rights institutions in England, and new conditions under which such institutions might emerge elsewhere. However, given the antiquity of the period, the coarseness of the data, and the possibility of confounding, these conclusions remain speculative. Future work might leverage or expand these data to further pinpoint the drivers of the Royal Court's development over the medieval period, or look for modern examples of these mechanisms where the data are more complete, and the opportunities for causal identification are more plentiful.
Supplementary materials
To view supplementary material for this article, please visit https://doi.org/10.1017/psrm.2020.31