1. Introduction
A farmer's decision to participate in agricultural markets is one of the most important determinants of household welfare, and also of the level and type of crop diversity maintained on-farm (Lipper et al., Reference Lipper, Cavatassi, Winters and Smale2006; Smale, Reference Smale2006; Lipper et al., Reference Lipper, Anderson and Dalton2010). Generally, market participation is associated with higher levels of welfare (Barrett, Reference Barrett2008; World Bank, 2008; Asfaw et al., Reference Asfaw, Amare, Lipper and Davis2011) and frequently with lower levels of on-farm diversity (Smale, Reference Smale2006; Lipper et al., Reference Lipper, Anderson and Dalton2010). There are two main arguments for why market participation of farm households is so important to improving household welfare in rural areas (Barrett, Reference Barrett2008); on the one hand, it allows farmers to focus on producing the goods at which they are skilled (i.e., have a comparative advantage) and to trade their surplus for other goods and services they desire but for which they do not have a comparative advantage in producing. On the other hand, it allows for capturing greater economies of scale and use of technologies which, together, leads to a more rapid total factor productivity growth (Barrett, Reference Barrett2008). However, the literature on market participation and welfare generally does not distinguish between the input and output market, which could make a major difference in the effects on farm household welfare and crop diversity.
In areas vulnerable to weather-related or other production shocks, and where the incidence of poverty is high, the seed stock that households maintain for planting can often be lost (Sperling and Maguire, Reference Sperling and Maguire2010). One of the most important options for sourcing seeds to replace this lost stock is local agricultural markets, where the seeds and grain (or product) of crops are often interchangeable (Lipper et al., Reference Lipper, Anderson and Dalton2010). Local markets are thus an important part of the informal seed sector. Three key attributes of seed sales in local markets can be expected to affect the efficiency of this outlet for seeds: (i) the availability of a range of adapted resources; (ii) the information that is available about them; and (iii) the cost of obtaining them (Lipper et al., Reference Lipper, Anderson and Dalton2010). Previous research in Kenya on pigeonpea seed exchanges in local markets indicated that there was considerable variation in all three of these attributes: some markets had significantly higher levels of pigeonpea diversity and information in seed exchanges than others, and average prices varied significantly (Audi et al., Reference Audi, Jones, Nagarajan, Lipper, Leigh and Dalton2010). This variation can be expected to have differential impacts on a household's decision to participate in a market – either for seeds as inputs or for selling product. It can also be expected to affect household welfare and the diversity of pigeonpea varieties maintained on-farm.
More efficient markets with higher rates of diversity and information provide households with a greater potential to try new cultivars, affecting productivity and returns. On-farm diversity would also be affected; if added to an existing portfolio of varieties it would expand, whereas diversity could decrease if the purchased seed varieties replace existing traditional ones.
The relationship between market participation, and household welfare and on-farm crop diversity, is also affected by local seed system interventions such as producer-marketing groups (PMGs) and community-based seed production programs (CBSPs). Such interventions, especially in drier areas and after severe drought, help improve the efficiency of local markets, sustain pigeonpea diversity in local seed markets and, consequently, maintain on-farm diversity (Audi et al., Reference Audi, Jones, Nagarajan, Lipper, Leigh and Dalton2010). The aim of this paper is to explore the relationship between input and output market participation for the case of pigeonpea in Eastern Kenya, and then to determine whether this interaction significantly affects agricultural biodiversity and household welfare. Output market participants are classified as farmers who sold harvested pigeonpea crop, irrespective of the quantity sold, and non-participants are those who did not sell any harvested pigeonpea crop. Input market participants are classified as farmers who purchased pigeonpea seed from the local market, irrespective of the quantity purchased, and non-participants are those who did not purchase pigeonpea seeds.
Pigeonpea (Cajanus cajan) is an important grain legume widely grown and adapted to the semi-arid regions of South Asia and eastern and southern Africa. The largely drought-tolerant crop allows poor families to protect their livelihoods and meet their food and cash income needs when most other crops fail in areas with erratic rainfall. Farmers in land-scarce areas can intensify land use and harvest two crops through intercropping with cereals (like maize and sorghum), allowing farmers to diversify risks and maximize their incomes. Smallholder farmers market a substantial portion of their annual produce to meet their cash requirements. Kenya is one of the major growers and exporters of the crop in the region and there is an expanding processing and value-adding industry that would allow the country to export de-hulled split pea (dhal) to the Far East, Europe and America (Audi et al., Reference Audi, Jones, Nagarajan, Lipper, Leigh and Dalton2010).
Using farm-level data collected from a random cross-section of 333 small-scale producers in Eastern Kenya, this study attempts specifically to respond to three main research questions. First, what are the determinants of input and output market participation? Second, what is the impact of household participation in the local input (seed) market and the output market on pigeonpea diversity and household welfare? And third, what are the suitable policy prescriptions to enhance pigeonpea diversity and improve household productivity and/or welfare?
From an econometric standpoint, analyzing the welfare and pigeonpea diversity implications of market participation may be affected by selection biases. This paper acknowledges that the differences in welfare and diversity outcome variables between those farm households that did and did not participate in the market could be due to selection bias. Failure to distinguish between the causal effect of market participation and the effect of other factors could lead to biased estimates and misleading policy implications. We employ propensity score matching (PSM) methods to account for the endogeneity of the participation decision due to observed characteristics of farmers and their farms.
This paper proceeds by providing a description of market participation, on-farm crop diversity and household welfare. Section 3 presents estimation techniques whereas section 4 gives a description of the data and a descriptive summary of variables used in the analysis. Results are presented and discussed in section 5. The last section presents both concluding remarks and policy implications.
2. Market participation, on-farm crop diversity and household welfare
There is a significant stock of literature on the factors that drive market participation for smallholder agricultural producers in developing countries (Alene et al., Reference Alene, Manyong, Omanya, Mignouna, Bokanga and Odhiambo2008; Barrett, Reference Barrett2008; Asfaw et al., Reference Asfaw, Amare, Lipper and Davis2011). Results indicate that key determinants of market participation are factors that drive the likelihood of a household producing a marketable surplus (e.g., land and labor assets, land quality, technology choices) as well as transactions costs in accessing markets (distances, road quality, population density and overall level of commercialization) (Benfica, Reference Benfica2006; Alene et al., Reference Alene, Manyong, Omanya, Mignouna, Bokanga and Odhiambo2008; Barrett, Reference Barrett2008). Alene et al. (Reference Alene, Manyong, Omanya, Mignouna, Bokanga and Odhiambo2008) argue that transaction costs significantly hinder market participation whereas better market information stimulates it. Benfica (Reference Benfica2006) found that participation in tobacco schemes is driven by factor endowments, asset ownership and alternative income opportunities, and returns to education. Key et al. (Reference Key, Sadoulet and de Janvry2000) found that crop supply and welfare response to exogenous market-price changes are heavily affected by transaction costs which create important discontinuities in supply response and non-convexities commonly associated with poverty traps. Frequently, findings indicate that higher levels of education and social capital are also key determinants of market participation (Benfica, Reference Benfica2006). In the absence of institutions that help coordinate marketing functions or link producers to markets, the associated high transportation costs and transaction costs undermine the processes of exchange and result in limited or localized markets with few rural–urban linkages (Alene et al., Reference Alene, Manyong, Omanya, Mignouna, Bokanga and Odhiambo2008). Gender and age of household heads can also be important, with women and older-headed households generally having lower levels of participation (Key et al., Reference Key, Sadoulet and de Janvry2000; Benfica, Reference Benfica2006). This stock of literature suggests that transaction costs, limited access to productive assets and lack of improved technology are the main factors influencing market participation and amount supplied to the market (Key et al., Reference Key, Sadoulet and de Janvry2000; Benfica, Reference Benfica2006; Alene et al., Reference Alene, Manyong, Omanya, Mignouna, Bokanga and Odhiambo2008). However, most literature – with the exception of Alene et al. (Reference Alene, Manyong, Omanya, Mignouna, Bokanga and Odhiambo2008) – generally emphasizes output market participation. There is also considerable interest in gaining a better understanding of drivers of input market participation.
Transactions for informal sector seeds in local markets often involve high transaction costs because seeds are not ‘transparent’, making the consumption (e.g., taste) and production attributes (e.g., early maturity) of seed that farmers value, its quality and genetic content, difficult to measure (Morris et al., Reference Morris, Rusike, Smale and Morris1998). This results in an increase in the search costs incurred by those accessing local seed markets. The degree to which any of these features are observable to farmers varies by crop and variety, but lack of transparency is a problem that results in information asymmetries between the consumer (farmer) and seed supplier (Morris et al., Reference Morris, Rusike, Smale and Morris1998). Traditionally, informal seed sector exchanges occur in a given locality and involve social networks, providing a mechanism for overcoming information constraints (e.g., farmers could observe the crops obtained from seeds) as well as quality assurance (e.g., through social norms and reputation) (Badstue et al., Reference Badstue, Bellon, Berthaud, Juárez, Rosas, Solano and Ramírez2006). Expansion of informal seed sector exchanges to local markets can be expected to reduce the effectiveness of these mechanisms, although there are still examples of their existence even in this setting (Audi et al., Reference Audi, Jones, Nagarajan, Lipper, Leigh and Dalton2010).
Policies that increase information and reduce some forms of transactions costs – such as seed variety release and certification – can increase exchange and gains from trade. However, seed certification per se can be a barrier to exchange, especially when seed laws require certification for all seed in the market, effectively outlawing the sale by farmers of landraces and local genotypes. Furthermore, labeling and certification may not be very effective if they are not perceived as reliable or credible. Therefore, reliable and credible information on seed (name or identity, origin, and production and market attributes) in informal or formal markets will enhance the transparent nature of seed and improve its accessibility (Audi et al., Reference Audi, Jones, Nagarajan, Lipper, Leigh and Dalton2010). Summarizing this review of the literature, we can identify two hypotheses for seed market participation: (1) farmers seeking to redress a loss of access to seeds from alternative informal seed sector sources; or (2) farmers seeking to improve their seed stocks by accessing new and/or better quality materials.
The next question we address is how seed market participation affects the maintenance relationship of on-farm crop diversity and household welfare. Here, as above, most of the literature focuses on output market participation and crop diversity. For example, Isakson (Reference Isakson2007) found that participation in markets by Guatemalan maize, legumes and squash farmers was not always detrimental to the maintenance of crop genetic resources, but that households with greater wealth and more hired farm hands were more likely to have lower crop diversity. In contrast, Van Dusen (Reference Van Dusen2000) found that market integration significantly reduces crop diversity and suggests that diversity studies should be done in the context of larger cropping systems and economic environments.
Trade theory predicts that integration into the market should correlate with a loss of diversity and better welfare as farmers specialize in particular crops and varieties where they enjoy a comparative advantage. However, empirical studies indicate that this relationship is not straightforward, and cases where market integration coincides with maintenance of crop diversity can be found (Brush et al., Reference Brush, Taylor and Bellon1992; Smale, Reference Smale2006). Vadez et al. (Reference Vadez, Reyes-García, Godoy, Apaza, Byron, Huanca, Leonard, Perez and Wilkie2004) show that households which are more integrated into the market intercropped more, used more varieties of manioc and put more crops in new fields than did autarkic households. While market participation may increase the pressure to standardize agricultural goods, this may be accompanied by pressures to satisfy the demands of niche producers and consumers. Hellin and Higman (Reference Hellin and Higman2005) propose managing crop diversity while ensuring that farmers benefit from market opportunities through conservation, whereby development practitioners identify market niches for local rather than ‘cosmopolitan’ varieties. Another possible explanation for the maintenance of crop diversity accompanying market integration relates to the role of genetic diversity in managing risk associated with crop failure. Because the market does not yet provide well-functioning forms of self-insurance (e.g., credit or crop insurance), people opt to maintain crop diversity to protect income and consumption (Cavatassi et al., Reference Cavatassi, Lipper and Narloch2010). Summarizing this review of the literature, it is difficult to hypothesize a priori the direction of the link between market participation and on-farm crop diversity. This study, however, tests the hypothesis that on-farm crop diversity depends on the level of market integration by smallholder farmers.
3. Econometric framework
The first objective of the analysis is to examine the factors affecting household participation in both the pigeonpea input (seed) market, and the output market. Foster and Rosenzweig (Reference Foster and Rosenzweig2010) and de Janvry et al. (Reference de Janvry, Dustan and Sadoulet2010) point out that output market participation and input use are the outcomes of optimizing by heterogeneous agents. Optimization takes place in the presence of budget constraints, lack of information, access to credit, and availability of both technology and other inputs. Thus, households are expected to maximize their utility function subject to these constraints. Viewing market participation through the lens of optimization by rational agents, households participate in a given market only if participation is actually a choice and, at the same time, participation is expected to be profitable or otherwise advantageous (de Janvry et al., Reference de Janvry, Dustan and Sadoulet2010). Following de Janvry et al. (Reference de Janvry, Dustan and Sadoulet2010), Ali and Abdulai (Reference Ali and Abdulai2010) and Asfaw et al. (Reference Asfaw, Kassie, Simtowe and Lipper2012a, Reference Asfaw, Shiferaw, Simtowe and Lipperb), the participation decision can be modeled in a random utility framework. The difference between the utility from market participation (U Pi) and non-participation (U Ni) of aggregate output/input may be denoted as G i*, such that a utility-maximizing farm household, i, will choose to participate in a given market if the utility gained from participating is greater than the utility of not participating (G i* = U Pi − U Ni > 0). Since these utilities are unobservable, they can be expressed as a function of observable elements in the following latent variable model:
 $$G_{i}^{\ast}=\beta M_{i}+u_{i}\hbox{ with } G_{i}=\left\{\matrix {1 \hfill & if \, G_{i}^{\ast} > 0 \cr 0 \hfill & otherwise} \right.$$
where G i is a binary indicator variable that equals 1 if a household participates in output/input market and zero otherwise; β is a vector of parameters to be estimated; M i is a vector of explanatory variables; and u i is the error term. The factors affecting the choice to participate or not can be estimated using the logit model.Footnote 1
The second hypothesis is that a household's choice to purchase seed from local seed markets and sell its produce to the output market influences its decision on the level of on-farm pigeonpea diversity managed by the household, and also affects its welfare. The equation to estimate the coefficient of these factors can be represented in a general regression equation:
 $$D_{i}=\beta X_{i}+\phi G_{i}+\mu_{i}$$
where the dependent variable D represents on-farm pigeonpea diversity and household welfare, X i is the vector of exogenous household, farm, market or institutional factors; μi the unobserved factors; and β and ϕ are the parameters to be estimated.
On-farm pigeonpea diversity is captured by the ShannonFootnote 2 pigeonpea diversity indices and number of pigeonpea varieties planted for individual households. Two welfare indices, namely the Household Food Insecurity Access Scale (HFIAS) and the Household Dietary Diversity Score (HDDS), were constructed to proxy the level of deprivation of each household relative to other households. A food insecurity access scale was constructed from survey scores using FAO's HFIAS, which captures the access dimension of food security in terms of quantity, quality and preference. There is a direct relationship between the index and level of food insecurity; i.e., the higher the index, the more food insecure the household. Secondly, a dietary diversity score was developed by adding the total number of dietary items consumed among different food groups during a one-week recall by vulnerable groups in the household. We define the various food groups as cereals, vitamin-A-rich vegetables and tubers, white tubers and roots, dark green leafy vegetables, other vegetables, vitamin-A-rich fruits, other fruits and alcoholic beverages (FAO, 2011). It is expected that food items within the same group have a tendency to provide similar nutrients.
The estimation of ϕ in equation (2) using the ordinary least square (OLS) procedure poses an estimation bias and inconsistency because it assumes that market participation is exogenously determined while it is potentially endogenous. The decision to participate or not is voluntary and may be based on individual self-selection. On-farm pigeonpea diversity, household welfare and participation may be jointly determined and this could be a source of endogeneity bias. For example, household welfare and on-farm pigeonpea diversity may both influence participation as well as be influenced by participation. We propose using PSM methods to address the above econometric challenges. A limitation of PSM is that unobservable variables which may affect both the outcome variables and the choice of market participation are not accounted for directly; it assumes selection is based on observable variables.Footnote 3
In contrast to the instrumental variable methods, matching models assume that conditioning on observable variables eliminates sample selection bias (Heckman and Navarro-Lozano, Reference Heckman and Navarro-Lozano2004). Let G(M) = Pr (G i = 1/M i) be the probability of participating in the input or output market, which will be estimated using the logit or probit model. PSM constructs a statistical comparison group by matching every individual observation of participants with an observation with similar characteristics from the group of non-participants. In essence, matching models create the conditions of an experiment in which participants and non-participants are randomly assigned, allowing for the identification of a causal link between the participation decision and outcome variables.
The validity of the PSM approach rests in part on four basic conditions: (i) conditional independence assumption (CIA) or unconfoundedness assumption, (ii) common support, (iii) the same data source is used for participants and non-participants, and (iv) participants and non-participants have access to the same markets (Heckman et al., Reference Heckman, Ichimura, Smith and Todd1998). CIA implies that potential outcomes are independent of treatment conditional on a set of observable control variables, M i;
 $$E\lpar D^1/M_i\comma \; G_i=1\rpar =E\lpar D^0/M_i\comma \; G_i=0\rpar$$
where D 1 and D 0 indicate the outcome variables for participants and non-participants, respectively. CIA indicates that conditional on control observable variables M i non-participants have the same mean outcomes as participants would have if they had not participated in the input/output market. In other words, selection is based solely on observable characteristics, and all variables which influence participation and potential outcomes simultaneously are observed by the researchers, which is clearly a strong assumption (Caliendo and Kopeinig, Reference Caliendo and Kopeinig2008).
The second main assumption of propensity models is the common support condition, which requires that the propensity score lie strictly between zero and one:
 $$0 < \hat{P} \lpar M_i\rpar < 1.$$
Equation (4) requires that the proportion of treated and untreated households must be greater than zero for every possible value of M i. The overlap condition ensures that treatment observations have comparison observations ‘nearby’ in the propensity score distribution (Rosenbaum and Rubin, Reference Rosenbaum and Rubin1983; Heckman et al., Reference Heckman, Ichimura, Smith and Todd1998). This implies that the effectiveness of PSM also depends on having a large and roughly equal number of participants and non-participants so that a substantial region of common support can be found. There are two common methods of determining the region of common support more precisely. The first one is based essentially on comparing the minima and maxima of the propensity score in both groups. The basic criterion of this approach is to delete all observations whose propensity score is smaller than the minimum and larger than the maximum in the opposite group (Caliendo and Kopeinig, Reference Caliendo and Kopeinig2008). The second method of overcoming this problem is based on estimating the density distribution in both groups and using a trimming procedure to determine the common support region (Smith and Todd, Reference Smith and Todd2005). If equations (3) and (4) are valid, then PSM provides a plausible method for estimating unbiased estimates of average treatment effect on the treated (ATT).
The seminal explanation of the PSM method is provided by Rosenbaum and Rubin (Reference Rosenbaum and Rubin1983), and its strengths and weaknesses are elaborated, for example, by Heckman et al. (Reference Heckman, Ichimura, Smith and Todd1998), Dehejia and Wahba (Reference Dehejia and Wahba2002), Smith and Todd (Reference Smith and Todd2005) and Caliendo and Kopeinig (Reference Caliendo and Kopeinig2008). Several matching methods have been developed to match participants with non-participants of similar propensity scores. These include Nearest Neighbor Matching (NNM), Stratification and Interval Matching (SIM), Caliper and Radius Matching (CRM) and Kernel Matching (KM) among others. Asymptotically, all matching methods should yield the same results. However, in practice, there are trade-offs in terms of bias and efficiency with each method (Caliendo and Kopeinig, Reference Caliendo and Kopeinig2008). The basic approach is to numerically search for ‘neighbors’ of non-participants that have a propensity score that is very close to the propensity score of the participants.
Given that the analysis does not condition on all covariates, but on the propensity score, there is a need to check if the matching procedure is able to balance the distribution of the relevant variables in the control and treatment groups. The basic idea is to compare the situation before and after matching and then check if there are any remaining differences after conditioning on the propensity score (Caliendo and Kopeinig, Reference Caliendo and Kopeinig2008). The balancing test is normally required after matching to ascertain whether the differences in the covariates of the two groups in the matched sample have been eliminated, in which case the matched comparison group can be considered a plausible counterfactual. Although several versions of balancing tests exist in the literature, the most widely used is the mean absolute standardized bias (MASB) between participants and non-participants suggested by Rosenbaum and Rubin (Reference Rosenbaum and Rubin1983). Additionally, Sianesi (Reference Sianesi2004) proposed a comparison of the pseudo-R 2 and p-values of the likelihood ratio test of the joint insignificance of all the regressors obtained from the logit analysis before and after matching the samples. After matching, there should be no systematic differences in the distribution of covariates between the two groups. As a result, the pseudo-R 2 should be lower and the joint significance of covariates should be rejected (or the p-values of the likelihood ratio should be insignificant).
Despite the fact that PSM tries to compare the difference between the outcome variables of participants and non-participants with similar inherent characteristics, it cannot correct unobservable bias because PSM only controls for observed variables (to the extent that they are perfectly measured). Thus, it is important to test the sensitivity of results with respect to hidden bias, using the Rosenbaum (Reference Rosenbaum2002) bounds test. This test suggests how strongly an unmeasured variable must influence the selection process in order to undermine implications of matching analysis.
4. Data and descriptive analysis
The Makueni District in Eastern Kenya was selected for the survey because of its importance as a center of pigeonpea diversity in Kenya and for its semi-arid climate which predisposes it to frequent droughts. These droughts affect the availability of farmers’ seed and often force households to participate in the local market for purchase of pigeonpea seed. The Makueni District includes the prominent hill masses of Mbooni and Kilungu which are cooler and receive rain for about 2–3 weeks before it starts raining in lower-altitude areas, and continue to get rain for another 2–3 weeks after the end of the rainy season in the lower altitude zones. As pigeonpea is cultivated in both lower and higher altitude areas, these pockets of ‘wetter lands’ feed the pigeonpea seed market in the drier lands of the Makueni District, especially after drought. This is a natural market interaction.
Two key seed-intervention strategies were implemented during the last decade in the Makueni district. Between 1998 and 2004, Winrock sponsored and implemented CBSP programs, and in 2002 the International Crops Research Institute for Semi-Arid Tropics (ICRISAT) began implementing PMGs which multiply and sell improved cultivars of pigeonpea obtained from ICRISAT research facilities (Audi et al., Reference Audi, Nagarajan and Jones2008). Both were implemented to improve the access and availability of quality seeds to vulnerable as well as smallholder farmers, during normal and disaster periods. Each intervention had its own strengths and weaknesses in terms of access, availability and program sustainability.
Therefore, site selection was purposive to represent these seed-intervention strategies in the two major climactic zones in the Makueni District. The presence of these interventions provides a basis for sampling for variation in market characteristics as they can be expected to have affected access to pigeonpea seeds in local markets. Six local markets were frequented by farmers from the household survey sites: (i) Kathonzweni market in the Thavu sub-location, (ii) Kalawa in the Malunda sub-location, (iii) Mulala and (iv) Emali in the Iteta sub-location, and (v) Kasikeu and (vi) Sultan Hamud in the Muaani sub-location. Sub-locations are the smallest government administrative units and each has about 500–800 farm households. One hundred households from each sub-location were selected randomly in proportion to village population. The household survey was then carried out in 2006/2007. A formal survey instrument was prepared, and trained enumerators collected the information from the households via personal interviews. Out of a total of 400 households interviewed, only 333 households were used for final analysis.Footnote 4
The survey collected valuable information on several factors, including household composition and characteristics, land and non-land farm assets, livestock ownership, pigeonpea varieties and area planted, costs of production, yield data for different crop types, indicators of access to infrastructure, household market participation, household income sources, and major consumption expenses.
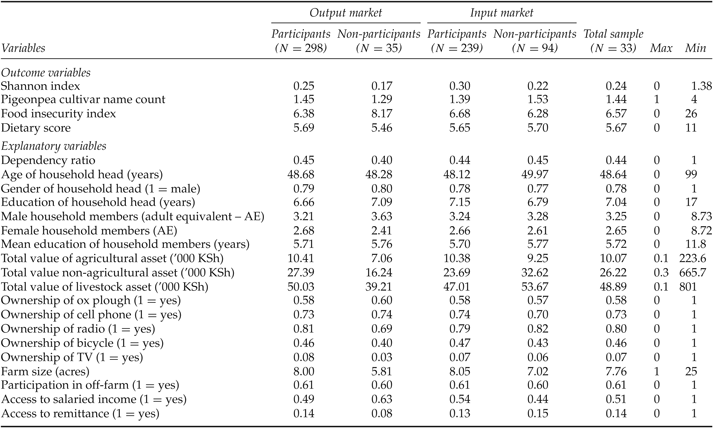
Summary statistics for continuous variables and proportions for binary variables for participants and non-participants are presented in table 1. Some of these characteristics are the explanatory variables of the estimated models presented further on. The data set contains 333 farm households and, of these, about 89 per cent and 72 per cent are output and input market participants, respectively. The average age of the sample household head is about 48 years old and about 22 per cent are female. The average years of education of household heads is about 7, whereas the mean years of education of household members is about 5.7. About 44 per cent of household members are economically inactive as per the dependency ratio.Footnote 5 The average number of male household members in adult equivalent is about 3.2, whereas the average number of female household members is about 2.6. The average farm size is about 7.76 acres and about 58 per cent of the sample households own an ox plough. About 73 per cent and 80 per cent of the sample households have access to a cell phone and radio, respectively. Only 7 per cent have access to television and about 46 per cent own a bicycle. The data also show that about 61 per cent of the sample households participate in off-farm activities, and about 51 per cent have access to salaried income. Only 14 per cent of the sample households have received some remittances.
Differences in characteristics of participants and non-participants (sample mean)
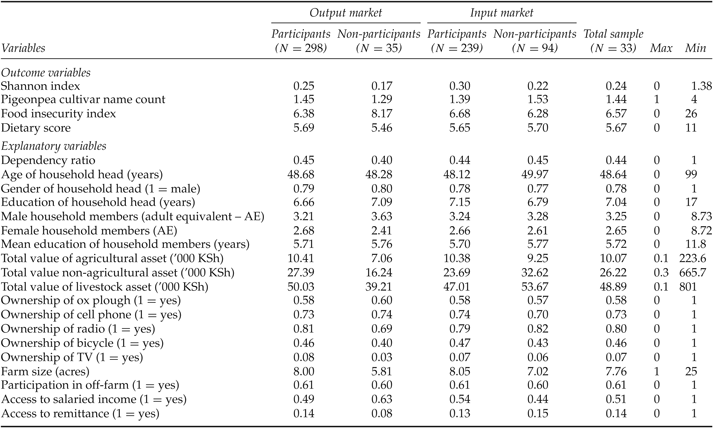
Note: Adult equivalent is an aggregate indicator for a household size and we follow Dercon and Krishnan (Reference Dercon and Krishnan1998) to contract this variable.
The unconditional summary statistics in table 1 also suggest that market participation may have a role in affecting on-farm pigeonpea diversity and household welfare. However, because participation is endogenous, a simple comparison of the outcome indicators of participants and non-participants has no causal interpretation. That is, the above differences may not be the result of market participation, but instead may be due to other factors, such as differences in household characteristics and the endowments mentioned above. To measure the impact of participation, it is necessary to take into account the fact that individuals who participated in the output/input market might have achieved a higher level of welfare even if they had not participated. Therefore, we need to add a careful multivariate analysis to test the impact of output/input market participation on pigeonpea diversity and household welfare.
5. Results and discussion
Our primary approach in this study is to examine how different factors influence input and output market participation, and to evaluate the causal impact of input and output market participation on on-farm pigeonpea diversity and household welfare. The econometric analysis is performed in two steps. In the first section, a logit estimation of output and input market participation is presented. In the second section, results of the differential impact of market participation on pigeonpea diversity and household welfare are presented.
5.1. Determinants of participation in the local seed (input) and output market
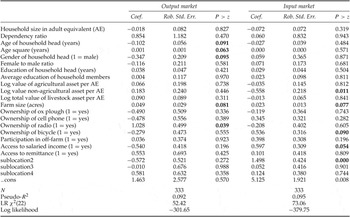
Logit estimates of the market participation propensity equation are presented in table 2. The logit model has a McFadden pseudo-R 2 value of 0.09 for both the input and the output market, and a log likelihood value of −301 and −379 for the output and the input market, respectively.
Determinants of pigeonpea output and input market participation: logit model

The results of the estimations analyzing input and output market participation (equation (1)) suggest that the two decisions are quite distinct and that the factors driving the participation decision for input market participation are different from those of output market participation. The likelihood of output market participation is highly affected by the age of household head. The coefficient of age and age square is statistically significant with opposite signs. Somewhat unexpectedly, results show that younger household heads tend to participate more in the pigeonpea output market. However, as indicated by the positive sign of the age-squared variable, there is an age threshold beyond which the older heads also participate more in the output market. Pigeonpea is considered a women's crop and thus the finding that male-headed households are less likely to participate in the pigeonpea output market is not surprising.
Farm size, however, has a positive significant effect on output market participation while other wealth-related variables such as agricultural assets, non-agricultural assets and livestock assets show a positive but insignificant effect on participation. As expected, larger farms appear to produce surplus compared to smaller farms and, as a result, participate more in the output market. These results demonstrate the critical role of land holding in promoting pigeonpea market participation among smallholders. Asset holding can also play a valuable indirect role in facilitating access to credit, adoption of agricultural technologies and, in turn, increase marketed surplus. On the other hand, ownership of a radio also appears to positively affect output market participation, perhaps signaling access to market information.
For the input market, farm size also has a positive significant effect on input market participation; however, contrary to our expectation, non-agricultural assets tend to be negatively correlated with input market participation. Larger farms appear to require more seed and therefore regularly rely on the local seed market for supply. As expected, ownership of a bicycle tends to positively affect participation in the input market, as owning a bicycle may reduce the transaction costs of market access. Households who have access to salaried income participate more in the input market compared to households who do not have access, perhaps suggesting the relaxation of liquidity constraints. The results indicate that households located in the Thavu sub-location where the ICRISAT-supported PMGs were established were significantly more likely to participate in the local market for seeds.
5.2. Impact of market participation on crop diversity and household welfare
In this section, we are interested in the underlying causal effects of input and output market participation on on-farm pigeonpea diversity and household welfare. We used two indicators for measuring diversity – the Shannon index and the number of pigeonpea cultivars planted. We also used two indicators of household welfare – an indicator of household food insecurity as well as a household dietary diversity score. The simple mean comparisons between market participants and non-participants demonstrate that the participant group is often distinguishable in terms of these outcome indicators for the input market, although not for the output market. The problem with such mean separation tests is non-comparability of the two sub-samples and also the fact that we did not control for the effect of other covariates. In this section of the paper, PSM methods are employed to verify whether these differences in mean diversity values remain unchanged after controlling for all confounding factors.
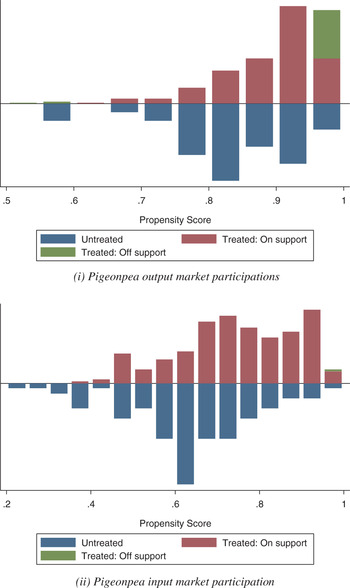
Before turning to assessing the impacts of output and input market participation on household-level outcomes, we briefly discuss the quality of the matching process. After estimating the propensity scores for participant and non-participant groups, we check the common support condition.Footnote 6 A visual inspection of the density distributions of the estimated propensity scores for the two groups (figure 1) indicates that the common support condition is satisfied: there is substantial overlap in the distribution of the propensity scores of both participant and non-participant groups. The bottom half of the graph shows the propensity score distribution for non-participants and the upper half refers to participants. The densities of the scores are on the y-axis.
Propensity score distribution and common support for propensity score estimation

As noted above, a major objective of the propensity score estimation is to balance the distribution of relevant variables between participants and non-participants, rather than obtain a precise prediction of the selection treated. See table 3 for detailed results of covariate balancing tests before and after matching.Footnote 7 For output market participation, the standardized mean difference for overall covariates used in the propensity score (around 16.5 per cent before matching) is reduced to about 10.9 per cent after matching. The variance after matching is reduced to 79 from 129 before matching. This substantially reduces total bias through matching. The p-values of the likelihood ratio tests indicate that the joint significance of covariates was rejected after matching, whereas it was not rejected before matching. The pseudo-R 2 also dropped significantly, from 10 per cent before matching to about 6 per cent after matching. The low pseudo-R 2, low mean standardized bias, high variance reduction, and the insignificant p-values of the likelihood ratio test after matching suggest that the proposed specification of the propensity score is fairly successful in terms of balancing the distribution of covariates between the two groups.
Matching quality indicators before and after matching for Kernel-based estimation – pigeonpea output and output market participation

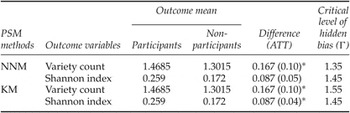
The estimated results of the impact of market participation on pigeonpea diversity based on the two matching algorithms, the Kernel method (KM) and nearest neighborhood method (NNM), are reported in table 4 for the output market and table 5 for the input market. All the analyses are based on the implementation of common support and caliper, so that the distributions of participants and non-participants are located in the same domain. As suggested by Rosenbaum and Rubin (Reference Rosenbaum and Rubin1985), we use a caliper size of one-quarter of the standard deviation of the propensity scores. Bootstrap standard errors based on 100 replications are reported.
Impact of output market participation on pigeonpea diversity: Kernel matching (KM) and nearest neighbor matching (NNM)

Note: Statistical significance at the 99% (***), 95% (**) and 90% (*) confidence levels. The numbers in parentheses show bootstrapped standard errors using 100 replications of the sample.
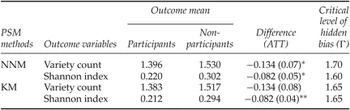
Impact of input market participation on pigeonpea diversity: Kernel matching (KM) and nearest neighbor matching (NNM)

Note: Statistical significance at the 99% (***), 95% (**) and 90% (*) confidence levels. The numbers in parentheses show bootstrapped standard errors using 100 replications of the sample.
The analysis reveals that participation in the output market has a significant positive impact on on-farm pigeonpea diversity, while input market participation has the opposite effect. For the output market, the overall average gain of participation in variety count is about 0.167, whereas for the Shannon index it is about 0.087. The estimated gain was statistically significant at 90 per cent confidence level for both KM and NNM matching, and both matching algorithms resulted in similar findings. This result is contrary to our expectations of lower diversity for those participating in the output market.
On the other hand, for the input market, both KM and NNM estimates indicate a negative impact of participation on pigeonpea diversity, although one of the four matching algorithm coefficients is not significant. Participation in the input market reduced the Shannon index by 0.082 on average compared to non-participants, while the reduction in variety count is about 0.134, which is the average difference between indexes of similar pairs of the households belonging to participants and non-participants. Overall, these results indicate (assuming there is no selection bias due to unobservable factors) that pigeonpea diversity for farmers who participated in the output market is significantly higher than for non-participants, whereas input market participants manage less pigeonpea diversity compared to non-participants.
Marketing pigeonpea is associated with a higher range of on-farm diversity, suggesting that output market participation does not promote specialization into any one type of pigeonpea variety and, in fact, may promote the use of several varieties by creating demand for production over longer periods, or for different consumption uses, which would require a range of crop varieties. For the input market, we find unambiguous results suggesting participation is associated with specialization into certain varieties, and non-participants have a more even distribution of diversity, e.g., they are less likely to specialize in any one variety. This result may be driven by the presence of superior improved varieties in some of the market outlets linked to ICRISAT breeding programs. If these varieties are superior to locally available ones, it is not surprising that farmers replace their existing ones – and this could lead to a narrowing of varieties on-farm.
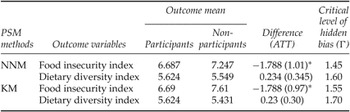
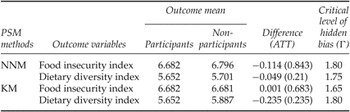
Tables 6 and 7 report the estimates of the average market participation effects on household welfare indicators. Two outcome variables are used in the analysis: the household food insecurity access scale and the household dietary diversity score. The results indicate that participation in the output market has a positive and significant effect on reducing food insecurity, although there is no significant impact on dietary diversity. The decrease in the HFIAS is about 1.788 using both algorithms. Contrary to our expectations, we find no positive relationship between input market participation and the household welfare indicators.
Impact of output market participation on household welfare: Kernel matching (KM) and nearest neighbor matching (NNM)

Note: Statistical significance at the 99% (***), 95% (**) and 90% (*) confidence levels. The numbers in parentheses show bootstrapped standard errors using 100 replications of the sample.
Impact of input market participation on pigeonpea diversity: Kernel matching (KM) and nearest neighbor matching (NNM)

Note: Statistical significance at the 99% (***), 95% (**) and 90% (*) confidence levels. The numbers in parentheses show bootstrapped standard errors using 100 replications of the sample.
Also presented in tables 4–7 are the results of the Rosenbaum bounds sensitivity analysis on hidden bias. The critical value of gamma (at which point we would question our conclusion of a positive effect of output market participation on on-farm pigeonpea crop diversity and a negative effect of input market participation on pigeonpea diversity) starts in the range of Γ = 1.35 − 1.80. This implies that, if individuals with the same covariates differ in their odds of participation by a factor of 35–80 per cent, the significance of the market participation effect on outcome variables may be questionable. Based on the existing literature and our own intuition, we feel that these are large values because we included the most important variables that affect both the participation decision and the outcome variable in the estimation of the propensity score.
6. Summary and conclusions
Recognizing that crop diversity is the foundation upon which agriculture is built and that market participation has a major impact on it, as well as farm welfare, this study was undertaken to assess the factors that drive participation in both the seed (input) market and the output market, and to analyze the implications for on-farm crop diversity as well as household welfare, measured by the Shannon index and number of pigeonpea cultivars planted, and the HFIAS and HDD scores, respectively. The study utilizes cross-sectional farm household-level data collected from a randomly selected sample of 333 households in the Makueni District in Kenya. A bivariate logit model is used to estimate the determinants of input and output market participation, whereas the welfare and pigeonpea diversity implications of output and input market participation are analyzed, taking into account possible endogeneity problems. We find significant differences in the determinants of input vs. output market participation, and the effects of such participation on welfare and on-farm diversity for pigeonpea. Noting that the differences in welfare and pigeonpea diversity outcomes could be due to factors other than market participation, we have attempted to control for the endogeneity of the participation decision by using the PSM technique.
The results of the logit model suggest that input and output market participation decisions are quite different. The propensity to participate in the output market is highly influenced by household demographics (i.e., age of household head and age square), and the gender of the household head. Younger and female-headed households are more likely to participate in the pigeonpea output market. On the other hand, household demographics tend not to play a vital role in the input market participation decision. Farm size, however, had a positive significant effect on both output and input market participation. Larger farms tend to require more input such as seed and consequently produce surplus for the market as compared to smaller farms. On the other hand, there is some suggestion that indicators of wealth are associated with market participation: ownership of a radio appears to positively affect output market participation, while ownership of a bicycle tends to positively affect participation in the input market. Access to salaried income also has a positive effect on input market participation.
Two main conclusions can be drawn from the results on the effect of market participation on pigeonpea crop diversity and household welfare. Firstly, the group of farm households that participated in the output market maintains greater pigeonpea diversity on-farm than households that did not participate in the output market. On the other hand, input market participants maintain lower levels of on-farm pigeonpea diversity as compared to non-participants. These results suggest that the output market actually encourages diversification of pigeonpea varieties, while the input market encourages specialization. Secondly, we generate estimates of the impact of output and input market participation on the welfare of the surveyed population. Our results suggest that output market participants have significantly higher food security status than non-participants, although there is no significant impact on dietary diversity. This result is consistent with the literature indicating a positive relationship between market participation and higher levels of farm household welfare. However, contrary to our expectations, we find no evidence of any link, either positive or negative, between input market participation and welfare. Thus it is not clear whether input market participation is driven by desperation in terms of the need to replace lost seed – in which case one would expect a negative relationship with welfare measures – or by a choice of specialization into preferred and higher producing varieties, which would imply a positive relationship with welfare. The lack of clear results may suggest that both are occurring.
Generally the results suggest that, for the specific circumstances of pigeonpea production and marketing in Kenya, there is no trade-off between output market participation and maintaining on-farm diversity, and there is indeed a positive relationship between market participation, on-farm diversity and farm household welfare. The analysis also suggests that input and output market participation are driven by different factors, and have different farm-level impacts, which is important to consider in future studies of market participation, household welfare and on-farm diversity.