INTRODUCTION
The African filarial worm Loa loa is well known for spectacularly migrating under the eye conjunctiva, and its association with transient oedemas called ‘Calabar swelling’. Even if these signs make it one of the primary causes of consultation in the endemic areas (Boulesteix and Carme, 1986), loiasis is not regarded as a very serious disease. However, individuals harbouring high microfilaraemias may, exceptionally, develop serious spontaneous neurological or renal complications (Cauchie et al. 1965; Zuidema, 1971). More significantly, it is well known that high microfilarial (mf) loads are associated with a risk of developing neurological serious adverse events (SAEs) after treatment with the filaricidal drugs diethylcarbamazine (DEC) and ivermectin (Fain, 1978; Carme et al. 1991; Gardon et al. 1997a; Boussinesq et al. 1998). Thus, following ivermectin treatment, it has been demonstrated that individuals presenting with high mf loads (>8000 mf/ml), and those with very high mf loads (>30000 mf/ml) had, respectively, an increased risk of developing severe adverse reactions without neurological involvement, and SAEs (Gardon et al. 1997a). In the context of the Community Directed Treatment with Ivermectin (CDTI) carried out in Africa, these SAEs are of crucial concern as they can lead to fatal outcomes and jeopardize the success of the African Programme for Onchocerciasis Control (APOC) (Twum-Danso, 2003).
In loiasis, many individuals do not present with microfilariae (mfs) in their peripheral blood, a phenomenon usually described as ‘occult loiasis’, yet they may prove to be infected because of previous history of subconjunctival worm passage. While genetic epidemiology (Garcia et al. 1999) and immunological studies (Winkler et al. 1999; Akué et al. 2002; Walker-Deemin et al. 2004) have brought useful insights into understanding the processes leading to some individuals developing L. loa microfilaraemia, the population dynamics of L. loa remains poorly documented. In a previous paper, we presented a detailed analysis of the structure of the microfilarial reservoir of L. loa in an endemic population through the study of host age- and sex- specific parasitological profiles in terms of prevalence and intensity of microfilaraemia (Pion et al. 2004). Our results indicate that the prevalence of microfilaraemia increases with age, is higher for males than females and, more unexpectedly, that, for a given level of endemicity, the mean intensity among microfilaraemic individuals remains nearly unchanged with host age.
The prevalence and intensity of an infection are but two characteristics of the distribution of parasites among hosts. In addition, parasite distributions are typically overdispersed. The degree of parasite overdispersion is a key parameter of the stability and dynamics of a host-parasite system (May and Anderson, 1978; Dobson and Hudson, 1992) and, according to some authors, it is constant and characteristic for a given host-parasite system (Bliss and Fisher, 1953; Pichon et al. 1975, 1980; Quinnell et al. 1995). However, it would be expected that the distribution of parasites per host is a dynamic property within a given host-parasite system depending, for instance, on the intensity of transmission, the age-structure of the host population, and the operation of age-dependent and/or density-dependent processes (Adler and Kretzschmar, 1992; Pugliese et al. 1998). Since, to our knowledge, mf aggregation has never been characterized for L. loa, we focus, in the present paper, on the distribution of the L. loa mf loads in the human population.
Besides the population dynamics aspects, characterizing the distribution of L. loa mfs among humans may be particularly useful for assessing the proportion of the host population at risk of post-treatment SAEs. In particular, the negative binomial distribution (NBD) provides a simple relationship between the prevalence and the mean intensity of infection which depends on the magnitude and functional form of the overdispersion parameter (Anderson, 1982). This relationship has been used to investigate the distribution of helminths parasites in humans (Anderson and May, 1985; Guyatt et al. 1990; Basáñez and Boussinesq, 1999), wildlife hosts (Shaw and Dobson, 1995; Shaw et al. 1998), and vectors (Cheke et al. 1982; Renz, 1987; Basáñez et al. 1995). If the overdispersion parameter can be determined for L. loa, it would be possible, in principle, to estimate the mean mf load in a community given its prevalence. This approach has been used successfully for Onchocerca volvulus in humans (Basáñez et al. 2002) and vectors (Basáñez et al. 1998).
Since a predictive spatial model for prevalence of L. loa microfilaraemia from environmental data obtained by remote sensing has been developed and validated (Thomson et al. 2004), prevalence estimates can easily be obtained for the whole distribution area of the parasite. If the NBD model were also validated, merging the results obtained by the Thomson et al. model with a well-defined relationship between community prevalence of microfilaraemia and prevalence of heavy infections, would provide a useful tool to aid SAEs surveillance in CDTI campaigns.
In the present study, we explore the patterns of L. loa mf aggregation in endemic populations, and develop and test a model to predict the prevalence of heavy L. loa mf loads in a community given its mf prevalence.
PATIENTS AND METHODS
Study area and parasitological surveys
The study areas and the methods used for selecting and examining subjects have been previously described (Gardon et al. 1997a; Boussinesq et al. 2001; Pion et al. 2004). Briefly, the data analysed in the present paper were collected as part of a trial conducted in 1995–1996 in the Lékié Division (Central Province, Cameroon) to evaluate the incidence of L. loa related post-ivermectin SAEs and to identify risk factors associated with the latter. During this trial, 4183 subjects aged [ges ]15 years were examined in 36 communities. This age group was chosen because, at the time of this trial, all the SAEs reported so far had occurred in individuals [ges ]15 years.
From each consenting individual, a blood sample was collected by finger-prick, between 10.00 and 16.00 h, in a non-heparinized capillary tube, and calibrated thick blood films were immediately prepared, using 50 μl of blood. Each Giemsa-stained smear was then examined under a low-power microscope and all the L. loa mfs present on the slide were identified and counted. All the persons examined had been questioned as to whether they had received any antifilarial treatment previously, and the data from those few who had been treated during the last 5 years were discarded from analysis.
Statistical analysis
Method to assess overdispersion
Various methods to assess the degree of parasite contagion or aggregation have been advocated in the literature, among which the variance to mean ratio (VMR) investigates discrepancy from the Poisson or random distribution (VMR=1), and the index of discrepancy measures departures from the uniform distribution (all hosts harbour the same number of parasites) (Poulin, 1993; Poulin and Morand, 2000). We chose to assess aggregation through the parameter k of the NBD fitted to observed mf distributions in population strata as defined in the following section. However, during preliminary analyses, the NBD model, when fitted to the complete observed distributions of mf densities (including zero densities), did not provide satisfactory fits, whereas the zero-truncated NBD model provided adequate fits. Thus, assuming that the zero count class may not be reliable because only ~60% of the infected population would be genetically predisposed to present with microfilaraemia (Garcia et al. 1999), and that some individuals may be false-negatives (due to the lack of sensitivity of the blood film method when microfilaraemia is low), we chose the zero-truncated NBD (tNBD) model (Pichon et al. 1980; Grenfell et al. 1990).
Estimates of k (and corresponding variance) were obtained using the maximum likelihood method (MLM) proposed by Sampford (1955) and confidence intervals were obtained by bootstrapping (1000 simulations for each stratum). The fits to tNBD and calculations of confidence intervals were performed using Stata 9.0. Goodness of fit was tested using χ2 tests with the number of degrees of freedom equal to the number of frequency classes – 3 (Elliott, 1977).
Patterns of microfilarial aggregation with host age and sex by level of endemicity
Investigation of parasite overdispersion with age and transmission intensity has been used to obtain insights into the possible operation of age- or parasite density-related processes regulating population dynamics (Anderson and Gordon, 1982; Pacala and Dobson, 1988; Fulford et al. 1992; Woolhouse et al. 1994; Das et al. 1995; Filipe et al. 2005). We classified the villages according to 3 endemicity levels based on the prevalence of microfilaraemia in the population aged [ges ]15 years, as a proxy for transmission intensity. These levels were: low endemicity (<25% mf prevalence), moderate endemicity (25–34·9%) and high endemicity ([ges ]35%). In each of these categories, the populations were subsequently sorted by sex and age according to the following age classes: 15–19, 20–29, 30–39, 40–49, 50–59 and [ges ]60 years. The total population was thus divided in 36 different strata (3 prevalence classes×2 sexes×6 age classes). We estimated k for each separate stratum. We then tested whether k varied by group using a linear regression of k on age-sex-endemicity group; such a method has been used to investigate aggregation patterns of Schistosoma haematobium in human populations (Woolhouse et al. 1994).
Predicting prevalence of heavy infection given mf prevalence
We aimed at developing a model to predict the prevalence of heavy L. loa mf loads in a community given the prevalence of microfilaraemia in those aged [ges ]15 years in such a community. To this end, we considered the village as the epidemiological unit, so this part of the analysis was conducted at community level.
Let Xi denote the random variable equal to the mf count in an individual aged [ges ]15 years old and living in community i; xi the actual value of Xi; πi the overall prevalence of microfilaraemia in those aged [ges ]15 years in community i (i.e. πi=Prob(Xj >0), and T the microfilaraemia threshold above which an individual is considered to have heavy infection. Then, following the results obtained in the first part of the analysis, we assume that, in a given village (i), the frequency distribution of mf counts in those microfilaraemic follows a truncated NBD with parameter Mi, the mean mf intensity, and ki, the overdispersion index, i.e.
Xi~tNBD(Mi,ki). Thus, the proportion of people in community i presenting with more than T mf/ml is:

Explicitly, the tNBD of mf counts is given by:
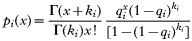
where

and Γ is the gamma function.
Our aim was to render expression (1) exclusively in terms of πi. For this purpose, we modelled, on the one hand, Mj as a function of πi, and, on the other hand, ki as a function of πi.
(i) Relationship between Miand πi
As the simplest possible approximation and motivated by inspection of the data, we assumed a linear relationship, across communities, between the mean microfilarial load and the microfilarial prevalence in those aged [ges ]15 years,

(ii) Relationship between kiand Mi
Parameter ki was estimated for each separate village i using the maximum likelihood method described in the first part of the analysis. Then, parameter ki was included in equation (1) using 2 alternative functional forms: a constant value kc=0·3 (the mean k value obtained either in the ‘per age and sex stratum’ analysis or in the ‘per village’ analysis of the current data, see Results section), and a log-linear relationship with mean mf intensity, ki=α+βlog(Mi). This model has been chosen because Mi>0. In this latter model, we also used the relationship between Mi and πi derived from equation (2). The empirical relationships between Mi and πi, and between ki and Mi were fitted to the current study data using the least squares method, analogous to the linear regression approach used above.
We applied expression (1) to 2 different threshold values: T=8000 mf/ml and 30000 mf/ ml. The first value corresponds to the threshold above which there is a significant increase in the relative risk of occurrence of functional impairment following ivermectin treatment, and the second threshold, to the value above which the risk of occurrence of serious neurological reactions is increased (Gardon et al. 1997a). Deviation of these predictions from the observed data was assessed using χ2 tests.
RESULTS
Patterns of microfilarial aggregation amongst the different strata of the host population
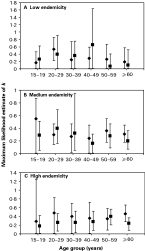
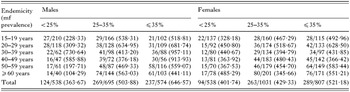
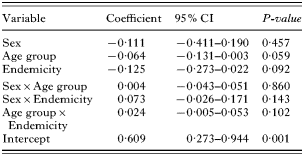
Table 1 shows the number of microfilaraemic individuals out of the total number of subjects examined and the arithmetic mean of the positive mf loads in the 36 different strata of the population. The 36 values of k estimated by MLM ranged between 0·07 and 0·66 (Fig. 1). The average, common k, kc, calculated as the mean of the age-, sex- and endemicity- specific k values, weighted by the reciprocal of each value's estimated variance, was 0·30. According to χ2 tests, the tNBD provided satisfactory fits to the observed data in all but 1 stratum (males aged 15–19 years in high endemicity villages, k=0·29). The use of kc to represent ki for each village is supported by the linear regression model, in which parameter k was independent of sex and age of the host, or level of endemicity in the village, either as main effect or included in 2-way interactions (Table 2). It should be noted that the test is approximate, and that a non-significant regression coefficient for any of the factors considered only indicates such a factor is likely to be unrelated to k.

Fig. 1. The degree of microfilarial overdispersion in Loa loa, assessed by the k parameter of zero-truncated negative binomial distribution, according to host age and sex ([lozf ]: males; [squf ]: females) for different endemicity levels: (A) prevalence of microfilaraemia in the population aged [ges ]15 years, πi<25%, (B) 25[les ](πi)<35% and (C) (πi)[ges ]35%.
Table 1. Number of individuals presenting with Loa loa microfilaraemia among the total number of subjects examined and arithmetic mean of the positive microfilarial loads (in parentheses) for each sex-, age- and endemicity (measured as the mf prevalence) category in the 36 villages of the Lékié division surveyed in 1995–1996 (A total of 8, 15 and 13 villages were respectively grouped in the <25%, 25–35% and [les ]35% endemicity categories.)

Table 2. Estimates of the linear regression coefficients of the NBD overdispersion parameter k on individual-level variables (host age and sex) and village-level variable (endemicity level) for the distribution of Loa loa microfilarial loads in the Lékié Division, Central Province, Cameroon (Model is: k=β0+β1 (Sex)+β2 (Age group)+β3 (Endemicity)+β4 (Sex)×(Age group)+β5 (Sex)×(Endemicity)+β6 (Age group)×(Endemicity).)

Predicting the prevalence of high microfilarial loads from the prevalence of microfilaraemia
Relationships between mean intensity. Mi and microfilarial prevalence πi at community level
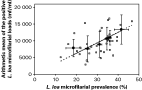
As a first approximation, a linear relationship between the prevalence and mean intensity of L. loa microfilaraemia for every village did not provide a very satisfactory fit (coefficient of determination, R2=0·27). To obtain a more robust relationship to be used in the subsequent modelling, we aggregated the villages according to their πi values, in the 6 following groups [12–22], [22–27], [27–32], [32–35], [35–38] and [ges ]38%, with 6 villages in each group. The linear relationship obtained using this grouping (Mi=316·4πi) was very similar to that obtained when considering separate communities (Mi=314πi) but considerably improved the fit (R2=0·78); while the improvement was largely due to a reduction in the number of data points and therefore in the variability of the data, the similarity of the fits suggests that the regression estimate is essentially independent of data grouping (Fig. 2).

Fig. 2. Relationship between the intensity of microfilarial (mf) loads in the population aged [ges ]15 years in the community and the Loa loa microfilarial prevalence in the same age-group. The squares represent the different villages and the bins (black dots) represent the same villages grouped according to their microfilarial prevalence (6 classes, see text). Vertical error bars indicate standard errors of the mean within prevalence bins; horizontal error bars are the standard errors for the mf prevalence using the normal approximation to the binomial distribution. The dotted line is the regression line with individual village (Mi=314πi; R2=0·27); the solid line is the regression line for the grouped villages (Mi=316·4πi; R2=0·78).
Relationship between aggregation parameter ki and mean intensity Mi
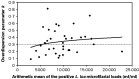
Values of ki assessed for each separate village ranged between 0·09 and 0·81 (Fig. 3). There was no trend in the variation of k with the mean mf load; the slope coefficient of the log-linear regression (ki=αi+βi log(Mi), with α=−0·31 and β=0·07) was not significantly different from zero (t=0·16; P<0·317), supporting the hypothesis that the degree of mf aggregation is not affected by the level of microfilarial intensity in the community.

Fig. 3. Relationship between the degree of microfilarial aggregation among the positive individuals aged [ges ]15 years, assessed by the parameter k of zero-truncated negative binomial distributions, and the intensity of microfilarial loads in the community, expressed as the arithmetic mean of the positive microfilarial counts. Solid line: logarithmic function kj=0·07 log(Mj)−0·31; dashed line: constant function kj=0·3.
Predicting the proportion of heavy microfilarial loads
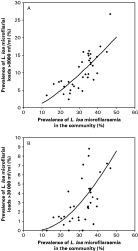
The predicted prevalence of heavy infections (eqn 1), for T=8000 and T=30000 mf/ml, respectively, were in good agreement with the observed distribution of heavy mf loads (Fig. 4A and B). The model assuming a constant value for the degree of mf aggregation (kc=0·3) gave satisfactory fits, with non-significant departures between data and models for both the 8000 (χ2=39·36, D.F.=36, P<0·66) and 30000 (χ2=46·98, D.F.=36, P<0·10) mf/ml thresholds. The model assuming a log-linear function, ki=0·07 log(Mi)−0·31 provided similar goodness-of-fit values (χ2=39·01, P<0·34, D.F.=36 for T=8000; and χ2=48·11, P<0·09, D.F.=36 for T=30000).

Fig. 4. Relationship between the proportion (in %) of individuals with microfilarial loads above (A) 8000 mf/ml and (B) 30000 mf/ml and the prevalence of Loa loa microfilaraemia among those aged [ges ]15 years in the community. Diamonds: observed values; solid line, predicted relationship with Mi=314πi and kc=0·3.
DISCUSSION
Population dynamics insights
At the time of the surveys, mass ivermectin distribution had not been initiated, and to our knowledge, no significant environmental or ecological changes had taken place in the area. Therefore, our assumption is that the L. loa population was at endemic equilibrium with its human and vector hosts. Our work thus contributes to the characterization of the distribution of L. loa among humans and to highlight its epidemiological implications in natural, non-intervened settings.
One of the main motivations for using the NBD model is that once the degree of overdispersion has been characterized, the theoretical frequency distribution is entirely defined by the arithmetic mean. As the latter is related to the prevalence, it is possible to estimate, from prevalence values, the proportion of hosts harbouring mf densities above an arbitrary threshold (Guyatt and Bundy, 1991). However, the standard NBD model did not fit well the distribution of the L. loa mf loads probably because in southern Cameroon only ~60% of the population is genetically predisposed to present with microfilaraemia (Garcia et al. 1999). Instead, the zero-truncated negative binomial distribution, used to describe Wuchereria bancrofti (Pichon et al. 1980; Das et al. 1990; Grenfell et al. 1990) and Brugia malayi (Srividya et al. 1991) mf densities in some foci of lymphatic filariasis, was found to fit particularly well the distributions of L. loa mf loads among the positives.
Some of the models proposed to understand the mechanisms generating overdispersion in host-parasite systems, predict a decrease in the level of aggregation (increase of k) with host age in the presence of down regulatory density dependence. Such a trend has been taken to indicate operation of parasite-induced mortality of individuals harbouring high parasite densities (Anderson and Gordon, 1982; Pacala et al. 1988) or the development of acquired immunity with age and exposure to infection (Woolhouse et al. 1991; Fulford et al. 1992). We observed a very stable degree of aggregation in the different strata of the population. The fact that we did not observe any trend in the overdispersion pattern with host age does not, however, necessarily imply the absence of processes regulating abundance of L. loa mfs within an individual. Different complex processes, acting simultaneously, may lead to this apparently simple pattern (Duerr et al. 2003). In the case of loiasis, since spontaneous lethal complications are quite uncommon, it seems reasonable to discard a process of parasite-induced mortality of heavily infected hosts in the absence of antifilarial treatment.
Comparison with previous studies on aggregation in filarial infections
Comparing values of k between different species for which the mean infection intensities are different has some limitations (Taylor et al. 1979; Gregory and Woolhouse, 1993). Nonetheless, the range of overdispersion values observed for L. loa was very similar to those observed for other filarial species such as W. bancrofti. For this species the value of k has been estimated, using the tNBD model and from independent population samples, as ~0·3 (Pichon et al. 1980; Grenfell et al. 1990). For O. volvulus, an age-structured model using a zero-inflated NBD yielded k around 0·5 for hosts aged [ges ]15 years (Filipe et al. 2005).
Predictions of the proportion of the population at risk of SAEs
We developed a semi-empirical model, aiming at predicting the proportion of the population at risk of post-filaricidal treatment SAEs given the prevalence of microfilaraemia among those aged [ges ]15 years in the community. We developed 2 alternative models, incorporating different assumptions about the relationship ki(Mi) between overdispersion and mean mf load among the positives in a community: one with ki varying with Mi and another with a common ki, kc. The predictions were not very sensitive to the assumption about ki, so adopting a constant value for k (k=0·3) would be the most parsimonious and practical approach.
However, if kc~0·3 corresponds to endemic equilibrium, the patterns of aggregation are likely to change in communities where large-scale filaricidal treatment is organized. This might constitute a limitation of our present modelling approach, which stands on the analysis of undisturbed populations. Yet, the SAEs are most likely to occur among individuals receiving their first treatment with ivermectin, the post-treatment mf loads usually remaining below the risk threshold until the next treatment round (Gardon et al. 1997b). A model including a ki(Mi) function would, in principle, be better suited for tracking changes with mean mf densities following treatments.
The maps provided by the model developed by Thomson et al. (2004) are now used to support APOC's activities, when setting up the CDTI in ivermectin-naïve areas. Such maps give a particularly useful indication of locations where the SAEs surveillance procedures have to be strengthened. As a useful addition to the information generated by the spatial maps, our model would provide information on the proportion of the population at risk of SAEs. The Thomson et al. model gives an indication of location and overall prevalence but not of likely numbers to be affected. If we were able to validate our predictive models at the continental scale across regions where L. loa is endemic, either using constant or dynamical overdispersion parameters, we should be able to link the maps of predicted prevalences with maps of population at risk of post-treatment SAEs generated by distributional assumptions. This would constitute a breakthrough regarding the ‘Loa challenge’ APOC is now facing.
S.D.S.P. is grateful to the Fondation pour la Recherche Médicale and the Fondation Singer-Polignac for financial assistance. J.G. thanks the River Blindness Foundation. The field work was supported by UNDP/World Bank/WHO Special Programme for Research and Training in Tropical Diseases (Project ID number 950244), and the Institut de Recherche pour le Développement. M.-G.B. and J.A.N.F thank the Medical Research Council (MRC) of the U.K. Dr Paul Clarke helped in the statistical analysis and provided useful comments to the manuscript.