Central line–associated bloodstream infections (CLABSIs) are healthcare-associated infections of national importance, responsible for as many as 164,000 preventable infections in the United States per year.Reference Umscheid, Mitchell, Doshi, Agarwal, Williams and Brennan 1 Since the demonstration that CLABSIs are preventable,Reference Pronovost, Needham and Berenholtz 2 CLABSI rates have been used for benchmarking purposes, have been mandated as performance measures at the state level, and have been used by Centers for Medicare and Medicaid Services as a quality performance measure.Reference McKibben, Horan and Tokars 3 – Reference Passaretti, Barclay, Pronovost and Perl 5 CLABSIs have been included in hospital-acquired condition quality measures, which are a set of 10 conditions—including 3 healthcare-associated infections—that are used to detect events that impact quality in hospitals and reduce payments for hospitals with excess events. Many other hospital-acquired conditions rely purely on administrative data, but CLABSI surveillance requires an infection preventionist (IP) to perform manual medical chart data abstraction with application of definitions that require complex review of often subjective data elements.Reference Panzer, Gitomer, Greene, Webster, Landry and Riccobono 6 Surveillance case definitions for CLABSI have been developed by the Centers for Disease Control and Prevention’s (CDC) National Healthcare Safety Network (NHSN) and use a standard operational method for implementation.
Given the cumbersome process of manual medical chart reviews, risks of interobserver variability, and improved reliability of automated approaches,Reference Lin, Hota and Khan 7 – Reference Sexton, Chen, Moehring, Thacker and Anderson 14 innovative measurement methods and improved use of electronic record data may reduce variability in nosocomial infection surveillance. For NHSN CLABSI definitions, inherent uncertainty in the application of surveillance criteria may lead to variable interpretations. We developed a method that produces infection rates usable to benchmark facilities and units and that reduces the variability due to uncertainty present in the manual application of surveillance definitions. To demonstrate the utility of this measure, we used CLABSI surveillance and reported rates to evaluate a measure based on model-derived probabilities (ie, a probabilistic measure). We validated this method using positive blood cultures and expert reviews for CLABSI and propose this method as a more precise performance measure.
METHODS
Setting
We performed a multicenter evaluation to identify CLABSI events among patients with positive blood cultures. We recruited hospitals that used SafetySurveillor software system (Premier) and that also reported to the NHSN.
Design
We performed a retrospective cohort study of patients who were deemed eligible if they were hospitalized in an adult patient-care unit in which bloodstream infection surveillance had been performed by infection control professionals using NHSN definitions. Assessments were limited to those units providing care to adult patients and to those patients hospitalized from January 1, 2008, through June 30, 2009 (ie, the study period).
Recruitment and Enrollment
We sent a recruitment letter to eligible hospitals. Also, hospitals were recruited through a notification via the NHSN interface. Interested sites contacted CDC for further information, were then asked whether they used SafetySurveillor, and were enrolled on that basis. Hospitals interested in participating self-identified to NHSN through email or telephone to NHSN staff. Contacts at NHSN then followed up with representatives of interested hospitals to describe requirements of the project and obligations of participation.
Data Preparation
For hospitals that agreed to participate, all microbiology culture results during the study period were extracted from the SafetySurveillor data warehouse. Positive blood culture episodes eligible for expert review were defined as the deduplicated, deidentified set of patient first positive blood culture in a 30-day period obtained more than 2 days after admission; single positive cultures for common skin contaminants were excluded. The blood culture data set was deidentified and deduplicated by examining the first positive cultures of a particular species (or genus where species was not determined). Isolates were mapped to the Systematized Nomenclature of Medicine codes for organism name. Polymicrobial episodes, defined as greater than 1 unique isolate in a 5-day window period, were grouped into single episodes.
Sampling Strategy
To ensure equal representation among our 5 target unit types, a stratified sample was obtained from all eligible episodes from all units to generate a final set with an equal distribution (ie, 20%) from each unit type. Units were divided a priori into 5 major groups: medical intensive care units (ICUs), surgical ICUs, medical-surgical ICUs, hematology unit, or general medical-surgical wards (WARD). Subspecialty ICUs were grouped into medical or surgical ICUs on the basis of the expected presence of surgical patients in that unit; specialty care areas other than hematology were grouped into wards.
Expert Review
Two experienced IPs who were trained in use of NHSN definitions independently reviewed a random sample of eligible episodes for the presence of CLABSI. Reviewers were selected after being interviewed by NHSN personnel. The selection was based on prior experience in the field of infection control and prevention in the hospital setting. Both reviewers were experienced IPs with more than 5 years of experience performing surveillance of CLABSIs in healthcare settings. To standardize training, both reviewers were given training at CDC in a 1-day session with NHSN surveillance personnel. Training consisted of supervised review of NHSN CLABSI criteria, review of clinical vignettes, and review of deidentified clinical charts from CLABSI and non-CLABSI bacteremias.
Expert review of sampled episodes took place over a 6-month period (November 1, 2009–April 30, 2010). Enlisted sites were subject to review through the use of prepared patient lists and a web-based data collection form (see online supplementary material). A list of patients with sampled episodes was generated for each site and provided to both reviewers. Reviewers were provided access to paper medical charts and electronic records for individual patients at hospital sites and used these sources to complete the web form. When records were not available or accessible to a reviewer, no review was conducted. A third review was conducted on a sample of isolates in which discrepant results were noted between reviewer 1 and reviewer 2. The sample for a third review was generated on the basis of locations of facilities in which discordant episodes occurred, and feasibility of revisits based on scheduling and geographic location. CDC experts in the NHSN CLABSI surveillance definitions conducted this review. The results of these reviews were included in the analytic data set.
Acquisition of NHSN Data
For participating sites, NHSN data were obtained during the months for which the site submitted data according to NHSN rules (ie, in-plan months). The obtained data were linked to culture data using identifiers in the NHSN data set. NHSN data were obtained using the group user function.
Statistical Methods
Model development
Episodes in which the reviewer confirmed a central line was present were used to conduct regression analyses. To account for multiple determinations on the episode (2 or 3 reviewers), we used generalized estimating equations (Stata; StataCorp); probability sampling weights were used during the analysis (xtgee function, with pw parameter). Univariate and bivariate analyses were conducted using both reviewer determinations as the outcome variable. Final multivariate models were developed that included variables significant at the.05 level in univariate and bivariate analyses, and variable selection occurred using backward selection (see online supplementary material for further description). Variables were retained based on a P value <.20 to maximize variable retention; in addition, variables were retained on the basis of clinical importance, which was determined before the selection process through clinical review by infectious disease physicians and surveillance experts (B.H., S.K.F., W.T.). Clinical criteria for variable retention included presence of Staphylococcus aureus, given the importance of this pathogen as a community-acquired cause of infections; gram-negative aerobes, given the presence of these organisms in secondary sources of bloodstream infections, particularly among surgical patients; and hematology specialty care areas, owing to the different characteristics of patients in this location given mucosal injury from chemotherapeutics. This modeling process resulted in a probability model that we will subsequently refer to as our prediction rule.
Creation of prediction rule–based rate
For a given unit, the count of CLABSI events was obtained by summing the individual probability scores for each unique bacteremia episode in the unit. For example, to calculate the prediction rule numerator for a CLABSI incidence rate, the probability estimates generated by the prediction rule for positive blood cultures among sampled bacteremias with central lines were summed for a given in-plan location (ie, prediction rule CLABSI count).
Evaluation of prediction rule performance
In addition to examination of the discrimination of the prediction rule using goodness of fit and the c statistic (online supplementary material), 2 comparisons were made to evaluate prediction rule calibration: (a) a comparison of deciles of predicted probability to reference standard CLABSI prevalence for all episodes in all periods and (b) for in-plan unit-periods (ie, month and unit combinations for which data were reported to NHSN), a comparison of deciles of predicted probability to reference standard prevalence of CLABSI as well as NHSN-reported prevalence. For comparisons with NHSN data, the evaluation data set was joined to NHSN-reported CLABSIs (online supplementary material).
Incidence of CLABSI was also assessed for the reference standard, prediction rule, and NHSN-reported rates, for in-plan units. Prediction rule CLABSI counts and reference standard CLABSI counts were multiplied by the sampling weight for the unit location to generate population-level numerators. In-plan central vascular catheter–days from NHSN were used for the denominator for incidence measures. Measures were plotted on funnel plots to compare rates while simultaneously accounting for at-risk days.Reference Rakow, Wright, Spiegelhalter and Bull 15 , Reference Schulman, Spiegelhalter and Parry 16
Institutional Review Board Waivers
This project was an evaluation of surveillance approaches in previously collected data; as such the CDC and the Cook County Health and Hospitals System institutional review boards both waived the need for informed consent. The protocol was submitted by Premier to a shared institutional review board for the project and informed consent was waived.
RESULTS
Sampling and Reviews
Among 41 eligible acute care facilities, 21 expressed initial interest;16 completed an initial survey, and 14 (from 12 states) enrolled. The median (range) hospital size was 572 (154–909) beds; 11 of the 14 were Association of American Medical College members. Prior to sampling, episodes (n=4,083) were most commonly from WARD locations (WARD, 2,185 [54%]; medical ICU, 642 [16%]; surgical ICU, 561 [14%]; hematology unit, 484 [12%]; medical-surgical ICU, 211 [5%]). Among the 2,185 WARD episodes, 1,617 (74%) were from medical wards, 547 (25%) were from surgical wards, and 21 (1%) were from obstetrics-gynecologic wards.
After sampling of all bacteremia episodes, 1,027 episodes (1,343 isolates) were captured with similar distributions in all units except for medical-surgical ICU (21% medical ICU; 22% each from surgical ICU, hematology unit, and WARD; and 13% medical-surgical ICU). Among episodes, a total of 126 species were isolated; the range of episodes per hospital was 30 to 149. Of the 1,027 episodes, 235 (23%) were polymicrobial (mean number of isolates per polymicrobial episode, 2.3). The most common organism groups were Enterococcus spp. (18%), S. aureus (13%), yeast (12%), and common skin commensals (12%).
Reviewer 1 conducted reviews of 1,009 episodes (1,319 isolates) while reviewer 2 reviewed 1,026 episodes (1,341 isolates). A total of 127 episode reviews were discrepant between reviewer 1 and 2. Of these, 74 (58%) were given a third review and included in the analysis. In total, 89 (9%) and 97 (9%) of reviewer 1’s and reviewer 2’s episodes, respectively, were CLABSIs.
Regression Models and Calibration
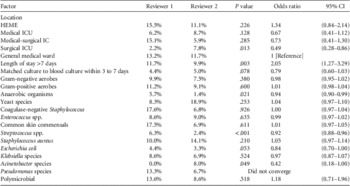
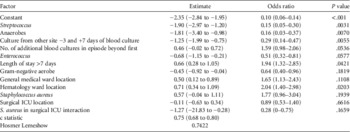
Results of univariate and multivariate analyses are shown in Tables 1 and 2 and the online supplementary material. Four relevant models are presented in the online supplementary material; however, the final model, based on presence of statistical significance and biological plausibility, was utilized. Associations between location, organism, and non–blood culture sites with CLABSI were found (Table 2).
Comparison of Characteristics Related to Episodes of Central Line–Associated Bloodstream Infections (CLABSI), by Reviewer

NOTE. Percentages represent CLABSI prevalence for listed risk factor. P values, odds ratios, and 95% CIs were obtained in univariate analyses, with presence of CLABSI as judged by the reviewers used as the outcome variable. Analyses were done using the generalized estimated equation. Location was analyzed as a categorical variable with general medical ward as a reference group, while other factors used the absence of the factor as a comparison group. HEME, hematology specialty care unit; ICU, intensive care unit.
Independent Predictors of Central Line–Associated Bloodstream Infections Among Bacteremia Episodes in the Presence of a Central Line

NOTE. ICU, intensive care unit.
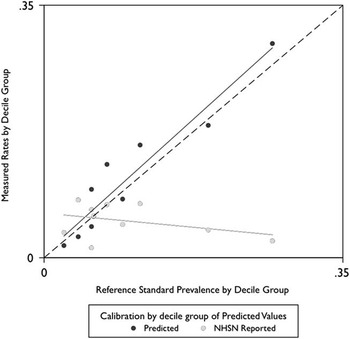
Model calibration for in-plan months is shown in Figure 1 and compares the measured prevalence rates obtained through NHSN-reported data and from the prediction model to the reference standard CLABSI prevalence rate. When reviewed CLABSI episodes were linked with NHSN-reported events for in-plan months and model-generated rates, the calibration of the model-predicted probabilities showed better performance than the NHSN data, with the poorest IP performance at the highest rates !of CLABSI. For the predicted probability calibration curves, the Hosmer-Lemeshow test for goodness of fit was nonsignificant for all models.
Model calibration, prediction algorithm, and National Healthcare Safety Network (NHSN) measurement vs reference standard prevalence. Data grouped by decile of predicted probabilities.

Predicted vs Observed CLABSI Incidence
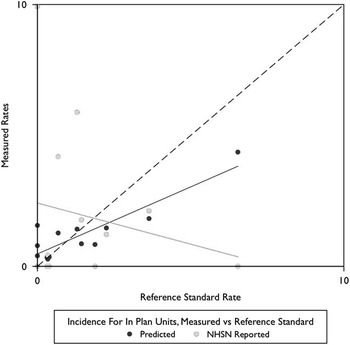
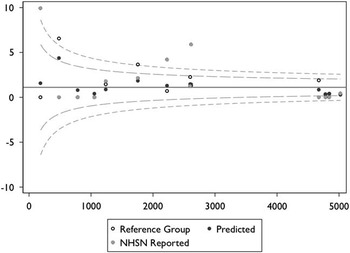
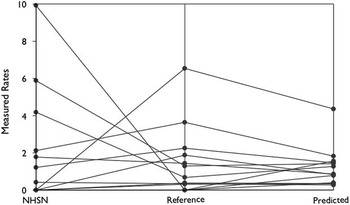
The measured rates for incidence as reported by IPs to NHSN and as generated by the prediction model were compared with the reference standard (Figure 2). Regression models in all 4 models showed a positive slope and calibration closer to identity than the IP reviews, which demonstrated a negative slope. When plotted in a funnel plot (Figure 3), outlier rates were missed in 2 instances by the NHSN reviews and predicted rates, and they were falsely elevated 3 times in NHSN-reported rates, but in no cases by the predictive model. A paired coordinate plot (Figure 4) showed a wider distribution of rates and more changes in rank for IP reviews than the predictive model compared with the reference standard.
A comparison of predicted vs National Healthcare Safety Network (NHSN) reported central line–associated bloodstream infection incidence rates, compared with the reference standard.

Funnel plots comparing predicted rates (y-axis) and National Healthcare Safety Network (NHSN) rates (events/1,000 central vascular catheter–days) vs central vascular catheter–days (x-axis). Confidence intervals are Poisson 95% and 97.5% confidence intervals around mean reference standard central line–associated bloodstream infection rate. False-positive outliers are filled circles outside of upper confidence interval.

Paired coordinate plot comparing infection preventionist reviews and predicted rates with reference standard rates. NHSN, National Healthcare Safety Network.

DISCUSSION
In this multicenter evaluation of almost 100 CLABSI events among 1,027 unique bacteremia episodes from 14 hospitals, the use of a regression model based on the clinical characteristics of the bacteremia outperformed traditional IP surveillance compared with an expert-derived reference standard. By using a reference standard composed of multiple reviews of the same event and using probability scores that were added up for a unit across periods, the uncertainty associated with individual putative CLABSI events was modeled and expressed as the measure of events. This approach enabled a total rate to be estimated using easily obtainable data from the electronic record (eg, location of bloodstream infection origin, organism name, length of stay, and increasingly, presence of a central vascular catheter), potentially allowing complete automation based on the characteristics of the organism of infection, the patient, and the location of event.
Variability in CLABSI reporting may be due to bias or uncertainty. Bias may occur when local reporting workflows vary between institutions (eg, clinician review in some facilities vs independent IP surveillance). Uncertainty may occur when a lack of information in the record, or ambiguity in application of surveillance definitions, prevents a true determination of the presence of CLABSI. The evaluation suggested the presence of uncertainty: agreement in the application of surveillance criteria was imperfect in 127 episodes (12%), requiring a third review. The highest rates of discordance were noted in the hematology unit for yeast, and in other units, for S. aureus and coagulase-negative staphylococci.
The prediction rule outperformed IP surveillance in multiple areas. First, calibration, as shown in Figure 1, was better for the prediction rule than for NHSN-reported rates. Second, incidence measures from the prediction rule for each in-plan unit showed better calibration compared with the reference standard than the NHSN-reported incidence rates (Figure 2). Third, outlier units with high rates were more accurately detected using the prediction rule than by NHSN-reported rates, with 3 false-positive outlier units erroneously detected by IPs that were not detected by the prediction rule. The evaluation shows the inherent subjectivity in manual chart abstraction–based surveillance methods, and the superiority of more objective, algorithmic approaches, a finding previously observed.Reference Lin, Hota and Khan 7
By including nonbloodstream isolates as a term in the model, the presence of secondary sites of infection (eg, GIT2a, LUNG1, and others) was explicitly modeled. As informatics approaches are developed to process narrative reports (eg, radiology reports using natural language processing), these sources of data may also be incorporated into the model with further validation. Although development of this model used the existing definition of CLABSI at the time and did not exclude mucosal barrier injury–CLABSI, this does not limit the potential of the model. Mucosal barrier injury will mostly be limited to hematology-oncology units, and our model accounts for this location and the uncertainty in ascertaining a secondary gastrointestinal (GI) site such as GIT2c or GIT2d. 17 With ongoing changes in NHSN surveillance criteria, the model should be refined and revalidated.
Although it is recognized that the use of manually reported rates through chart abstraction is an improvement over purely claims-based methods of quality measurement,Reference Panzer, Gitomer, Greene, Webster, Landry and Riccobono 6 challenges have emerged to the current practice of NHSN CLABSI measurement for benchmarking and public reporting. Some examples of the perceived flaws with the current system at the time of model development are problems with the definitions, which did not account for translocation of bowel flora in the setting of chemotherapyReference Sexton, Chen and Anderson 18 ; inherent bias in the reporting workflow, with rewards for less complete reporting by individual health systems and unclear audit requirementsReference Sexton, Chen, Moehring, Thacker and Anderson 14 ; and greater variability between centers in human NHSN reporting compared with a purely algorithmic method, which could impact benchmarked rates.Reference Lin, Hota and Khan 7 The CDC has addressed many of these challenges, including the addition of a mucosal barrier injury indicator; but an additional concern is the time and personnel requirement needed for increasing reporting requirements by healthcare systems.
Several limitations of this electronic algorithmic approach should be noted. First, small samples of data can introduce greater uncertainty around the estimates from the prediction model. To address this issue, we examined the data using funnel plots; the prediction model performed better than NHSN manual reviews, with less dramatic fluctuations of rates. Second, this approach requires a data cleaning component (ie, data deduplication and classification of microorganisms into major categories) and knowledge of the presence of a central line in patients. With increasing adoption of electronic health record systems, such data and processing capability should become more broadly available, though addition of relevant metadata to laboratory information systems to classify microorganisms properly will be essential.
The introduction of better measurement methods has the potential to transform the practice of infection prevention. Currently, manual approaches are limited by measurement error and high time requirements, taking resources from activities more directly involved in prevention. Increased automation of measurement is more reliable, more objective, and more efficient than manual approaches. Use of more granular clinical data may yield a streamlined approach to the measurement of CLABSIs, freeing resources for more effective preventive activities. The CDC is working with partners to refine algorithms using data available in electronic medical records for the surveillance of healthcare-associated infections using the NHSN.
ACKNOWLEDGMENTS
We thank Jonathan Edwards and Yi Mu for their analytic contributions to the development of this manuscript.
Financial support. Cooperative agreement between the CDC and the Chicago Antimicrobial Resistance and Infection Prevention Epicenter (Cook County Health & Hospital System and Rush University Medical Center), part of the CDC’s Prevention Epicenters Program (W.T., B.H.); CDC contractual support with University Research (contract GS-10F-0182T) for expert medical chart reviews.
Potential conflicts of interest. All authors report no conflicts of interest relevant to this article.
SUPPLEMENTARY MATERIAL
To view supplementary material for this article, please visit http://dx.doi.org/10.1017/ice.2015.255.