


The conflict literature has made significant progress in understanding which countries are more at risk of suffering an armed conflict.Footnote 1 However, many factors that have been identified as leading to increased risk, like mountainous terrain or ethnic polarization, are time invariant or very slow moving, and therefore not useful in predicting the timing of conflict. Other factors, like GDP levels or political institutions, still vary more between countries than within countries over time. This means it is easier to predict whether a country is at risk in general rather than when a country is particularly at risk. Yet, understanding the timing of conflict is critical for policy.
An additional problem of forecasting the timing of armed conflict is that it is rare and at the same time relatively concentrated in some countries. This is problematic because it implies that the variation between countries can dominate the analysis unless the between- and within-country variations are separated explicitly. Empirical models that are overall quite accurate can therefore be of little use on the time dimension. We show, using a simple panel regression model, that many variables commonly used in the literature indeed face this problem. This means they predict conflict where it occurred before, and therefore fail to predict conflicts in previously peaceful countries.
As a solution to this problem, we propose data generated from news sources. To this end, we implement an automated method to quantify the content of news using the latent Dirichlet allocation (LDA) model (Blei, Ng, and Jordan Reference Blei, Ng and Jordan2003), which we apply to over 700,000 newspaper articles from English-speaking newspapers. There are two advantages that topics have over existing methods of analyzing text. First, topics provide depth because, by design, they put words into context. The context can be useful for forecasting. Second, topics provide width because they allow us to use the whole text, including stabilizing factors, when forecasting conflict. This means we can let the data speak without losing interpretability of the results.
At the prediction stage, we rely on a simple panel regression model, which uses all generated topics as explanatory variables. The result is a model able to forecast out of sample the onset of civil war, armed conflict, and even movements of refugees a year before they occur. It relies entirely on news text and can therefore provide forecasts without the need to extrapolate or wait for other data sources. Furthermore, the procedure can be implemented with only minimal personal judgment and appears to generate consistent summaries of text, which could be used in other applications as well.
Our empirical methodology proceeds in three steps. We first download newspaper articles and collect words and series of words, referred to as tokens, in one vector for each article. Newspapers have the advantage that they stretch several decades and report on events in all countries, which means that even rare events are sufficiently common to be analyzed with quantitative methods. We downloaded all articles on 185 countries from the New York Times (NYT), the Washington Post (WP), and the Economist for all available years since 1975. This gives us a basis of 700,000 newspaper articles with a little less than one million unique word combinations, even after excluding stop words, rare words, and stemming.
As a second step, we develop a topic model tailored for the purpose of summarizing the content of news reports in a country and year. We use the LDA model to generate quantitative summaries of the articles. In this way, the high dimensionality of token vectors (0.9 million) can be decreased to as many topics as we choose. The main advantage of this methodology is that we do not need to impose any judgment on which part of the text is important when predicting conflict—we can let the data speak.
As the final step, we use the within-country variation, that is, the emergence and disappearance of topics on the country level, to predict conflict out of sample. For this step, we calculate the share of words written on each topic in every country and year. We then use these topic shares in a country fixed-effects regression to predict the onset of conflict in the following year. We show that reporting on specific topics increases before conflict, whereas reporting on other specific topics decreases. In this way, the timing of conflict can be forecasted more accurately than through variables previously used by the literature. In addition, topics are meaningful and can therefore help us understand predictors of (in)stability.
We show that forecasts relying on the overall variation, even if they were estimated with fixed effects, introduce a bias against new onsets of conflict in previously peaceful countries. Methods which rely on the overall variation will therefore tend to attribute low risk to countries which have not experienced an onset in the past—even if the within-country variation would indicate high risk. Since our topics provide a lot of useful within-country variation, they can provide early warning for countries that did not experience a conflict onset in the sample used to train the model. This is an important difference to standard methods.
We use a stepwise selection method to explore why the estimated topics provide such strong predictive power. First, topics rely on a long list of terms that co-occur. The algorithm that generates topics learns, for example, that specific nonconflict words are associated with conflict words. Topics with a conflict content can then add forecasting power beyond conflict indicators, conflict events, and conflict keyword counts. Second, the model uses several negative associations between topics and conflict. A lot of the forecasting power is maintained even if only these nonconflict topics are used for the forecast. The fact that our forecast relies so heavily on negative correlations means that (the absence of) stabilizing factors could be key to understanding the timing of conflict, even in new outbreaks. We find, for example, that news that describes judicial procedures systematically decreases before conflict occurs.
We proceed as follows. We first discuss related literature, then we present a way to evaluate the ability of a model to forecast the timing of conflict before we present our methodology of aggregating news text into topics followed by the main results. Next we demonstrate the close link between predicting the timing of conflict and predicting new, otherwise unforeseen conflicts. Finally, we explore why the topic model provides such useful forecasts of the timing before we conclude.
Related Literature
The academic literature has made large strides towards understanding the triggers of civil conflict. A part of the literature has focused on establishing links to specific factors such as ethnic cleavages (Reynal-Querol and Montalvo Reference Reynal-Querol and Montalvo2005; Esteban, Mayoral, and Ray Reference Esteban, Mayoral and Ray2012; Caselli and Coleman Reference Caselli and Coleman2013), climate (Miguel, Satyanath, and Sergenti Reference Miguel, Satyanath and Sergenti2004; Dell, Jones, and Olken Reference Dell, Jones and Olken2012; Buhaug et al. Reference Buhaug, Nordkvelle, Bernauer, Böhmelt, Brzoska, Busby, Ciccone, Fjelde, Gartzke and Gleditsch2014), or natural resources (Brückner and Ciccone Reference Brückner and Ciccone2010; Bazzi and Blattman Reference Bazzi and Blattman2014). This literature is more concerned with causal identification and less with forecasting power. Another part of the literature has looked at using a mix of political and economic indicators to explain conflict (e.g., Fearon and Laitin Reference Fearon and Laitin2003; Collier and Hoeffler Reference Collier and Hoeffler2004; Collier, Hoeffler, and Rohner Reference Collier, Hoeffler and Rohner2009; Gleditsch and Ruggeri Reference Gleditsch and Ruggeri2010; Besley and Persson Reference Besley and Persson2011a). For a review of this literature, see Blattman and Miguel (Reference Blattman and Miguel2010).
Naturally, the forecasting literature started with relying on structural factors in forecasting.Footnote 2 An exhaustive review of this growing literature is beyond the scope of this article. For an overview, see Schrodt, Yonamine, and Bagozzi (Reference Schrodt, Yonamine and Bagozzi2013), Ward et al. (Reference Ward, Metternich, Dorff, Gallop, Hollenbach, Schultz and Weschle2013), and Hegre et al. (Reference Hegre, Metternich, Nygård and Wucherpfennig2017). In what follows, we will therefore focus on the use of country fixed effects and newspaper text in forecasting.
Country fixed effects are typically absent in the forecasting literature, which explains why slow-moving, structural variables typically play such an important role in forecasting. Rost, Schneider, and Kleibl (Reference Rost, Schneider and Kleibl2009), for example, use cross-sectional logit regressions on economic and political variables as well as proxies for violations of human rights to predict conflict onset within a five-year window. They find substantial predictive power of their model within this time frame. Goldstone et al. (Reference Goldstone, Bates, Epstein, Gurr, Lustik, Marshall, Ulfelder and Woodward2010) provide predictions of political instability at the country level within a two-year horizon. Their statistical method compares country-years before instability to country-years in the same region that were not followed by onset. Their main finding is that the best predictors of instability are slow-moving variables such as political institutions or infant mortality. Hegre et al. (Reference Hegre, Karlsen, Nygård, Strand and Urdal2013) forecast conflict for the period 2010–2050 using a combination of variables such as population, infant mortality, and education.
News text has been used extensively to predict conflict. Brandt, Freeman, and Schrodt (Reference Brandt, Freeman and Schrodt2011), for example, use the Conflict and Mediation Event Observations (CAMEO) coding scheme in their analysis of news sources when defining conflict events in the Levant. CAMEO uses dictionaries of verbs and actors developed over a decade in several large research projects to identify events and the involved parties in these events.Footnote 3 Many modern applications such as the Global Data on Events, Location and Tone (GDELT) or Integrated Conflict Early Warning System (ICEWS) rely on such coding rules to automatically extract events from text in real time. Most closely related to our article is Ward et al. (Reference Ward, Metternich, Dorff, Gallop, Hollenbach, Schultz and Weschle2013), who use a combination of event data based on ICEWS. Their model has a striking degree of accuracy in predicting civil war incidence (occurrence) and performs well out of sample. A simpler way to forecast conflict with text is proposed by Chadefaux (Reference Chadefaux2014), who relies on keyword counts of a list of predetermined words to construct an index of tension on a weekly basis for the period 1902 to 2001. He uses the constructed tension data to predict onset of conflict weeks before it occurs, and shows that news data can contribute significantly to a standard model. Most recently, Chiba and Gleditsch (Reference Chiba and Gleditsch2017) combined structural and event data to forecast civil war on the monthly level in a logit framework without fixed effects. A lot of their forecasting power comes from constant slow-moving variables such as ethnic fractionalization, GDP per capita, or population. The within- and out-of-sample gains of adding conflict events is relatively modest. This is an interesting contradiction to the findings in Ward et al. (Reference Ward, Metternich, Dorff, Gallop, Hollenbach, Schultz and Weschle2013), which might be explained by use of country fixed effects in the latter.
We add to the forecasting literature in two ways. First, an important conceptual contribution of this project is that we explicitly separate the within-country from the between-country variation before forecasting. We do this by running linear fixed effects regressions and then relying on the within model to forecast. To the best of our knowledge, no paper in the existing literature has tried to separate within and between variation this way.Footnote 4 Second, we use a topic model to automatically summarize all news text in a few variables. Our forecasting model can therefore rely on the complexity of the entire newspaper text written on each country and we demonstrate that this has some benefits.
However, our approach comes at the cost of requiring the entire text of articles instead of relying on search queries only. In addition, we try to forecast rare events which implies that we need news sources that are consistently available for decades. We use three newspapers which leave us with a little more than 700,000 articles and prevents us from trying to predict conflict at the quarterly or even monthly level. We therefore see our approach as complementary to Ward et al. (Reference Ward, Metternich, Dorff, Gallop, Hollenbach, Schultz and Weschle2013) and Chadefaux (Reference Chadefaux2014). Ward et al. (Reference Ward, Metternich, Dorff, Gallop, Hollenbach, Schultz and Weschle2013) use event data constructed from more than 30 million news stories while Chadefaux (Reference Chadefaux2014) searches keywords in over 60 million pages of news text.
Quinn et al. (Reference Quinn, Monroe, Colaresi, Crespin and Radev2010) use a topic model, in which documents are assigned only a single topic, to categorize over 100,000 speeches in the U.S. congress. They estimate their topic model of 42 topics to show that topics can be used to analyze democratic agenda dynamics over a long time period. Topics generated by LDA have also been used by Hansen, McMahon, and Prat (Reference Hansen, McMahon and Prat2014) to quantify discussions in the central bank committee of the Bank of England. We contribute to this literature by applying the topic model to newspaper text, which spans large cross-country panels.
FORECASTING THE TIMING OF CONFLICT
In this section, we present a method to evaluate the ability of a model to forecast the timing of conflict. We do this in three steps. First, we explain the basic problem of forecasting the timing in a stylized example. Second, we present a method to circumvent this problem. Third, we use this method to evaluate five empirical models of conflict taken from the literature.
The Problem of Forecasting the Timing of Conflict
It is a well-known fact in the conflict literature that rich countries with strong political institutions are less likely to enter conflict than poor countries with weak institutions. A simple way to forecast conflict would therefore be to attribute a higher risk of conflict to poor countries with weak institutions. However, to make conclusions from such a model about how marginal changes in income or institutions affect stability requires a leap of faith. The required leap of faith is that the variation between countries, the between variation, is useful to forecast the variation within countries across time, the within variation. But this is not always true.
As a stylized example, take the standard democracy score from Polity IV (polity2), which is meant to capture the level of democratization in a country. If one runs a regression of civil war onset in year t + 1 on polity2 in year t, one gets a significant, negative relationship. Countries that are more democratic tend to be less at risk of experiencing a conflict the following year. However, if one uses this estimated relationship to look within countries, one gets a falling likelihood of conflict as conflict approaches. In other words, the overall model marks countries as relatively safe right before they experience an outbreak of armed conflict.Footnote 5
This example only serves as an illustration. The literature typically adds controls and uses a nonmonotonous relationship between civil war and democracy.Footnote 6 But the problem could be relevant in more sophisticated applications as well. For example, a commonly used fragility index, the Fragility Index of the Fund for Peace, relies on many more factors but was still falling in Syria, Libya, and Egypt right before these countries experienced dramatic outbursts of violence in 2011.
A textbook solution to this problem is the use of country fixed effects, but we will show in this section that when forecasting out of sample, the problem goes further. Even if a fixed-effect model is used, the within variation might not contribute to the forecast if the estimated fixed effects are included. Relative to the magnitude of the fixed effect, the within variation is relatively subtle and so the “signal” contained in it is not visible when forecasting out of sample. Accordingly, it might happen to be impossible to predict new developments, that is, onsets in previously peaceful countries or stability in violent countries.
Out-of-Sample Evaluation of Forecasts
We now present a method to evaluate the ability of a model to forecast the onset of conflict. Our starting point is the perspective a policymaker could have. On December 31 of year T, the policymaker is interested in where conflict might break out in the following year. This procedure has two steps; first, the policymaker trains a model using all information available up until year T; second, once the training is completed, the policymaker uses the trained model and data in T to produce forecasts for T + 1.
In the first step, we distinguish between the overall model, which contains the entire model including the estimated fixed effects, and the within model, which disregards the baseline risk contained in the fixed effects. For example, to test whether the democracy index polity2it contains useful within variation for a forecast we would run a regression of the form
 $$\begin{equation*}
y_{it+1}=\alpha +\beta _{i}+polity2_{it}\cdot \beta ^{FE}+\varepsilon _{it},
\end{equation*}$$
where y it + 1 is conflict onset in t + 1 and βi are a full set of country dummies.Footnote 7 The linear fixed-effects model allows us to separate the between variation contained in the βi from the useful time variation contained in the within fitted values,  $polity2_{it}\cdot \hat{\beta }^{FE}$.
In the second step, the two sets of fitted values in T are used to produce forecasts for T + 1. The fitted values are converted into a binary forecast, that is, negative for peace or positive for onset of conflict, depending on whether the fitted value is above a cutoff c or not. These negatives and positives can then be evaluated with the actual realizations of onset.
These two steps are repeated every year to get an impression of the ability of the model to forecast conflict. In our main application, we let T go from 1995 to 2013 and implement the above steps for all years in between. This means we first predict the onset of conflict in 1996 with information available in 1995. We then predict onset in 1997 with all information available in 1996 and so forth. To evaluate the forecasting power of our model, we collect all out-of-sample predictions and pool them for evaluation. This makes sure that the evaluation is conducted with a common cutoff, which could therefore also be used to forecast an unknown future, based on the performance in the past.
The key trade-off that a policymaker faces when deciding on the right cutoff c is between false negatives, outbreaks of conflict with a negative forecast, and false positives, positive forecasts without onset. If a policymaker chooses a high cutoff, there will be fewer positives and therefore also less false positives. However, the forecast will miss more actual outbreaks of conflict, that is, it will generate more false negatives. If the policymaker instead chooses to warn in all countries, then she will be able to have no false negatives but a lot of false positives.
This trade-off can be shown in receiver operating characteristic (ROC) curves, which visualize the performance of the model for all possible cutoffs c. In the figures containing ROC curves (e.g., Figure 1), we report the true positive rate (TPR) on the y axis. The TPR is given by the formula
 $$\begin{equation*}
TPR_{c}=\frac{TP_{c}}{FN_{c}+TP_{c}},
\end{equation*}$$
and is a measure of how many false negatives (FN c) are generated for a given level of true positives (TP c). We want this measure to be as close to 1 as possible, which would indicate that all conflict onsets have been spotted correctly without missing a single one, that is, with FN c = 0.
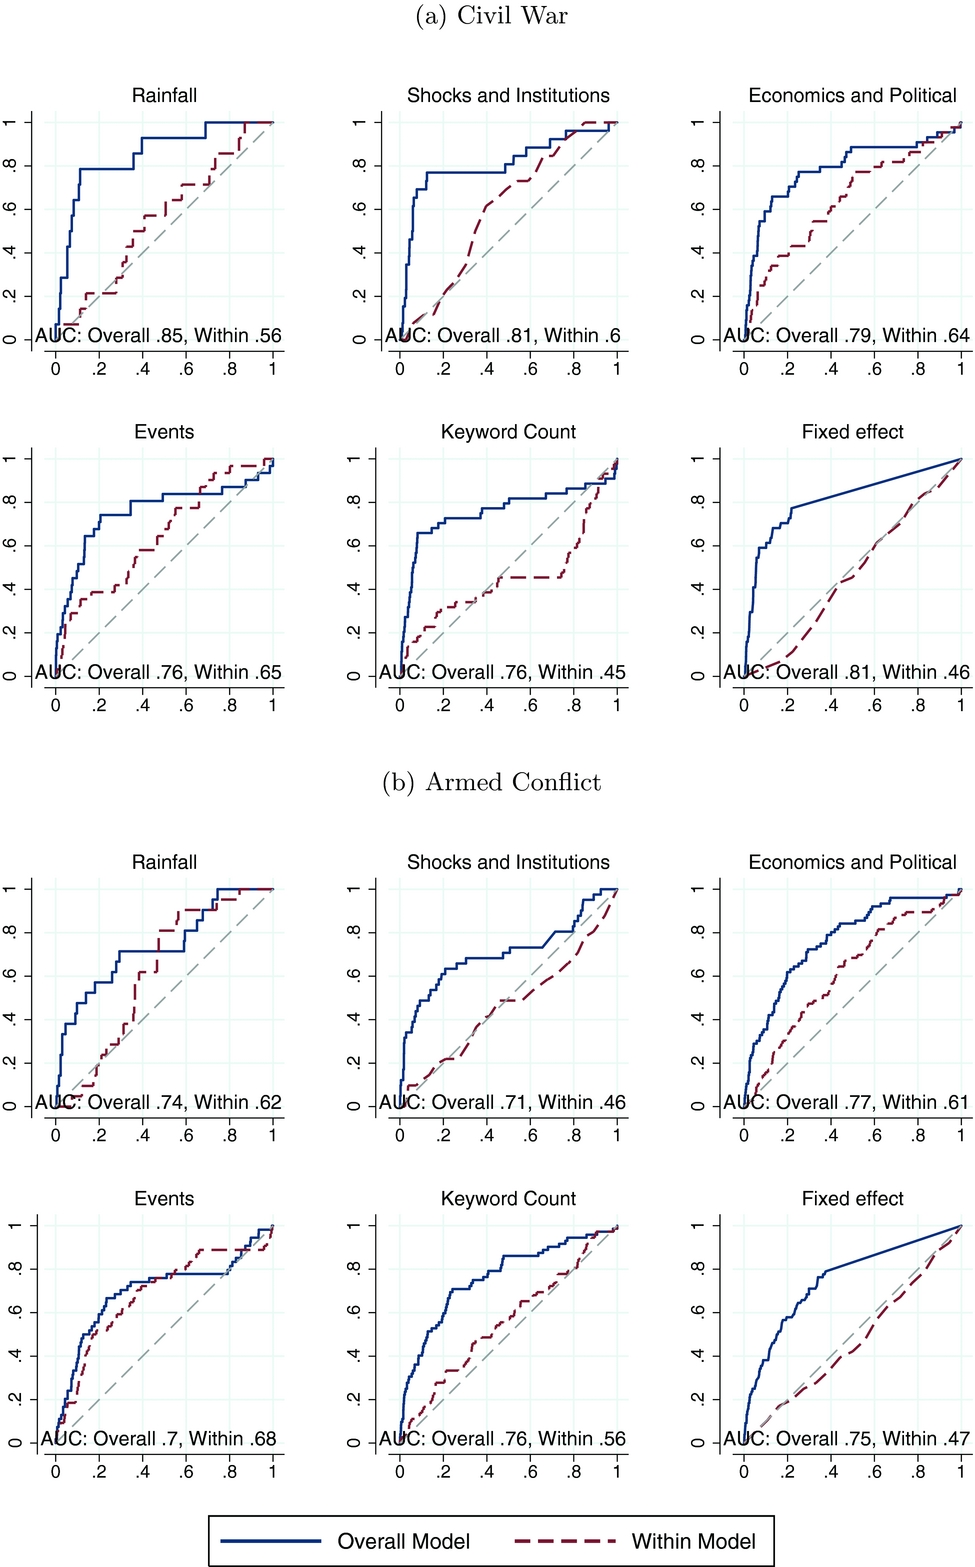
ROC Curves for Onset (X Axis: FPR, Y Axis: TPR)

The false positive rate (FPR) is reported on the x axis of Figure 1. It is given by the formula
 $$\begin{equation*}
FPR_{c}=\frac{FP_{c}}{FP_{c}+TN_{c}},
\end{equation*}$$
and is a measure of how many false positives (FP c) are generated for a given level of true negatives (TN c). We want this to be as low as possible. Optimally, we would want no false warnings, that is, FP c = 0. The 45-degree line in ROC curves is the benchmark that would be reached by random forecasts. For each ROC curve we also report the area under the curve (AUC).
There are some problems associated with the linear fixed-effects model and a broad academic debate has brought pro- and counterarguments for its adoption (Beck Reference Beck2015). We nonetheless choose the linear model for several reasons. First, because we are forecasting, we are not interested in the precision or even size of the estimated coefficients and, due to our focus on ranking forecasts, we do not mind that the fitted values from the model are not bound between zero and one. Instead, we can simply rely on showing that our model is able to produce useful rankings when forecasting out of sample. This deflates both of the main arguments against the use of a linear model.
The key in our application is, however, that within and between variation are additive in the linear model so that we can use the within fitted values alone in forecasting. This is a crucial difference to the fixed effect logit model, for example. The logit model estimates a set of fixed effects but drops all time series that have no variation in y it + 1, that is, all countries which were always or never in conflict. In addition, it is unclear how one would separate the within variation contained in a logit model to use them separately in forecasting.Footnote 8
An Evaluation of Standard Models
We now illustrate that isolating the within variation from the between variation (which together form the overall model) can yield fundamental insights regarding how precisely a model predicts the timing of conflict out of sample. We do this by applying the method described in the previous section to five different models from recent publications in economics and political science shown to explain conflict onset and in some cases even forecast it. We discuss the details of the five models in the Online Appendix C.Footnote 9
First, we use a model of rainfall shocks in Africa. Second, we use foreign aid shocks and income shocks interacted with the country’s institutional environment. Third, we use a combination of standard economic and political variables. Fourth, we use a mixture of Integrated Crisis Early Warning System (ICEWS) event data and economic and political data. Fifth, we use a model of conflict word counts based on our articles together with measures of conflict history and political institutions. Finally, we add a model in which we regress conflict on country fixed effects only, that is, we do not even try to predict the timing of conflict but rely instead on the simple logic that onset will occur where it occurred before. This model should, by definition, have no useful within variation.
In all six models, we predict armed conflict and civil war onset as measured by battle-related deaths from the Uppsala Conflict Data Program (UCDP/PRIO).Footnote 10 This includes all battle-related deaths which took place in armed conflict. The UCDP defines an armed conflict as a contested incompatibility that concerns government and/or territory over which the use of armed force between two parties, of which at least one is the government of a state, has resulted in at least 25 battle-related deaths in one calendar year. It also gives four types of conflict—we include battle-related deaths that occurred during internal and internationalized internal armed conflict.Footnote 11
As discussed in the previous section, we evaluate the forecasting performance of the different models using ROC curves. The blue ROC curves in Figure 1 show the performance of the respective overall model, which is what is typically reported in the forecasting literature. To illustrate, take the forecast of civil war of the “Economics and Politics” overall model in Figure 1(a). It reaches a TPR of around 70% for an FPR of 20% when predicting civil war. This means that the model correctly forecasts 70% of all civil war outbreaks while only marking 20% of peaceful years as under conflict risk. The AUC is almost 0.8, which is comparable to the findings in the literature. When predicting armed conflict in Figure 1(b), the model does a little worse. The blue ROC curve stretches out more in Figure 1(a) than in Figure 1(b), and the reported AUC is higher. Generally, forecasting civil wars in Figure 1(a) seems to be easier than forecasting armed conflict in Figure 1(b).
We then test how much of this forecasting power is maintained when looking at the within variation alone. The performance of this forecast is reported as a red dashed line in Figure 1. Almost all models show a dramatic decline in forecasting power from the overall model to the within model. This indicates that most overall models receive their forecasting power from the between variation. Notable exceptions are the model based on political and economic variables, which always retains at least some forecasting power, and the model based on events, which retains almost all of its forecasting power when predicting armed conflict. The latter finding suggests that using news text can provide a useful source of variation when predicting the timing of conflict.
Note also that the model with only country fixed effects performs as well as most other overall models. This confirms that it is possible to gain fairly good forecasts by assuming that conflict breaks out where it broke out before. However, in many applications, this is not satisfactory and leads to forecasting mistakes if peaceful countries destabilize or violent countries stabilize.
A TOPIC MODEL OF NEWSPAPER TEXT
This section discusses the news reports we rely on and how they can be summarized with the help of a topic model. We also report on the content of the estimated topics.
News Text
The first choice we face is the selection of our news sources. Due to their availability over a long time span and international coverage, we focus on three major newspapers published in English, namely the Economist (available from 1975), the NYT (available from 1980), and the WP (available from 1977). From the database LexisNexis, we downloaded all articles dating from January 1975 to December 2015 containing country names (or slight permutations thereof) or capital names in the title.Footnote 12 In total, we downloaded more than 700,000 articles, of which 174,450 are from the Economist, 363,275 from the NYT, and 185,523 from the WP. The distribution of the number of articles over time is exhibited in Figure 2.
Number of Articles by News Source Over Time

On average, about 120 articles are written on a country in a given year. However, the extent of coverage varies drastically so that we observe between one and more than 5,500 articles in a given year. As a general idea, more populous, richer and more democratic countries are covered more. In addition, coverage increases in and before conflict. On average, a conflict year is covered with about 100 articles more, while a preconflict year is covered with almost 70 articles more than the average year. However, our methodology accounts for changes in coverage by using topic shares, that is, we disregard how much is written on a country and focus instead on what is written on a country, as it facilitates forecasting across countries.
To improve the performance of our machine learning algorithm, we process the raw text of articles of all three newspapers according to standard text-mining procedures.Footnote 13 First, we remove a library of common words, which in text mining are referred to as stop words, such as “to” or “that.” Second, we lemmatize and then stem words using the Snowball algorithm, which is an updated version of the algorithm from Porter (Reference Porter1980).Footnote 14 Lemmatizing group’s distinct forms of the same word into one word, while stemming attempts to harmonize different usages of one word, such that, for example, “running,” “ran,” and “run” all become “run.” However, unlike the example, the outcome does not necessarily represent an English word. This leaves us with more than 5.5 million unique tokens, which are not only single words, but also tokens of sequences of two words and three words, referred to as bigrams and trigrams, respectively. Then, as a final step, we remove overly frequent and rare tokens, and are left with around 0.9 million tokens. This high dimensionality makes it impossible to use the token vectors in standard regressions. Here is where the literature has typically reduced dimensionality by focusing on particular words.
LDA Topic Models
To reduce the high dimensionality of our dataset, we use the LDA to model topics, a method introduced by Blei, Ng, and Jordan (Reference Blei, Ng and Jordan2003). Topics are probability distributions over words. The LDA model in text analysis assumes that each document is a mixture of a small number of topics and that each word’s creation is attributable to one of the document’s topics.
The exercise consists of splitting each article into topics k. One can imagine a journalist writing about a topic will use a combination of words related to that topic. For instance, an article about sports might be more likely to contain words such as “football,” “win,” “fans,” and “game,” whereas an article about a conflict might be more likely to use words such as “violence,” “casualties,” and “soldier.” Through Bayesian learning, the algorithm optimizes the weighted word lists, that is, the topics, to discriminate between articles. For instance, the word “game” might be more of a sports-topic word and, therefore, indicates that an article is on sports. Ultimately, the mixed-membership model represents each document as a set of shares of topics. One could imagine that an article is classified as 70% sports and 30% conflict if a particularly violent soccer match took place. While the number of topics K is prespecified, the content of the topics is not. The topics are identified by looking at which tokens co-occur in articles.
The LDA model requires just three parameter assumptions and can be implemented with a Gibbs sampling technique that we adapt from Phan and Nguyen (Reference Phan and Nguyen2007). In Appendix D, we provide a technical discussion of the LDA and the Gibbs sampler. The parameters to choose are α, β, and the number of topics K. High values of α imply that each article is likely to consist of a mix of many topics. Analogously, a high value of β favours a topic to contain a mixture of most words, whereas low values allow topics to consist of a limited number of prominent words. Concerning α and β, we follow the literature. Our preferred specifications, which we will be using for all of the baseline results, is composed of 15 topics and hyperparameters α = 3.33 and β = 0.01.Footnote 15
Topic Estimation Results
To be able to use the estimated topics for out-of-sample forecasting, we need to estimate the model for each sample of text ending in year T. We start training our model on text until T = 1995 and apply it out of sample to predict onset in T + 1 = 1996, so that the first topic model we estimate uses all articles between 1975 and 1995. We estimate one topic model for each consecutive year T ∈ {1995, 1996, . . .2013}, where the last model uses all text from 1975 up to 2013 to predict the last conflict available from UCDP in 2014.Footnote 16
Remember that our K topics are probability distributions over 0.9 million terms. Typically, around 90% of the probability mass in each topic is concentrated in the 10,000 most likely terms and, in Appendix G.1, we show that, while some common terms are shared, each of the topics relies on a different part of the 0.9 million terms. When we look at the most common terms in each topic, it is fairly easy to come up with a title for a topic, that is, in our application to news content, the K estimated topics seem natural and intuitive. For example, in all years, topics appear that we can classify as conflict, sports, tourism, politics, and the economy. By relying on different, large groups of terms, topics provide width for the forecasting exercise. At the same time, the topic model ensures that we can analyze which topics are most useful for the forecast.
In Figure 3, we present four topics when T = 2013, that is, all text from 1975 to 2013, as word clouds of the top 50 terms of the topic. In these clouds, the size of each word is proportional to its likelihood within the corresponding topic. Notice that words are stemmed/lemmatized versions so that “armi,” for example, stands for “army” and “armies.” The two clouds in Figures 3(a) and 3(b) suggest (potential) violence. Terms like “force” and “military” indicate as much. We therefore call these conflict topics. Figure 3(c) seems to summarize processes in the judicial system, indicated by words such as “court” and “case.” The topic in Figure 3(d) seems to describe economics. We refer to topics like these as nonconflict topics.
Word Clouds of Topics

It is important to keep in mind that the tokens shown in these word clouds are only the tip of the iceberg. Topics are a probability distribution over thousands of tokens. The full list of terms associated with the topics in Figure 3, for example, could capture factors that trigger or at least anticipate conflict. In this sense, topics have depth, which could also be useful for forecasting.
The algorithm uses this depth by learning, in each sample, which terms are associated with each other and therefore form a topic. As we move through time, new aspects will be associated with, for example, conflict2 through the co-occurrence that the Gibbs sampler uses to build the topic. In Table 1, we show the change in the top 50 terms for the conflict2 topic between 1995 and 2015.Footnote 17 In column 1, we show the tokens that appear in the top 50 list in both years. These are mostly generic conflict tokens like “force,” “attack,” “army,” “war,” “soldier,” or “guerrilla.” In columns 2 and 3, we show the tokens that only appear in the years 1995 and 2015, respectively. In the year 1995, the terms “unit_nation,” “serb,” “libanes,” and “gulf” were associated with conflict. In the year 2015, these terms are replaced by terms like “terrorist,” “insurg,” “shiit,” and “sunni.” From this change, it becomes clear how the conflict2 topic has adapted to the new international context and surge in asymmetric armed conflicts.Footnote 18 This is an advantage of using a machine learning algorithm to summarize text. Topics allow the specific vocabulary of some countries and events to be put into a broader context.
Word List of Topic conflict2—1995 vs 2015

Note: Table shows the 50 most likely words in the conflict2 topic in 1995 and 2015.
Words are ordered by prominence within topic.
After estimating the topic model, we possess data on the composition of each article m in terms of the K topics, ηm. We aggregate the shares in each article to receive a topic distribution in a country-year, while taking into account the prior probability distribution of topics in the Dirichlet distribution. Call M it the group of articles written in country i and year t. The k × 1 vector of topic shares in country i in year t is then
 $$\begin{eqnarray}
\mathbf {\theta }_{it}=\left(\sum \nolimits _{m\in M_{it}}\mathbf {\eta } _{m}N_{m}+\alpha \right)/\left( \sum \nolimits _{m\in M_{it}}N_{m}+K\alpha \right), \nonumber\\
\end{eqnarray}$$
where  $\sum \nolimits _{m\in M_{it}}N_{m}$ is simply the total number of articles. Note that α enters here as the strength of the prior. If only few words are written in a country-year, then the deviation from this prior will be relatively weak. To use our estimates when forecasting out of sample, we estimate a full panel of topic shares θit for each sample ending in year T ∈ {1995, 1996, . . .2013} separately.
Our use of topic shares alleviates some of the criticism in the literature regarding the use of news as a source of data.Footnote 19 Indeed, as in most other studies of conflict, our left-hand-side variable is based on events that are partly reported by news agencies. However, our predictors rely on content rather than the quantity of reporting. We show in the next section that changes in content can predict changes in reported violence out of sample. Moreover, to illustrate that we are not merely picking up news biases, we also show that we can predict refugee movements, which are collected and reported by local agents directly to the United Nations High Commissioner for Refugees (UNHCR).
PREDICTING CONFLICT WITH NEWSPAPER TOPICS
In this section, we combine the presented forecast evaluation with the topic model. In each year T between 1995 and 2013, we use the text written up until year T to predict conflict in T + 1. We then draw ROC curves to evaluate our forecasts.
In each step, we first estimate a topic model that uses the text written between year 1975 and year T. From the topic model, we obtain the vector of 15 topic shares θit in country i at time t, which we calculate in Equation (1). We then use these shares to train our model with conflicts that happened before T + 1 to predict outbreaks in T + 1.
Formally, we use the trained parameters  $\hat{\alpha },\hat{\beta }_{i}$, and
 $\hat{\beta }^{topics}$ to calculate two sets of fitted values for year T + 1—the overall fitted values
 $$\begin{equation}
\hat{y}_{iT+1}^{overall}=\hat{\alpha }+\hat{\beta }_{i}+\mathbf {\theta }_{iT} \hat{\beta }^{topics},
\end{equation}$$
and the within fitted values
 $$\begin{equation}
\hat{y}_{iT+1}^{within}=\hat{\alpha }+\mathbf {\theta }_{iT}\hat{\beta } ^{topics}.
\end{equation}$$
Using a set of varying cutoffs c and our estimates for  $\hat{y} _{iT+1}^{within}$ and
 $\hat{y}_{iT+1}^{overall}$, we then calculate the TPR c and FPR c for each cutoff c, which we present in standard ROC curves.
Main Results
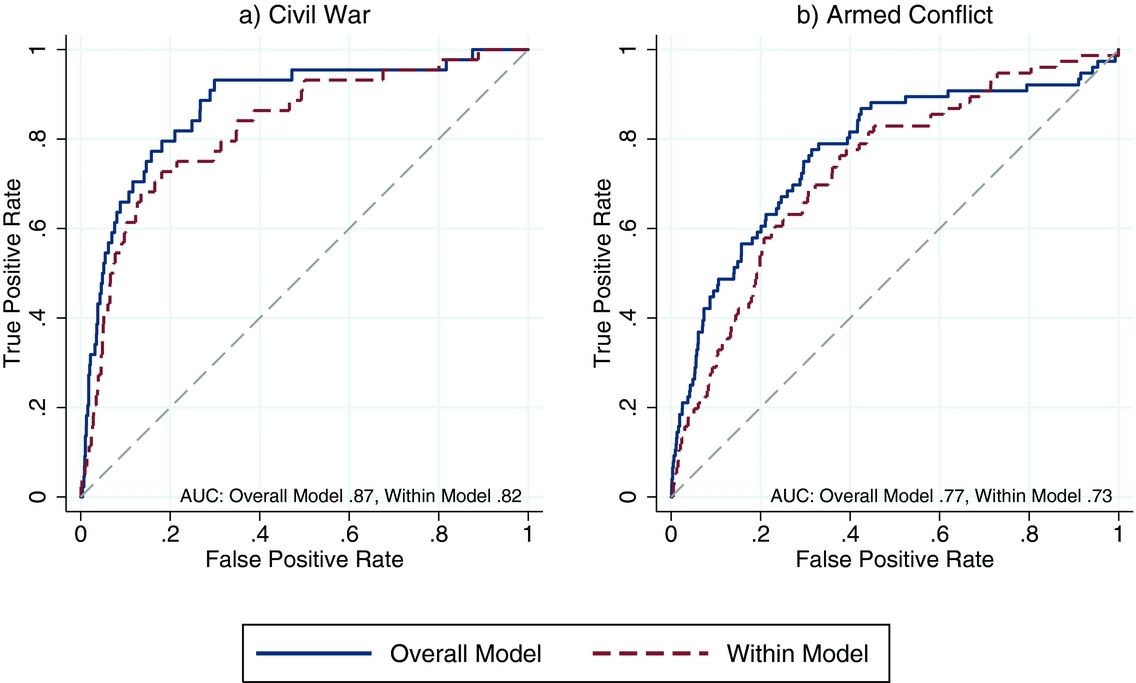
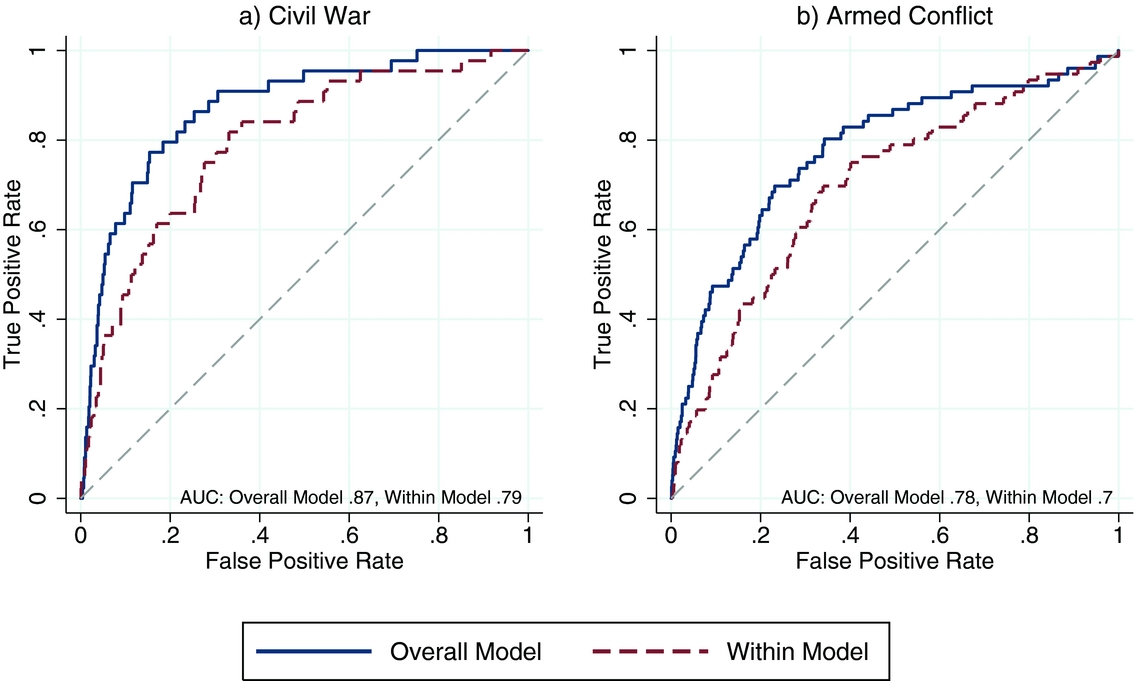
Our main results are shown in the two graphs in Figure 4, which show ROC curves for the onset of civil war (left) and armed conflict (right). The blue solid lines show the forecasting performance using the fitted values from the overall news model  $\hat{y}_{it}^{overall}$ while the red dashed lines provide the ROC curve of the within model
 $\hat{y} _{it}^{within}$.
ROC Curves for Onset (Topics Model)

Figure 4 shows that news topics fare well at predicting onset of both civil war and armed conflict. When predicting civil war onset, the news model generates a TPR of about 80% for a FPR of 20%. Furthermore, the predictive power of the within model is very close to the predictive power of the overall model. This is quite a striking finding given the difficulty of forecasting the timing of such rare events. When predicting the onset of armed conflict the model performs worse. Again, the within variation seems to be an important driver of the ability to forecast conflict. The AUC only drops from 0.87 and 0.77 in the overall model and to 0.82 and 0.73 in the within model for civil war and armed conflict, respectively. This is an important difference to the other models evaluated previously, which suffer a drop of around 20 percentage points of the AUC, as summarized in Appendix Table I.2.
Appendix Figure I.1 draws all ROC curves in one single figure. Given that not all variables are available for the same time intervals, in Appendix Figures I.2 and I.3, we contrast the predictions of our topic model with other models only using overlapping predictions, that is, country-years for which we have predictions for both models. This confirms the impression that similar AUCs of the overall model are consistent with significant differences in performance when predicting the timing of conflict.
Before we turn toward robustness checks, we illustrate the quality of our forecasts. We first show separation plots that order all observations according to the predicted values from the model, and then compare them to the actual realizations of onset. Figure 5 reports four separation plots, one for each of our models. A good forecasting model has a stronger association of onsets (the gray vertical lines) with high fitted values (black curves), that is, we want the gray lines to bunch towards the right. Both in the within and the overall model, there are relatively few observations to the left of the figure.
Separation Plots for Onset (Topics Model)

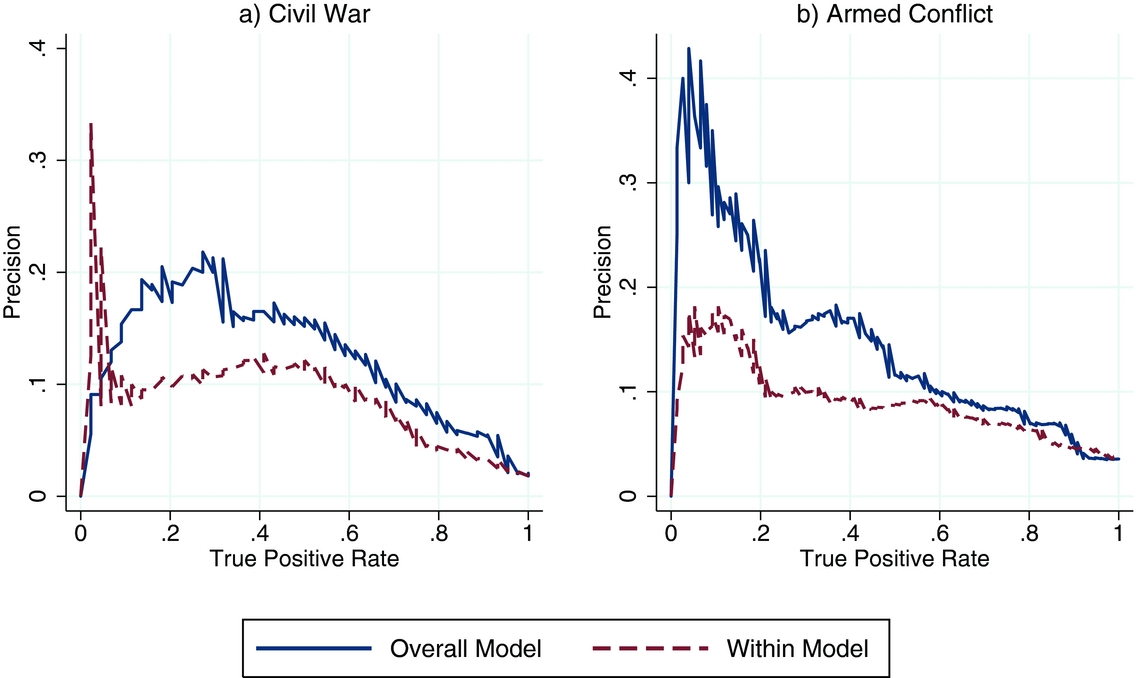
The problem in predicting rare events is that, even a low FPR can mean that many more false positives are generated than true positives. A way to look at this is precision, which relates the number of true positives to the number of false positives. In Figure 6, we report standard precision/recall curves for our forecasts of onset. Generally, the precision of the within model when forecasting onset is around 10%. This would imply that for every ten onsets that are forecasted, one turns out to be true. In the overall model, the ratio is at times twice as high but, as argued before, this is often due to the fact that repeated onsets are forecasted with the fixed effect.
Precision Recall Curves (Topics Model)

We run several robustness checks regarding these basic results. Details and corresponding figures are all reported in Appendix E. First, in Figure E.1, we show that prediction results when using topics for conflict incidence, unsurprisingly, perform even better than for the prediction of onset.
Second, we use more and less topics.Footnote 20 As shown in Figure E.2, with five topics, the forecasting power drops only slightly. With 50 and 70 topics the AUC falls a bit more (see Figures E.3 and E.4). This could be explained by a closer fit of topics to specific situations, which then do not generalize out of sample.
Third, we combine topics with additional information. We show that, building on other existing models, the topic shares add forecasting power. This indicates that it is not simply reporting on basic economic and political facts that helps us forecast. We also test a model in which we augment our topics with standard variables from the literature. There seem to be few benefits from this (see Figure E.5). This result is reassuring for policy applications that need to rely on news data alone because of the delay in release of the standard data. Moreover, we add an indicator for contemporaneous armed conflict incidence to the onset model of civil war to see whether news topics add forecasting power (see Figure E.6). Indeed, topics add forecasting power beyond an already very high benchmark in this model. This also confirms that news topics capture more than the risk of escalating violence. In Appendix Figure E.7, we also show that the model reaches a precision of 25% at a TPR of 50%.
Fourth, we look at a large number of different definitions of conflict finding similar results (see Figures E.8– E.10). We also use our topic model to predict refugee movements using data on refugees from the UNHCR. We predict the onset of a large number of refugees using two different cutoffs, 30,000 and 130,000 refugees, which makes these movements about as common as armed conflict and civil war, respectively. Again, as can be seen in Figure E.11, the within variation has a lot of predictive power, in this case as much or more than the overall model. This exercise underlines the usefulness of news text in providing early warning for events that are not themselves derived by news. We also analyze how well our model performs when forecasting conflict two years before onset. The within model performs only slightly worse (see Figure E.12). Interestingly, the overall model performs very similarly, which confirms the idea that the between variation dominates the overall model. If a forecast is time invariant, it does not matter whether conflict breaks out one or two years later.
Fifth, we break results down by region (Figure E.13) or year (Figures E.14 and E.15), and find that topics consistently perform well, that is, the predictive power of topics is not restricted to any particular geographical region or time period.
Sixth, we contrast our forecasting model with the events used in Ward et al. (Reference Ward, Metternich, Dorff, Gallop, Hollenbach, Schultz and Weschle2013) and conflict keyword counts used in Chadefaux (Reference Chadefaux2014) but now without adding the additional, more standard, variables used in the original articles. If conflict keyword counts would forecast as well as the topics, there would be no reason to go through the more demanding topic estimation. We find that the within variation from the keyword count variables are now useful for predicting the timing of civil war onset (Figures E.16 and E.17). This indicates that the common practice of mixing standard variables with news variables when adding country fixed effects might actually prevent news variables from providing more useful forecasts of the timing of onset. This is typically not visible because only the overall variation is used. We also find that topics still add forecasting power beyond keyword counts and news events. Below, we will discuss why this might be the case.
Seventh, to bridge the gap to the existing machine learning and forecasting literature we also use a neural-networks technique to forecast conflict with topics. The method is described in more detail in the Appendix and results are in Figure E.19. The upshot is that there seem to be only moderate gains from using a neural network for the task at hand, which is in line with the findings by Goldstone et al. (Reference Goldstone, Bates, Epstein, Gurr, Lustik, Marshall, Ulfelder and Woodward2010) who find little improvement when switching to neural networks from simpler regression models.
The main takeaway from all these tests is that the timing of conflict can be predicted using automated summaries of news reports. The topic model produces a relatively high TPR for relatively low rates of false positives. Our methodology further demonstrates that the within-country variation of the topic model has almost the same predictive power as the overall model. We show in the next section that this is key when one tries to predict in previously peaceful countries.
WHY PREDICTING THE TIMING IS IMPORTANT
The literature has been criticized for failing to provide early warning when new instabilities emerge. Margolis (Reference Margolis2012), for example, laments that “Policymakers paying attention to the recent history of popular current stability indices, for example, could not have anticipated that instability would sweep across the Middle East” (Margolis Reference Margolis2012, 14). This has led to some soul-searching in the literature and, most recently, to claims that forecasting new civil wars might have reached a limit.Footnote 21
Certainly, there are good reasons to believe that there is a natural boundary to the precision that can be reached in forecasting. However, our results suggest that two methodological shortcomings might contribute to the fact that new fragilities are more surprising than they need to be. The first is that standard methods without fixed effects will identify a lot of the risks from the between variation, which can lead to a model performing poorly in terms of predicting the timing.
Second, even when fixed effects are used, it can be of interest to drop them for forecasting because the use of the overall variation leads to a focus on cases that had previous onsets in the training sample. In Appendix F, we explain this effect theoretically and also provide Monte Carlo simulations to show that there is indeed a bias in the overall model against cases without previous onsets.
To illustrate this in the actual data, we calculate the AUC from the within and overall topic model but focus on new conflict onsets, that is, the first onset in our sample. The results are reported in Table 2. In the full sample, the overall model provides a better forecast than the within model. However, when looking at cases of onsets in previously peaceful countries, the within model gives a much better forecast than the overall model.
AUC of Topics Model in Previously Peaceful Countries vs Full Sample

Note: The topic model contains a set of 14 topic shares as estimated in 2013. The AUC is the surface under the ROC curve. A value of 1 implies that forecasts of the model are perfect. A value of 0.5 implies that forecasts are as good as random.
Table 2 demonstrates that the overall model induces a bias against new conflicts, whereas the AUC of the within model is relatively robust to the switch of sample. This is because the within model does not use any information on previous onsets to make the forecast. Instead, it relies entirely on the usefulness of the within variation to make risk evaluations. Of course, the fixed effect can contain information about risk, but from the perspective of Table 2, it seems to be a good idea to develop models with more useful within variation. Optimally, one would want a model that is able to forecast the huge differences between countries entirely through the within variation in these countries.
The bias against new conflicts in the overall model is also clearly visible in the list of top-risk countries produced by the within and overall models.Footnote 22 For example, when T = 2010, the within model predicts the onset of civil war in 2011 to be most likely in four countries without previous onsets and in Yemen, which had been relatively peaceful for over a decade. However, the overall model predicts civil war onsets in Chad, Sri Lanka, Uganda, Colombia, and the Philippines—all of which had had several onsets in their recent past. Accordingly, high-profile onsets in 2011, like those of Libya and Syria, are ranked as much more likely by the within model than by the overall model. This is the key problem when relying on the overall model—it leads to a heavy focus on countries with previous, recent onsets.
Hence, some of the current frustration in forecasting conflict could stem from a methodological bias against spotting new conflicts in the existing literature. At the heart of this bias is the reliance on between variation when forecasting makes models blind to new developments.
READING BETWEEN THE LINES
We now explore why topics provide such useful forecasting power on the time dimension.Footnote 23 To do this, we first let a simple machine learning algorithm choose variables to predict conflict within-sample. We use the least absolute shrinkage and selection operator (LASSO) with country fixed effects to choose variables from a pool of over 30 variables, including our 15 topic shares.Footnote 24 We base our analysis on the topic model estimated in 2013, as this is the last year of text we can use for estimation. The other variables in the pool are all previously used variables based on Chadefaux (Reference Chadefaux2014), Ward et al. (Reference Ward, Metternich, Dorff, Gallop, Hollenbach, Schultz and Weschle2013), and Goldstone et al. (Reference Goldstone, Bates, Epstein, Gurr, Lustik, Marshall, Ulfelder and Woodward2010). This includes a host of standard political and economic variables, word counts based on our text, and two event counts from ICEWS. To this we add the incidence of armed conflict when explaining the onset of civil war a year later. To get a more and less restrictive set of variables, we vary the parameter that captures the weight given to choosing few variables. We pick three levels to show how the chosen model evolves with increasing selectivity.Footnote 25
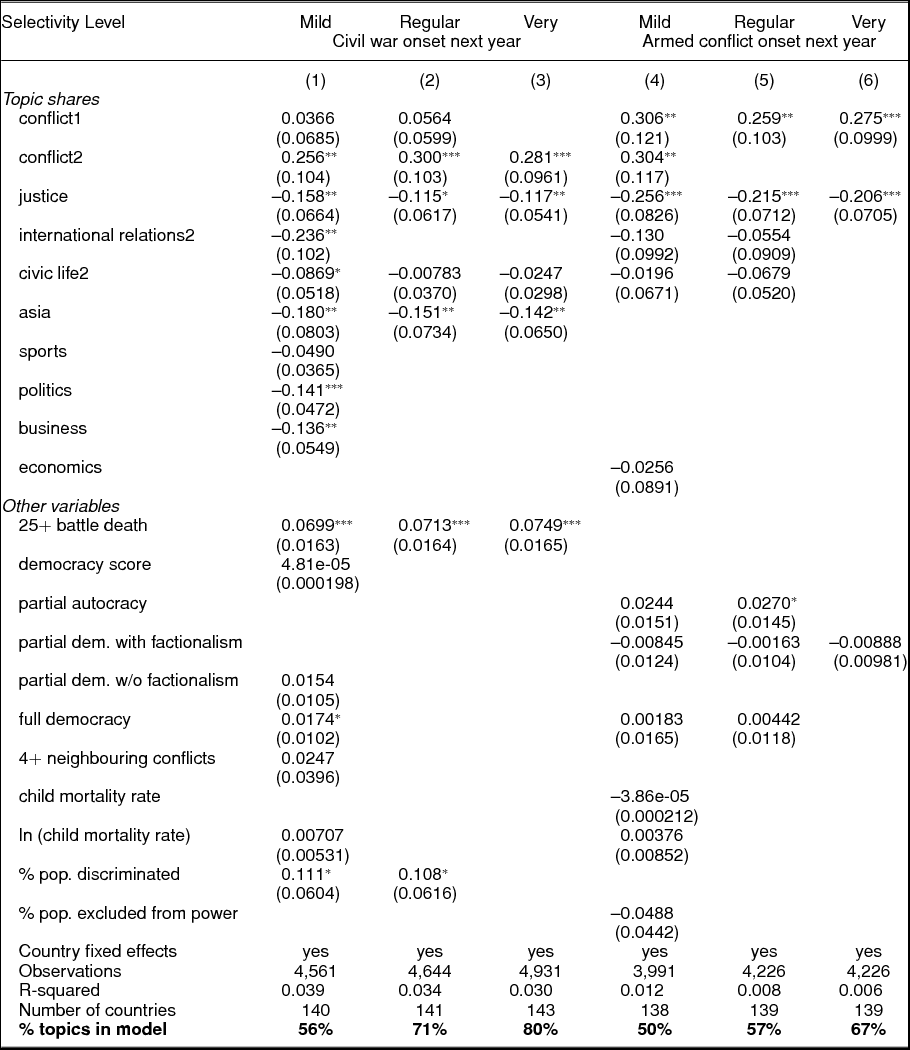
Table 3 shows the six models selected by the LASSO. Columns 1–3 show variables selected when predicting the onset of civil war and Columns 4–6 when predicting the onset of armed conflict. We report the share of the topic variables in these models in bold at the top of the table. The LASSO always chooses at least 50% of all variables from amongst the topics, and this share is higher in the more selective models.
Lasso Model

Notes: Robust standard errors in parentheses. *** p<0.01, ** p<0.05, * p<0.1. The table displays the selected variables using LASSO with parameter λ equal to 100 (columns 1 and 4), 150 (columns 2 and 5), 200 (columns 3 and 6) from 15 topics and 30 variables from other models. Topics are from the year 2013. The most prominent words of each topic in 2013 are displayed in Table I.1. Summary statistics of all variables are displayed in Table C.1.
The first message from Table 3 is that conflict topics are chosen by the LASSO despite the fact that conflict keyword counts based on the same text, conflict events, and armed conflict incidence are available. This must be because the conflict topics rely on tokens that add useful variation beyond the core conflict keywords, conflict events, and even lower-level conflict. This is not implausible, as we know that the Gibbs sampler forms large word lists around key conflict words. This depth seems to help in the forecast.
The second message is that the large majority of coefficients on topic shares within sample are negative. This suggests that stabilizing factors, captured by nonconflict topics, play a key role when explaining the timing of conflict. To evaluate the contribution of these stabilizers, we run an additional robustness check in which we exclude all conflict topics (up to three) in all years and try to forecast only with the remaining nonconflict topics.Footnote 26 The results of this attempt are in Figure 7. Strikingly, both armed conflict and civil war can still be forecasted fairly well without relying directly on the conflict topics. The within model retains almost all of its forecasting ability when predicting armed conflict (AUC of 0.72 when excluding the conflict topics compared to an AUC of 0.73) and suffers only a little more when predicting civil war (AUC of 0.79 compared to an AUC of 0.82). We conclude from this that nonconflict topics are important precursors of conflict. The forecasting power is much lower when using only the conflict topics.Footnote 27
ROC Curves for Onset (Only Nonconflict Topics)

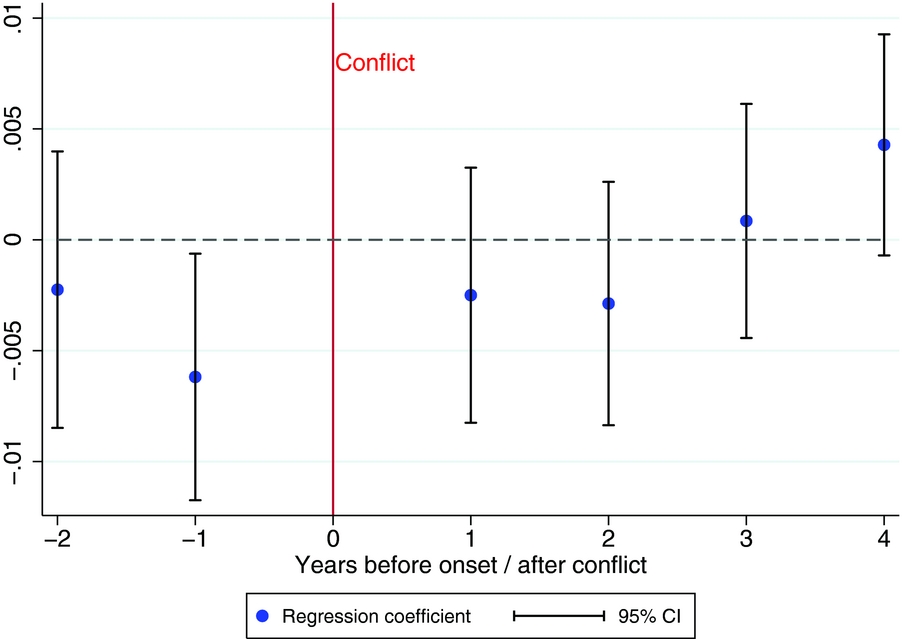
One example of the forecasting power inherent in nonconflict topics is the justice topic. Its topic share is the only variable that is picked in all models in Table 3. In Figure 8, we show the dynamics of the topic before the onset and after the end of conflict.Footnote 28 Writing on the justice topic decreases significantly one year prior to conflict and increases after conflict has ended. Importantly, this holds controlling for reporting on all other topics, that is, it is not driven by a crowding out of the justice topic by the conflict topics.Footnote 29
The Justice Topic Before and After the Outbreak of Conflict

This relationship is correlational rather than causal. Nonetheless, the fact that newspaper reports on law enforcement and justice disappear before and after conflict is in line with research on the role of checks and balances for preventing conflict (e.g., Besley and Persson Reference Besley and Persson2011b, Blattman, Hartman, and Blair Reference Blattman, Hartman and Blair2014) and the role of post-conflict justice (e.g., Meernik Reference Meernik2005, Olsen, Payne, and Reiter Reference Olsen, Payne and Reiter2010) in ensuring stability. The latter literature is relevant as news stories on the justice topic increase after conflict and reach particularly high levels in countries where peace is stable. However, the significant decrease before conflict is what lends the model its forecasting power.
CONCLUSIONS
In this article, we present a new method of predicting conflict through news topics that are generated automatically from a topic model. Topic models have the ability to diminish the dimensionality of text from counts of close to one million expressions to, for example, 15 topics. These topics can then be used in simple linear regression models to predict the onset of conflict. We have used ROC curves to show that, aggregated this way, news text becomes a useful predictor. When predicting onset one year ahead, a method based entirely on topics is able to forecast the timing of conflict better than the main models used in the literature.
Three factors make topics particularly appealing for forecasting. First, the results can be easily interpreted because topics provide meaningful summaries of text. Second, the algorithm that generates topics is able to learn from the changing association of terms. We have shown, for example, that new terms like “terrorist” or “insurgent” serve as key indicators of conflict risk in recent years, whereas they did not in 1995. Third, the topic model uses negative associations between topics and conflict risk in the prediction. In fact, large parts of the forecast seems to come from topics not directly related to conflict. The relationship between fewer reports on judicial procedures and law enforcement and higher conflict risk is particularly strong.
Our findings highlight that models need to be tested for whether their within variation is meaningful. If not, policymakers might rely on meaningless changes of risk across time. Furthermore, we have shown that relying on the overall variation of models, even if they contain useful within variation, can lead to a bias against onsets in previously peaceful countries. Ultimately, researchers and policymakers therefore face a trade-off between a better prediction overall and a model that is more useful in spotting new instabilities.
In addition, an implementation of the model presented here for policy purposes shares problems with other forecasts. First, forecasts do not provide a causal analysis of the underlying factors leading to high risk but only produce a warning of that risk. Additional analysis of the specific circumstances is needed to identify ways to address the conflict risk. Second, precision remains a problem despite the fact that our method improves upon what exists. Policymakers need to understand that, even in the best model, for five warnings made, four will be false warnings.
Topic models could provide a useful alley for research in political events more generally. We believe that it is possible to learn about the factors that influence these events from what we call the depth and width of topics. Technical extensions or refinements could include using more recently developed topic modeling techniques, such as dynamic topic models (Blei and Lafferty Reference Blei and Lafferty2006) or a structural topic model (Roberts et al. Reference Roberts, Stewart, Tingley and Airoldi2013).
SUPPLEMENTARY MATERIAL
To view supplementary material for this article, please visit https://doi.org/10.1017/S0003055417000570.
Replication materials can be found on Dataverse at https://doi.org/10.7910/DVN/SJ8ER9.








Comments
No Comments have been published for this article.