





Introduction
Recent implementations of Bayesian chronological modeling of radiocarbon data sourced from Indigenous North American archaeological sites have demonstrated the feasibility of this approach when encountering calibration plateaus and reversals, such as the series which spans the 15th through 16th centuries AD (Birch et al. Reference Birch, Manning, Hart and Lorentzen2024, Reference Birch, Manning, Sanft and Conger2021; Manning et al. Reference Manning, Birch, Conger, Dee, Griggs and Hadden2019, Reference Manning, Birch, Conger and Sanft2020). High-precision dating of this time period is especially relevant to researchers of the North American Southeast, as this coincides with the initial interactions of Indigenous nations and post-Medieval Europeans, a period which often relies on the presence/absence of European materials for chronological data. High-precision accelerator mass spectrometry radiocarbon data (AMS 14C), a new calibration curve (Reimer et al. Reference Reimer, Austin, Bard, Bayliss, Blackwell, Bronk Ramsey, Butzin, Cheng, Edwards, Friedrich, Grootes, Guilderson, Hajdas, Heaton, Hogg, Hughen, Kromer, Manning, Muscheler, Palmer, Pearson, van der Plicht, Reimer, Richards, Scott, Southon, Turney, Wacker, Adolphi, Büntgen, Capano, Fahrni, Fogtmann-Schultz, Köhler, Kudsk, Miyake, Olsen, Reinig, Sakamoto, Sookdeo and Talamo2020), and Bayesian chronological modeling have fostered new chronological models of the Southeastern Indigenous political landscape before, during, and after these early entanglements, moving beyond biased material chronologies (Cobb et al. Reference Cobb, Krus, Deter-Wolf, Smith, Boudreaux and Lieb2024; Garland et al. Reference Garland, Thompson, Birch, Brannan, Parbus, Auerbach, Chapman, Love and Strawn2024; Holland-Lulewicz et al. Reference Holland-Lulewicz, Thompson, Wettstaed and Williams2020; Krus and Cobb Reference Krus and Cobb2018). The data presented here follows this new expansion of radiocarbon research in the American Southeast, using both new and legacy radiocarbon dates to build a chronological model within the Western North Carolina Piedmont.
This article is centered on Joara, a Late Mississippian (AD 1400–1700) chiefdom rose to its height of regional power and prestige in the Western North Carolina Piedmont during the 16th century. Much of the published data concerning Joara is drawn from archaeological and ethnohistoric research on the Berry site (Beck et al. Reference Beck, Rodning and Moore2016; Hudson Reference Hudson2005), the presumed capital of Joara as well as the location of Fort San Juan, a Spanish fortified outpost established in AD 1567 under the purview of Captain Juan Pardo and destroyed 18 months later by the Joarans. A generation earlier, in AD 1540, the chiefly town also briefly hosted the Indigenous “Lady of Cofitachequi” and her captors, Hernando de Soto and his army (Hudson Reference Hudson2017, 192). After 1569, European colonists would not visit Western North Carolina for nearly two centuries. In 1605, a Spanish ship captain on the coast of South Carolina reported that Indigenous people spoke of a “very big village which is called Hoada” near the mountains, suggesting that some version of Joara persisted into the early seventh century without direct contact with early colonial powers (Beck Reference Beck2013, 93–94). However, by 1700, when English colonist John Lawson traveled through the Carolinas, it appears that people had left the river valleys of Western North Carolina completely (Lawson Reference Lawson and Lefler1967).
These early interactions between the Late Mississippian World and early European colonial parties present researchers with colorful narratives peppered with exact calendrical dates of some Indigenous occupations, but do not answer broader questions about the nature of socio-political development and persistence in the Native Southeast. Bayesian modeling of radiocarbon data presents an opportunity to overcome complications from both the calibration curve as well as the implicit biases from Eurocentric data on the chronology of the Indigenous polities that shaped early European explorations and colonialism. To explore this concept, 23 new AMS 14C estimates were measured from two archaeological sites and were compared to a larger set of extant radiocarbon data from 12 sites across the Western North Carolina Piedmont. Bayesian models were then produced to better understand the generations of continuity and change which created the Native political landscape described in 16th-century Spanish chronicles. This work demonstrates the utility of AMS 14C data in early contact contexts in spite of the difficulties of calibration plateaus and reversals spanning much of this period as well as the opportunities this approach has to developing chronologically-defined histories of Indigenous places in the North American interior.
Archaeological background
Material culture and culture history
This study focuses on the 16th-century political landscape of Joara and its nearby contemporaries inside and outside of what archaeologists call the “Mississippian World.” Characterized in part by its diversity, communities within the cultural construct of “Mississippian” shared traits including competitive chiefly socio-political organization, advanced maize agriculture, monumental earthwork construction and a related cosmology, and a complex network of trade that moved raw materials, craft products, and people across the American Southeast. Generally, the expansion of Mississippian practices is dated from as early as AD 800 to about 1600, although different parts of the Southeast experience “Mississippianization” at different periods (Anderson and Sassaman Reference Anderson and Sassaman2012; Beck Reference Beck2013; Ferguson Reference Ferguson1971). The Joaran polity was at the far northeastern edge of this world, with neighbors including the Guatari chiefdom in the Upper Yadkin River valley, the Cherokee ancestors of the Appalachian summit region and smaller, dispersed settlements in the South Fork region of the Catawba River valley. Much of this population reconstruction comes from ethnohistoric data (Hudson Reference Hudson2005, Reference Hudson2017) but is also supported by decades of archaeological research.
Chronological knowledge of Joara is built primarily from the materials recovered in archaeological contexts, particularly through an established ceramic sequence (Beck and Moore Reference Beck and Moore2002; Moore Reference Moore2002). The ceramic sequences of the Western North Carolina Piedmont are not tightly tied to absolute dates, but are rather broadly understood through a sequence of culture history that spans several centuries supported by a small collection of radiometric data. This culture-historical approach is still common in the American Eastern Woodlands, although many researchers have noted that archaeologists’ reliance on ceramic typologies can simplify political and ethnic identities (see Worth Reference Worth, Waselkov and Smith2017) as well as obscure greater processes of continuity and change (see Birch et al. Reference Birch, Manning, Sanft and Conger2021). However, with high-precision radiocarbon methodologies, ceramic data can be combined with other material and archaeological data to support newly detailed chronological interpretations of archaeological contexts. The 16th-century sites within Joara provide such an opportunity and thus should be described in brief to contextualize our understanding of the material record.
Burke material culture, that is the suite of artifacts that the people of Joara made, included pottery related to the Mississippian Lamar ceramic complex. This ceramic practice involves large flaring rim jars decorated with curvilinear complicated stamping and carinated bowls incised with “teardrops” or concentric ring designs. These ceramics are distinguished by soapstone tempering, which is unique in the Mississippian World. This ceramic practice, known as Burke, has been found at all the sites that contributed data to this new study and has been broadly associated with the late 15th through late 16th centuries AD. It is considered the final ceramic practice of Indigenous people prior to their apparent abandonment of the region in the early 17th century (Moore Reference Moore2002). Another ceramic practice, known as Pisgah, has been found in small quantities across the Joara landscape and has been considered related to Cherokee ancestors in the mountain summit region (Briggs et al. Reference Briggs, Rodning, Beck and Moore2024). Chronologically, Pisgah is considered the 16th-century predecessor to the Qualla ceramic phase, which is directly associated with 17th- and 18th-century Cherokee people (Dickens Reference Dickens1976, Reference Dickens and Smith1978). It is characterized by rectilinear complicated stamping motifs and highly decorated thickened rims. Pisgah vessels are usually quartz-grit tempered, but in Joara they are always soapstone tempered; part of a local ceramic practice. While the distinction between Pisgah and Burke ceramic styles have been used as markers of communities of practice affiliated with Late Mississippian peoples, more specifically as mountain people and Joaran people (Briggs et al. Reference Briggs, Rodning, Beck and Moore2024; Moore Reference Moore2002), new data suggest that there is a chronological aspect to these practices as well- namely that Pisgah pottery may have been made in Joara prior to their replacement by Burke ceramic practices (Pigott Reference Pigott2024, 258). However, this transition, as well as the transition to Mississippian practices writ large, have been underevaluated in the Western North Carolina Piedmont. Ceramic artifacts have been traditionally applied in chronological studies of the region, however other forms of material culture, including diagnostic chipped stone tools, carved soapstone discs, and ceramic and soapstone pipes are also associated with Burke and Pisgah material cultures and are widely associated with the established ceramic sequences (Beck and Moore Reference Beck and Moore2002; Moore Reference Moore2002).
Legacy radiocarbon data from the Western Carolina Piedmont
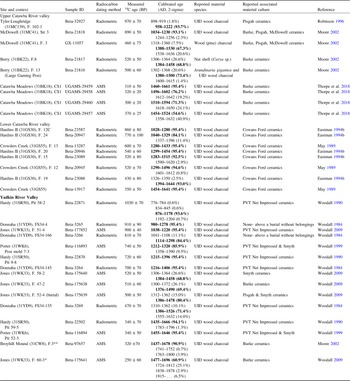
The polity of Joara was part of a political landscape of competitive polities both within and outside of the Mississippian World. Archaeological research conducted prior to 2020 has produced about 34 radiocarbon dates that were folded into this project as comparative data for larger chronological models of the Western Carolina piedmont. These data included sites from the Upper Catawba River valley, as well as the Lower Catawba River valley and the Upper Yadkin River valley (Table 1). Some of these data are radiometric dates, but the data published during the last 20 years are AMS dates. I recalibrated all published data through OxCal version 4.4.4 (Bronk Ramsey Reference Bronk Ramsey1995, Reference Bronk Ramsey2009a) and with the most recent calibration curve available, IntCal20 (Reimer et al. Reference Reimer, Austin, Bard, Bayliss, Blackwell, Bronk Ramsey, Butzin, Cheng, Edwards, Friedrich, Grootes, Guilderson, Hajdas, Heaton, Hogg, Hughen, Kromer, Manning, Muscheler, Palmer, Pearson, van der Plicht, Reimer, Richards, Scott, Southon, Turney, Wacker, Adolphi, Büntgen, Capano, Fahrni, Fogtmann-Schultz, Köhler, Kudsk, Miyake, Olsen, Reinig, Sakamoto, Sookdeo and Talamo2020). This recalibration standardized the published data with my new AMS radiocarbon data, nominally adjusting estimated ranges.
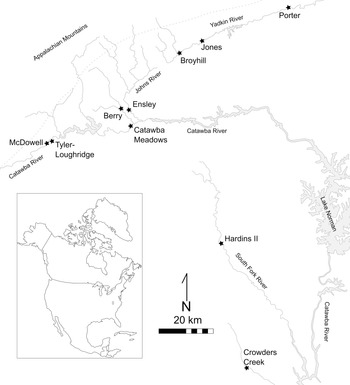
The Berry site, the chiefly capital town of Joara, presents the best-published archaeological data from this region (Beck et al. Reference Beck, Rodning and Moore2016; Moore Reference Moore2002). Berry is located within the drainage of the Upper Catawba River, near the foothills of the Southern Appalachians in Burke County, North Carolina and has undergone archaeological excavations regularly since 2000 after initial field work in the late 1980s and early 1990s. Two radiocarbon dates collected from the original 1986 excavation (Moore Reference Moore2002) suggest that the site may have been occupied at least a century earlier than the AD 1568 destruction of Fort San Juan. Along with regional archaeological data (Beck Reference Beck1997; Moore Reference Moore2002) and recent excavations identifying earlier Late Woodland period (ca. AD 800–1200) occupations below Fort San Juan (Rodning et al. Reference Rodning, Beck, Briggs and Moore2023), these date estimates suggested that Joara has a deeper past than initially expected. Other important sites providing extant radiocarbon and material data for this project include McDowell and a nearby smaller site, Tyler-Loughridge, both situated along the far upper reaches of the Catawba River in McDowell County, North Carolina (Figure 1). Legacy radiocarbon data, Burke material culture, and structural data including Mississippian-style residences and a large public building led researchers to associate the site with the Mississippian World (Moore Reference Moore2002; Ward Reference Ward1977). Tyler-Loughridge’s material culture and structural evidence suggested to researchers an earlier Late Woodland occupation, however, a pit feature (Feature 102-1) with Pisgah and Burke pottery provided a calibrated range within a possible transitional period between Woodland and Mississippian cultural periods (Robinson Reference Robinson1996). These two sites likely represent the furthest western extent of Joara as well as an early expansion of the regional variation of Mississippian culture known as “South Appalachian Mississippian” (Ferguson Reference Ferguson1971), although as previously stated, this transition is not currently well-understood. On the opposite side of Joara’s domain is the Broyhill site, located within the far upper reaches of the Yadkin River valley in Caldwell County, North Carolina (Figure 1). A single radiocarbon estimate, associated with a Mississippian-style residential structure and Burke materiality, places the site’s occupation broadly contemporaneous to Berry and the Mississippian World (Kimball et al. Reference Kimball, Evans-Shumate and Shumate1996; Moore Reference Moore2002).
Archaeological sites in Western North Carolina contributing radiocarbon data (figure by author).
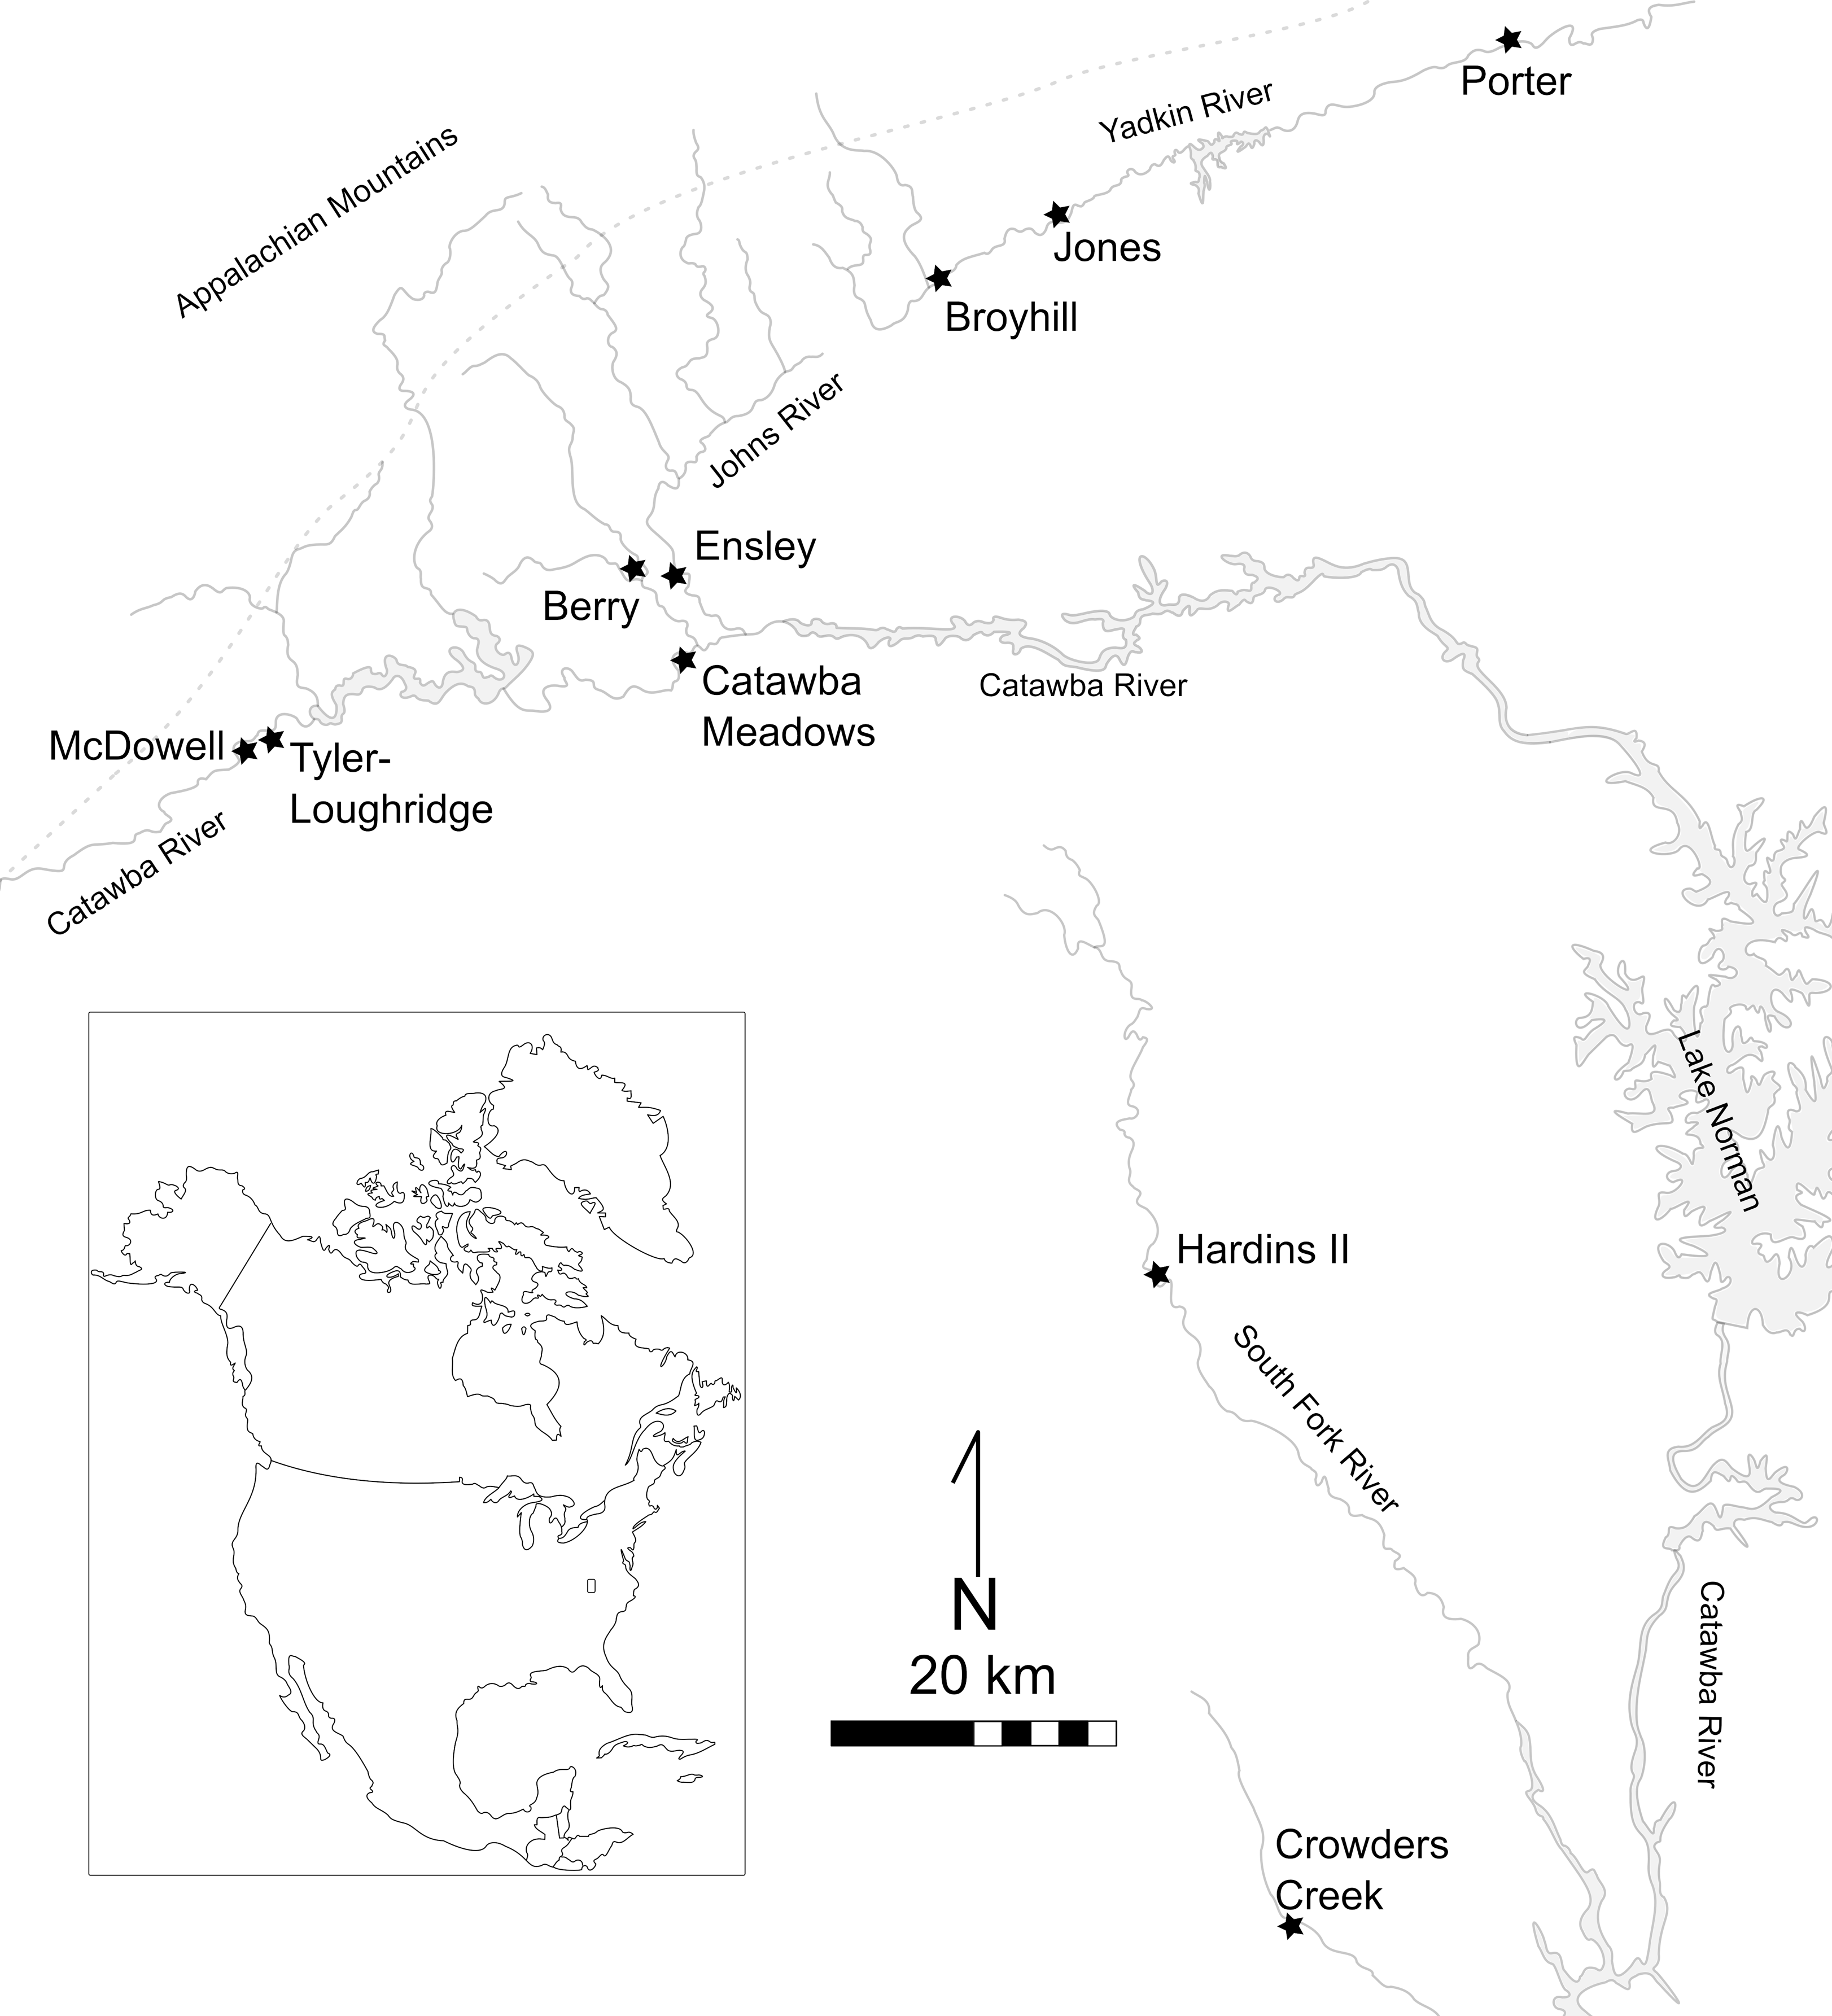
Published data outside of the estimated bounds of the Joara polity, associated with possible contemporaneous neighbors, also point to a deeper past than expected from chronologies centered on entrada chronicles and materials. The Lower Catawba River valley radiocarbon data includes two sites, Hardins II and Crowders Creek, both situated within the northern drainage of the South Fork of the Catawba River. Hardins II and Crowders Creek are both associated with a ceramic type known as Cowans Ford (Moore Reference Moore2002, 153), which is broadly associated with the 16th century, although Crowders Creek also had Woodland pottery types (May Reference May1989). Material and stratigraphic data also suggest that Hardins II likely had two occupations, although the extent to which the occupations are related is unknown (Mathis Reference Mathis1980). To the surprise of the researchers interpreting them, both sites’ radiocarbon estimates range early; far before the 16th century (Mathis Reference Mathis1980; May Reference May1989). On the opposite side of Joara, the sites on the far upper reaches of the Yadkin River have data indicating a broad range of occupational histories. Broyhill and a site further east known as the Jones site, have date estimates ranging through the 16th and 17th centuries and are the only sites with Mississippian settlement patterns and materials on the Yadkin (Kimball et al. Reference Kimball, Evans-Shumate and Shumate1996). Further downriver, the Porter, Donnaha, and Hardy sites appear to be affiliated with the non-Mississippian “Piedmont Village Tradition” (or PVT) peoples (Jones Reference Jones, Birch and Thompson2018). PVT sites have often been considered earlier, and separate from, the Mississippian landscape, although new AMS data supported by ceramic analysis has recently suggested that these non-Mississippian people were negotiating their own cultural boundaries with the newly expanding Mississippian World and did not simply abandon the Upper Yadkin River valley after AD 1200, as previously thought (Paul Reference Paul2023).
These legacy dates from the Upper and Lower Catawba and the Upper Yadkin River valleys represent an opportunity for the development of an extensive regional chronology for the Western North Carolina Piedmont. They also illustrate the region’s time-depth of Indigenous places not only prior to the 16th-century Spanish incursions, but perhaps prior to the so-called Mississippian expansion into the Southern Appalachians. Two archaeological sites materially related to the Joara polity in Burke County, North Carolina, Ensley and Catawba Meadows, were reexamined for material and AMS radiocarbon analysis (see Pigott Reference Pigott2024 for detailed material analysis). These data were then compared to large-scale models of legacy radiocarbon data from the 12 archaeological sites across the Western North Carolina Piedmont discussed above (Figure 1). This article covers the initial work towards such a project by reporting 23 new AMS 14C measurements collected from the Catawba Meadows and Ensley sites as well as presenting a few preliminary Bayesian models from these places.
Catawba Meadows (31BK18)
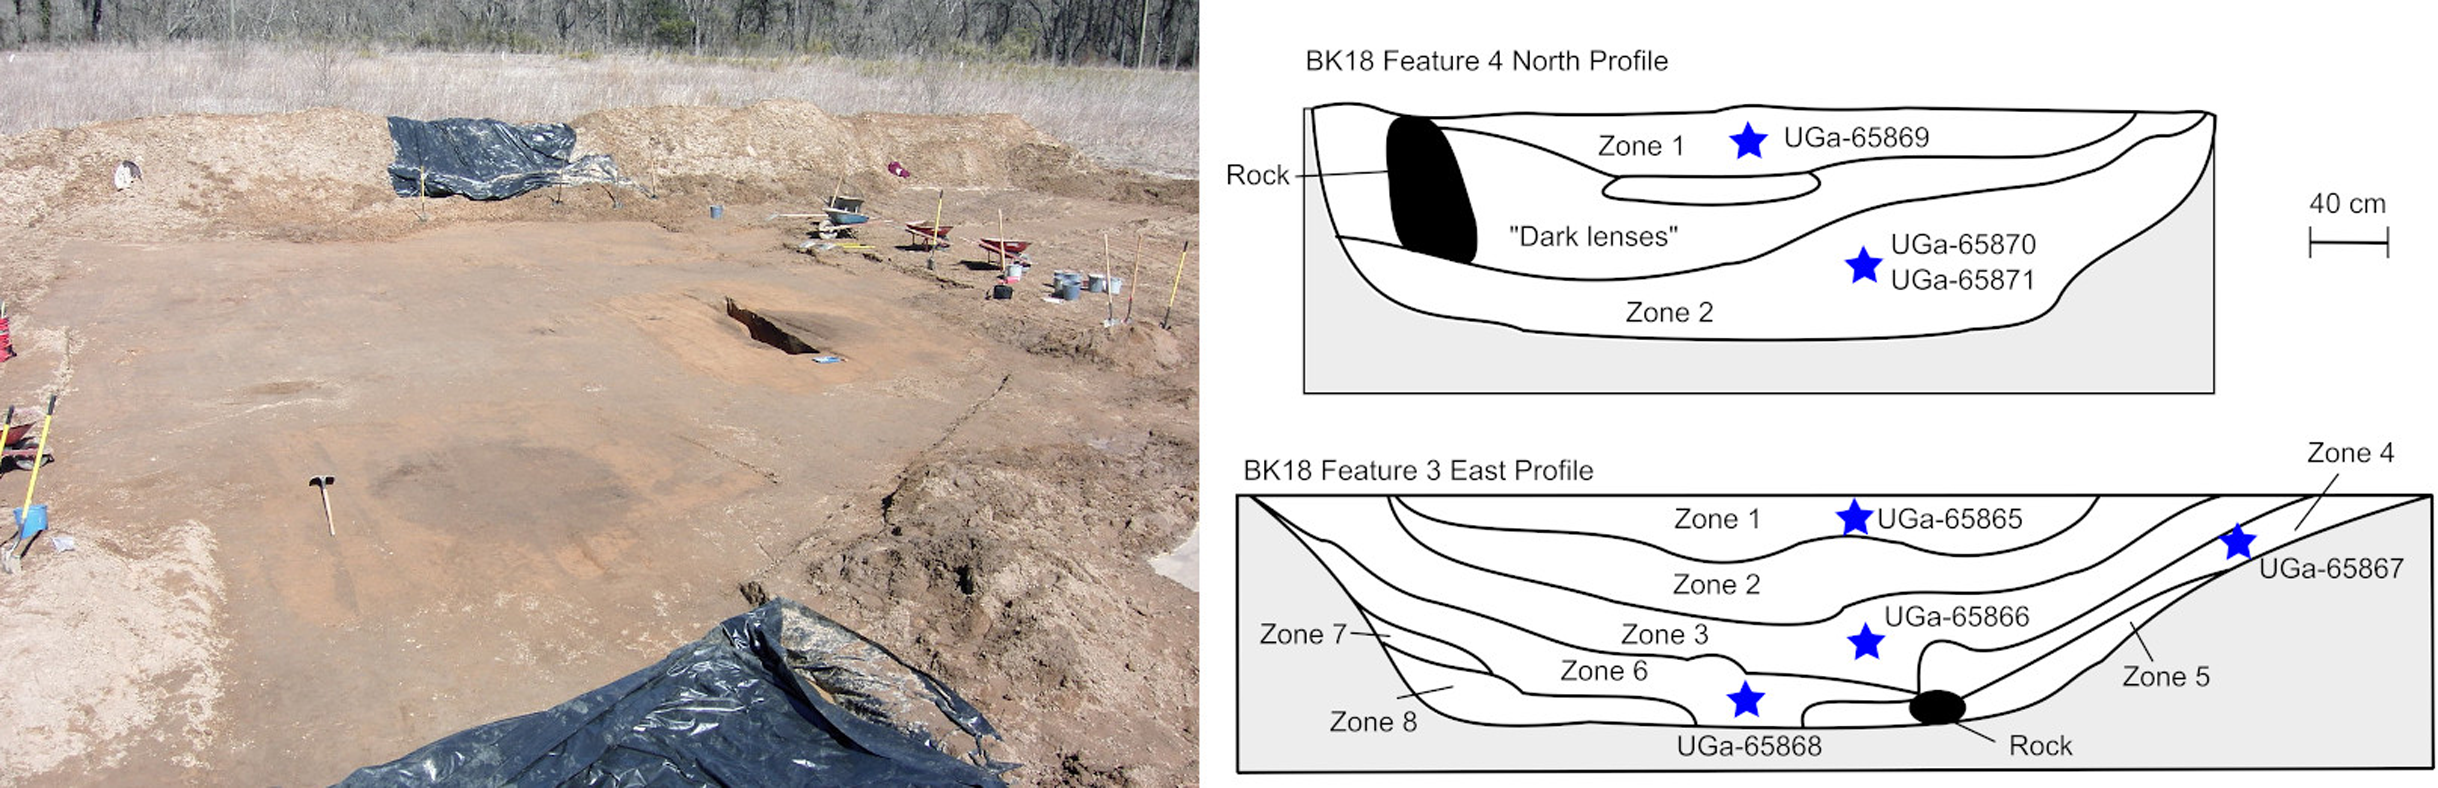
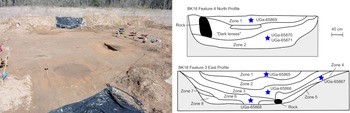
The Catawba Meadows site is located in an oxbow floodplain along the Upper Catawba River, within the city limits of Morganton, North Carolina. Formal archaeological work at the site was initiated in 2003 (Gougeon and Moore Reference Gougeon and Moore2003) and later archaeological investigations (Geiger Reference Geiger2012) located one 8 m by 8 m rounded-corner residential structure of typical South Appalachian Mississippian construction (CS1). Material culture connected to the Mississippian World, including Burke phase ceramics and Mississippian chipped stone tools, archaeologically link Catawba Meadows to the Berry site and the 16th-century Joara polity, but did not include any Spanish-related material (Pigott Reference Pigott2024, 104–129). In addition, four AMS 14C dates (UGAMS-29457, UGAMS-29458, UGAMS-29459, and UGAMS-29460) were measured from unidentified charcoal found within the fill of CS1, broadly placing the house context within the 16th century (Thorpe et al. Reference Thorpe, Hoover and Rodning2018). CS1 appears to have only one stage, so stratigraphic ordering of the samples is impossible. While no other structures have been located during the last 20 years of intermittent work at the site (Geiger Reference Geiger2012; Govaerts and Moore Reference Govaerts and Moore2008; Gougeon and Moore Reference Gougeon and Moore2003; Pigott Reference Pigott2024) two large pit features, Feature C3 and Feature C4, presented an opportunity to compare intra-site contexts as well as contribute to the larger Western North Carolina Piedmont regional chronology. These pits are about 8 m apart and were excavated simultaneously during one weekend of salvage work prior to the construction of a baseball field which now obstructs a large part of the site (Figure 2). Ceramic and stratigraphic evidence suggest that they were the result of two discrete, perhaps simultaneous, events and were filled rapidly in single episodes (Pigott Reference Pigott2024, 107–112).
Left: pit features under excavation at Catawba Meadows. Right: profile maps of pit features, stars indicate stratigraphic location of samples (figure by author).
Ensley (31BK468)
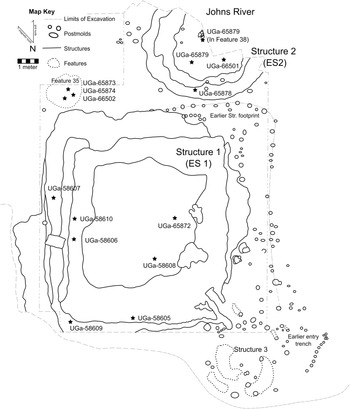
The Ensley site (31BK468), located along the Johns River, a tributary of the Catawba River just north of Morganton, North Carolina, was excavated by archaeologists during the summer months of 2005 as part of a riverbank restoration project funded by the USDA (Pigott Reference Pigott2024, 131–132). Researchers used a backhoe to mechanically strip an area spanning roughly 45 m north-south and 16 to 20 m east-west, revealing thousands of Mississippian artifacts, a complex stratigraphy with a buried occupational surface, hundreds of post molds, and at least three structures (Figure 3). No AMS 14C samples were collected during initial excavations, in part due to the constricted timeline of the salvage project. The two largest structures, Structure 1 (ES1) and Structure 2 (ES2), as well as a pit feature associated with the initial construction of ES1, contributed to the chronological modeling of the site and the larger regional models.
Ensley site plan showing sample locations; stars indicate horizontal locations (figure by author after original map by Rachel V. Briggs).
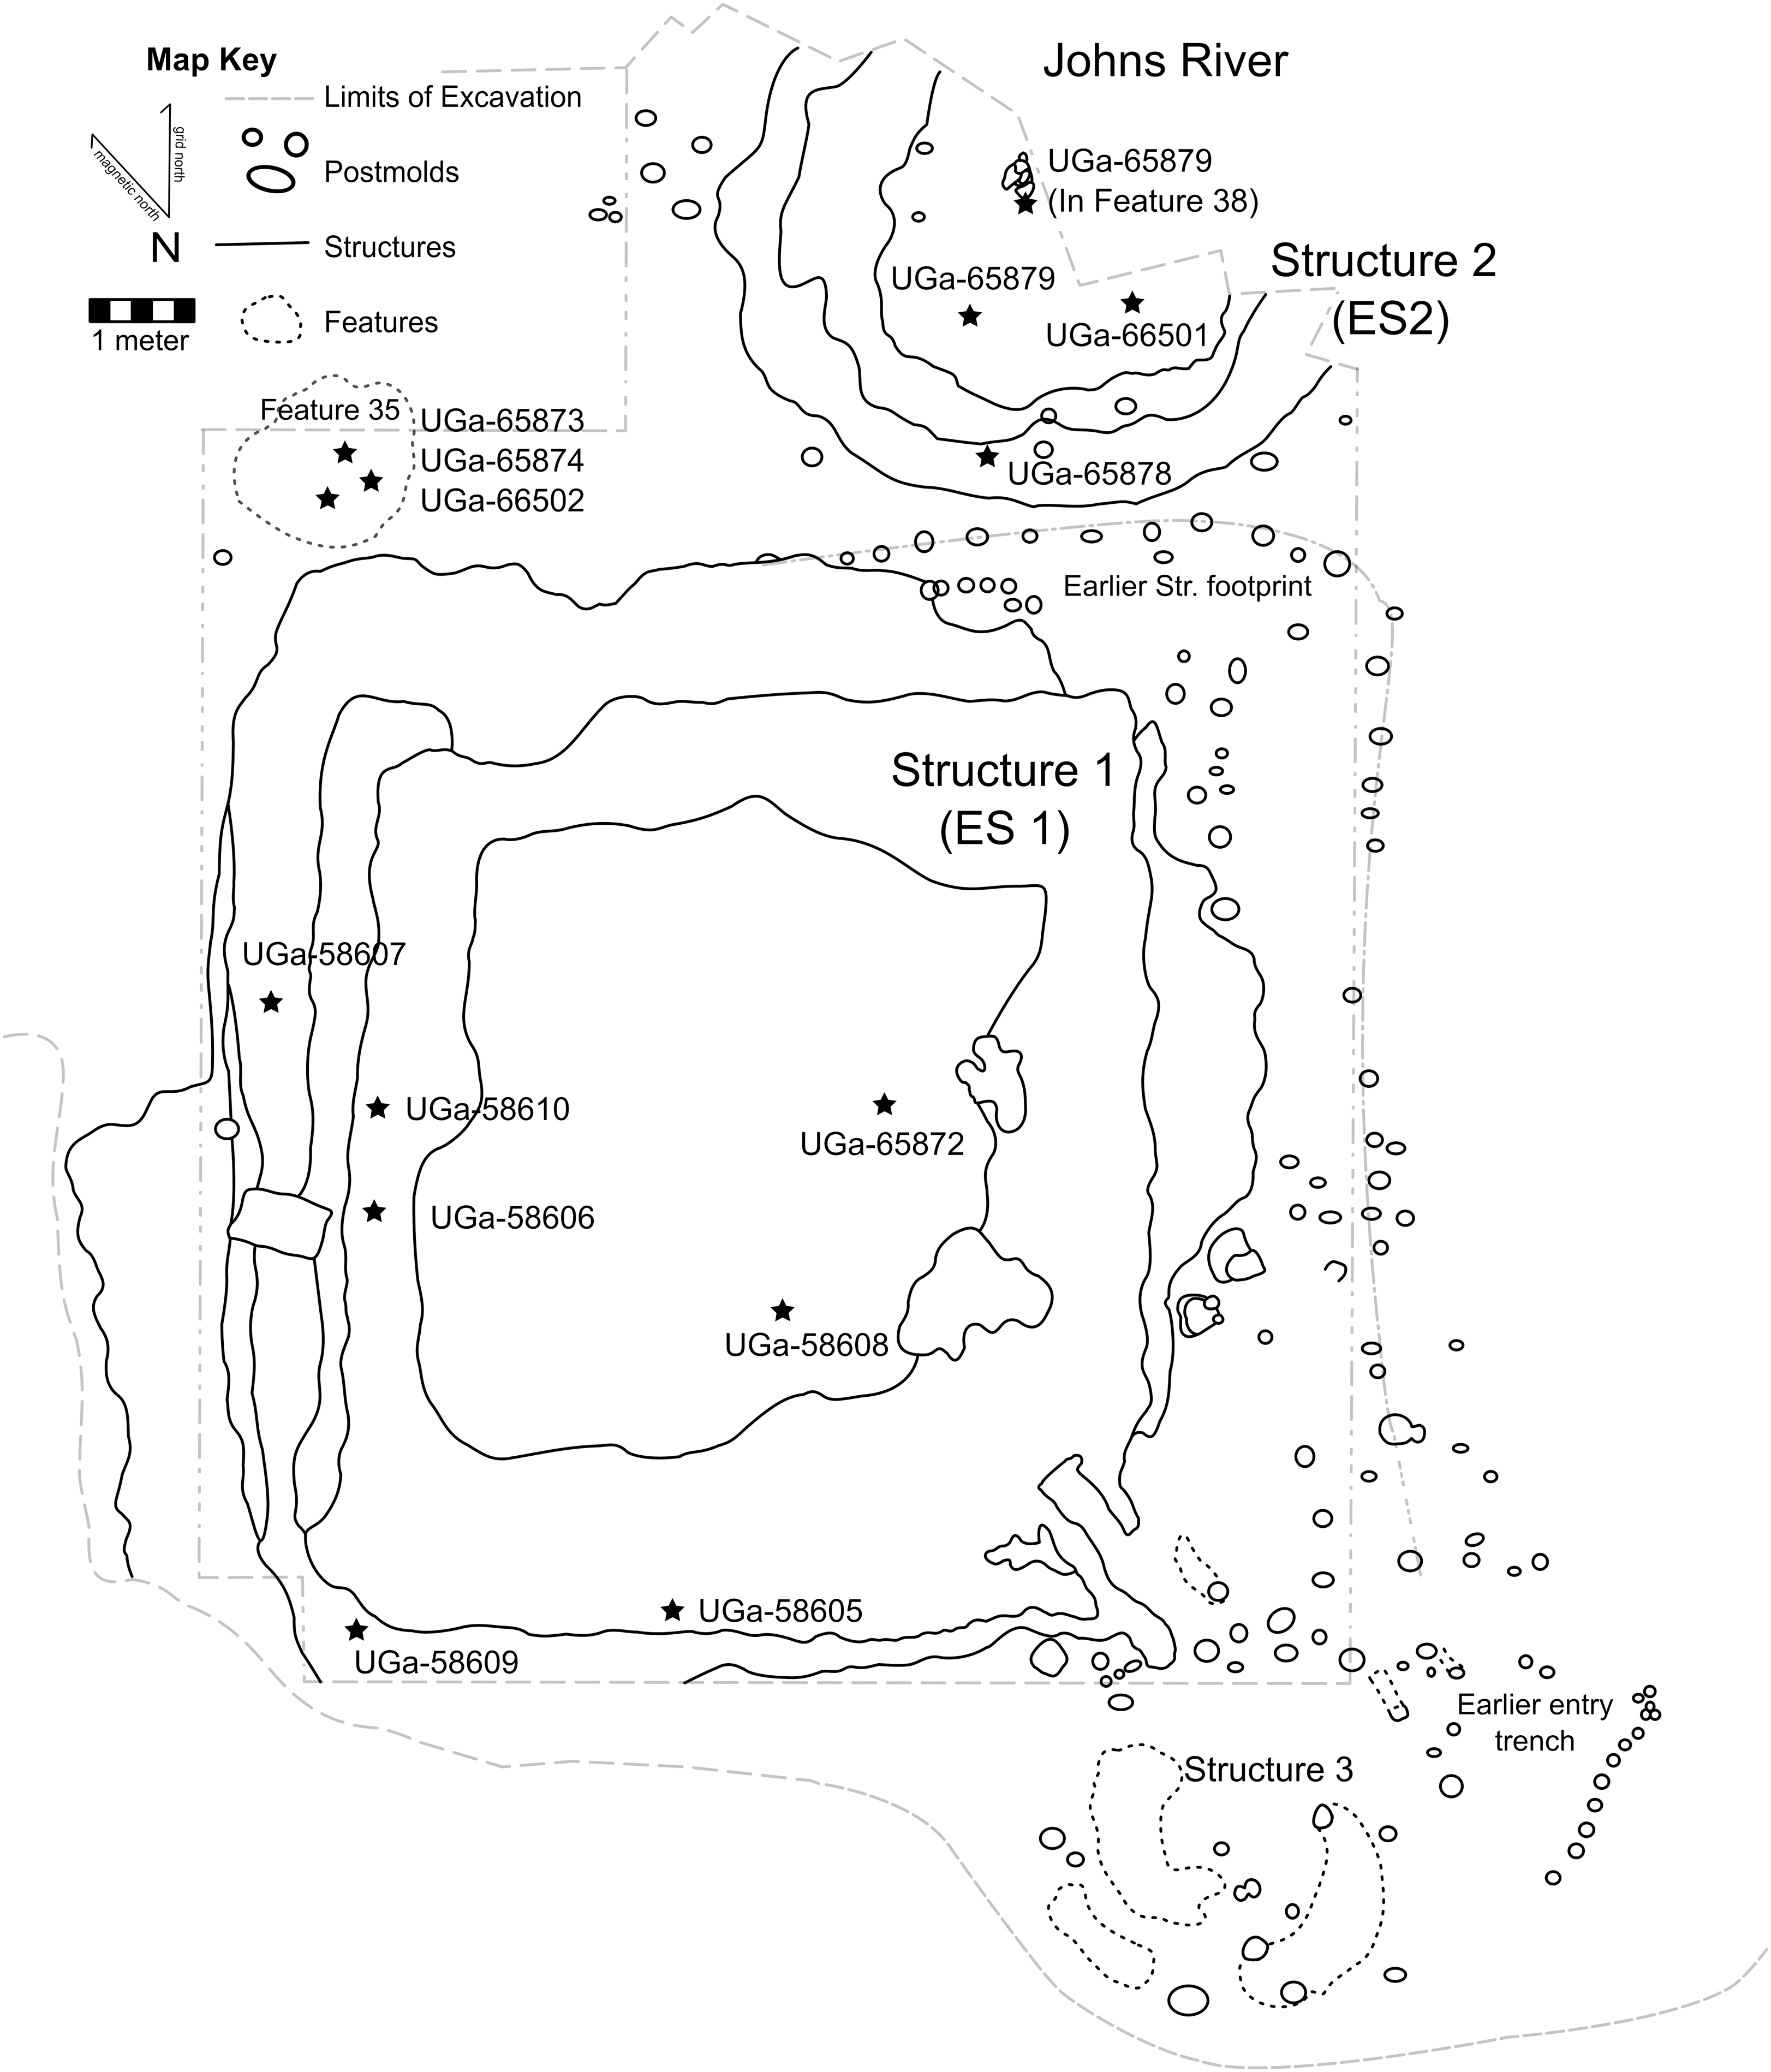
Figure 3. Long description
A site plan of the Ensley site showing sample locations and structures. The map includes a key indicating the limits of excavation, postmolds, structures, and features. The site is divided into three main structures: Structure 1 (ES 1), Structure 2 (ES2), and Structure 3. Each structure is outlined with its boundaries clearly marked. Sample locations are indicated by stars, with specific identifiers such as UGa-65873, UGa-65874, and UGa-66502. Postmolds are represented by small circles scattered throughout the site. Features are marked with dashed lines and include labels such as Feature 35. The Johns River is shown to the north of the site, and an earlier structure footprint is indicated to the east of Structure 1. The map also shows an earlier entry trench to the southeast of Structure 3.
ES1 was a rectangular building with rounded corners and measured about 10 m by 12 m, in line with many Southern Appalachian Mississippian civic-ceremonial buildings known as council houses or townhouses. Townhouses were center places to the “town” or community who built them and were commonly destroyed and rebuilt in cycles of community renewal (Pigott et al. Reference Pigott, Rodning and Nesbitt2021; Rodning Reference Rodning2010, Reference Rodning2015). ES1’s four stage hearth indicates it was reconstructed four times during its use-life (Pigott Reference Pigott2024, 158). Located just outside of the northwestern corner of ES1 was a large, 150 centimeters in diameter, circular pit feature (Feature E35) which appears to have been filled in at least two episodes, with the higher zone interspersed with several layers of ash and carbonized materials. Feature E35’s stratigraphic location suggests the pit was dug and filled prior to the initial construction of ES1. While no radiocarbon samples were processed for these contexts during the initial 2005 project, researchers used the presence of Burke phase ceramics, Mississippian triangular chipped stone projectile points, as well as three blue glass beads and rolled copper-alloy artifacts (likely of Spanish origin) to conclude Ensley’s occupation was contemporaneous with the 16th-century occupation at the Berry site (Pigott Reference Pigott2024, 130). However, a reevaluation of the ceramic materials from E35 identified a significant presence of the Pisgah ceramic practice (Pigott Reference Pigott2024, 209–213), which is usually associated with settlements in the Appalachian Summit region who were making these materials through the 16th century. This material culture becomes more significant with the addition of the AMS 14C data sourced from E35 and a smaller structure, ES2 (discussed below).
Less than 2 m north of ES1 and Feature E35, ES2 was a round building measuring just over 7 m in diameter. Circular structures are uncommon in the Mississippian World but are typical of Late Woodland period Western North Carolina Piedmont sites. ES2 did not have evidence of a central hearth but instead had a shallow pit feature and a cluster of stacked stone near its center, perhaps replacing the original hearth (Pigott Reference Pigott2024, 142, 155–156). Unfortunately, many of the artifacts excavated from the building were lost when the excavation’s water screening station was swept downriver during a flood caused by the remnants of Hurricane Katrina in mid-August 2005. The only ceramics examined in detail from ES2 were sourced from the central pit feature (E38), which fit within the Burke ceramic practice (Pigott Reference Pigott2024, 210). This led the original researchers to consider ES1 and ES2 likely contemporaneous, and more broadly, the Ensley site as a single-occupation place contemporaneous with the Berry site and Spanish contact. AMS 14C dating of these structures would complicate this initial interpretation (see below).
Methods
AMS radiocarbon lab methods
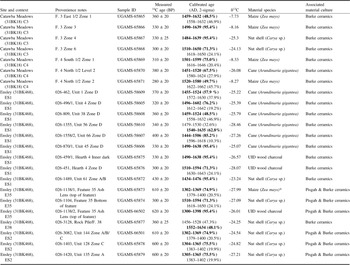
This radiocarbon sampling protocol targeted three short-lived plants common in Late Mississippian archaeological contexts; river cane (Arundinaria gigantea), hickory nuts (Carya), and maize kernels (Zea mays). River cane samples were hand collected from in situ archaeological contexts and nut and kernel samples were collected through manual flotation processing. Three samples of wood charcoal were collected from contexts where no other datable material was present; the species of wood for these samples could not be determined. All samples were from extant collections; the oldest field collection dates were from 2003. Sample sizes were kept small, no larger than 3 cm in length, and were packaged in standard, non-reactive, lab-quality plastic bags. All 23 samples were submitted to the University of Georgia’s Center for Applied Isotope Studies (UGA CAIS) for the AMS processing (Table 2). UGA CAIS treated all samples with the standard AAA (acid-alkali-acid) pretreatment and deionized water before drying and combusting the cleaned samples at 900 degrees Celsius. The lab reports AMS 14C results in years before present (i.e. AD 1950) with an error of one standard deviation, reflecting both statistical and experimental errors.
New AMS radiocarbon data sampling protocol
A total of seven new AMS 14C samples were measured from the pit features at the Catawba Meadows site (Table 2, Figure 2). Four samples were collected from Feature C3; one burned maize kernel (UGAMS-65865) was selected from the top of the feature (Zone 1) and three carbonized hickory nut shells (UGAMS-65866, UGAMS65867, and UGAMS-65868) were sampled in descending order amongst the C3’s lower stratigraphic zones (Zones 3, 4, and 6, respectively). The UGA CAIS lab report noted that one of the samples originally identified as a hickory nutshell (UGAMS-65866) returned a δ13C value indicating that it was likely maize. This distinction does not affect my chronological data. Three samples were collected from Feature C4 which was separated into 2 stratigraphic zones; a burned maize kernel (UGAMS-65869) from Zone 1, one charred cane fragment (UGAMS-65870) from Zone 2 and another maize kernel (UGAMS-65871) from Zone 2.
Unlike Catawba Meadows, no extant AMS 14C data was available to compare intra-site contexts at Ensley. ES1, Feature E35, and ES2 provided a total of 16 samples from the site (Table 2, Figure 3). Nine samples were collected from ES1. This included six carbonized river cane samples (UGAMS-58605-58610) taken from burned architectural material at the center of the building in stratigraphic Zone D, interpreted as the collapse of the final iteration of ES1. One carbonized nutshell (UGAMS-65872) was selected from a zone associated with the top of ES1 (Zone A/B), which exhibited some disturbance from recent farming activities. Two wood charcoal samples (UGAMS-65875 and UGAMS-65876) were collected from the final stage of the central hearth, stratigraphically related to Zone D. A substantial ash layer at the stratigraphic top of Feature E35 was the source of two samples: one charred maize kernel (UGAMS-65873) and one wood charcoal (UGAMS-66502). The UGA CAIS lab report noted that sample UGAMS-65873 returned a δ13C value indicating that it was likely misidentified as maize in the initial paleoethnobotanical analysis (Table 2). The sample’s δ13C value suggests instead that it may have been wood charcoal and was thus treated with a charcoal outlier indicator in subsequent Bayesian models (see below). A carbonized hickory nutshell (UGAMS-65874) was sampled from the stratigraphic bottom of Feature E35, below the ash layer. Finally, three carbonized hickory nut shells were selected from ES2’s house basin; UGAMS-65879 from the top of ES2 (Zone A), UGAMS-66501 from a mixed stratigraphic zone (Zone A/B/C), and UGAMS-65878 from the lowest layer (Zone C). One charred hickory nutshell (UGAMS-65877) was also selected from the central pit feature and associated rock pile (E38), which intrudes through the three stratigraphic zones of ES2.
Bayesian methods
This study employed the most recent version of the program OxCal available, 4.4.4 (Bronk Ramsey Reference Bronk Ramsey2009a), and the IntCal20 calibration dataset (Reimer et al. Reference Reimer, Austin, Bard, Bayliss, Blackwell, Bronk Ramsey, Butzin, Cheng, Edwards, Friedrich, Grootes, Guilderson, Hajdas, Heaton, Hogg, Hughen, Kromer, Manning, Muscheler, Palmer, Pearson, van der Plicht, Reimer, Richards, Scott, Southon, Turney, Wacker, Adolphi, Büntgen, Capano, Fahrni, Fogtmann-Schultz, Köhler, Kudsk, Miyake, Olsen, Reinig, Sakamoto, Sookdeo and Talamo2020). Within the program I used the default calibration curve resolution of five years. OxCal modeling terms, such as Phase, Boundary, Sequence, are capitalized in this text to differentiate from non-OxCal terms. All of the accepted models below had an Amodel and Aoverall agreement index above 60 percent. These agreement indices are operationalized to identify problematic discrepancies between samples and resulting models: poor results (below 60%) point to inconsistent data, errors, and unlikely priors (Hamilton and Krus Reference Hamilton and Krus2018:192) and were thus an important factor in evaluating model results. Complying with contemporary Bayesian modeling standards, all models include Charcoal Outlier Modeling and General Outlier Modeling, depending on the sample (Bayliss Reference Bayliss2015; Cobb et al. Reference Cobb, Krus, Deter-Wolf, Smith, Boudreaux and Lieb2024; Krus et al. Reference Krus, Herrmann, Pike, Monaghan and Wilson2019), using the suggested 5% prior probability of outliers (Bronk Ramsey Reference Bronk Ramsey2009b). The General Outlier model has been successfully applied in other analyses on dates derived from short lived plants (see Manning et al. Reference Manning, Birch, Conger, Dee, Griggs and Hadden2019) and was applied to all estimates drawn from those sources, whereas the Charcoal Outlier Model was applied in data sets that included wood charcoal samples. When necessary, some dates were removed completely from the models, which is a common approach when outlier models do not correct the errors (Bronk Ramsey Reference Bronk Ramsey2009b). All results are reported within 95.4% highest posterior density (hpd) range and modeled probabilities are rounded within 5 years. As with all scientific models, the chronological models presented below are estimates that should change as more data become available and as new calibration curves are released.
Bayesian models
Model 1: Catawba Meadows
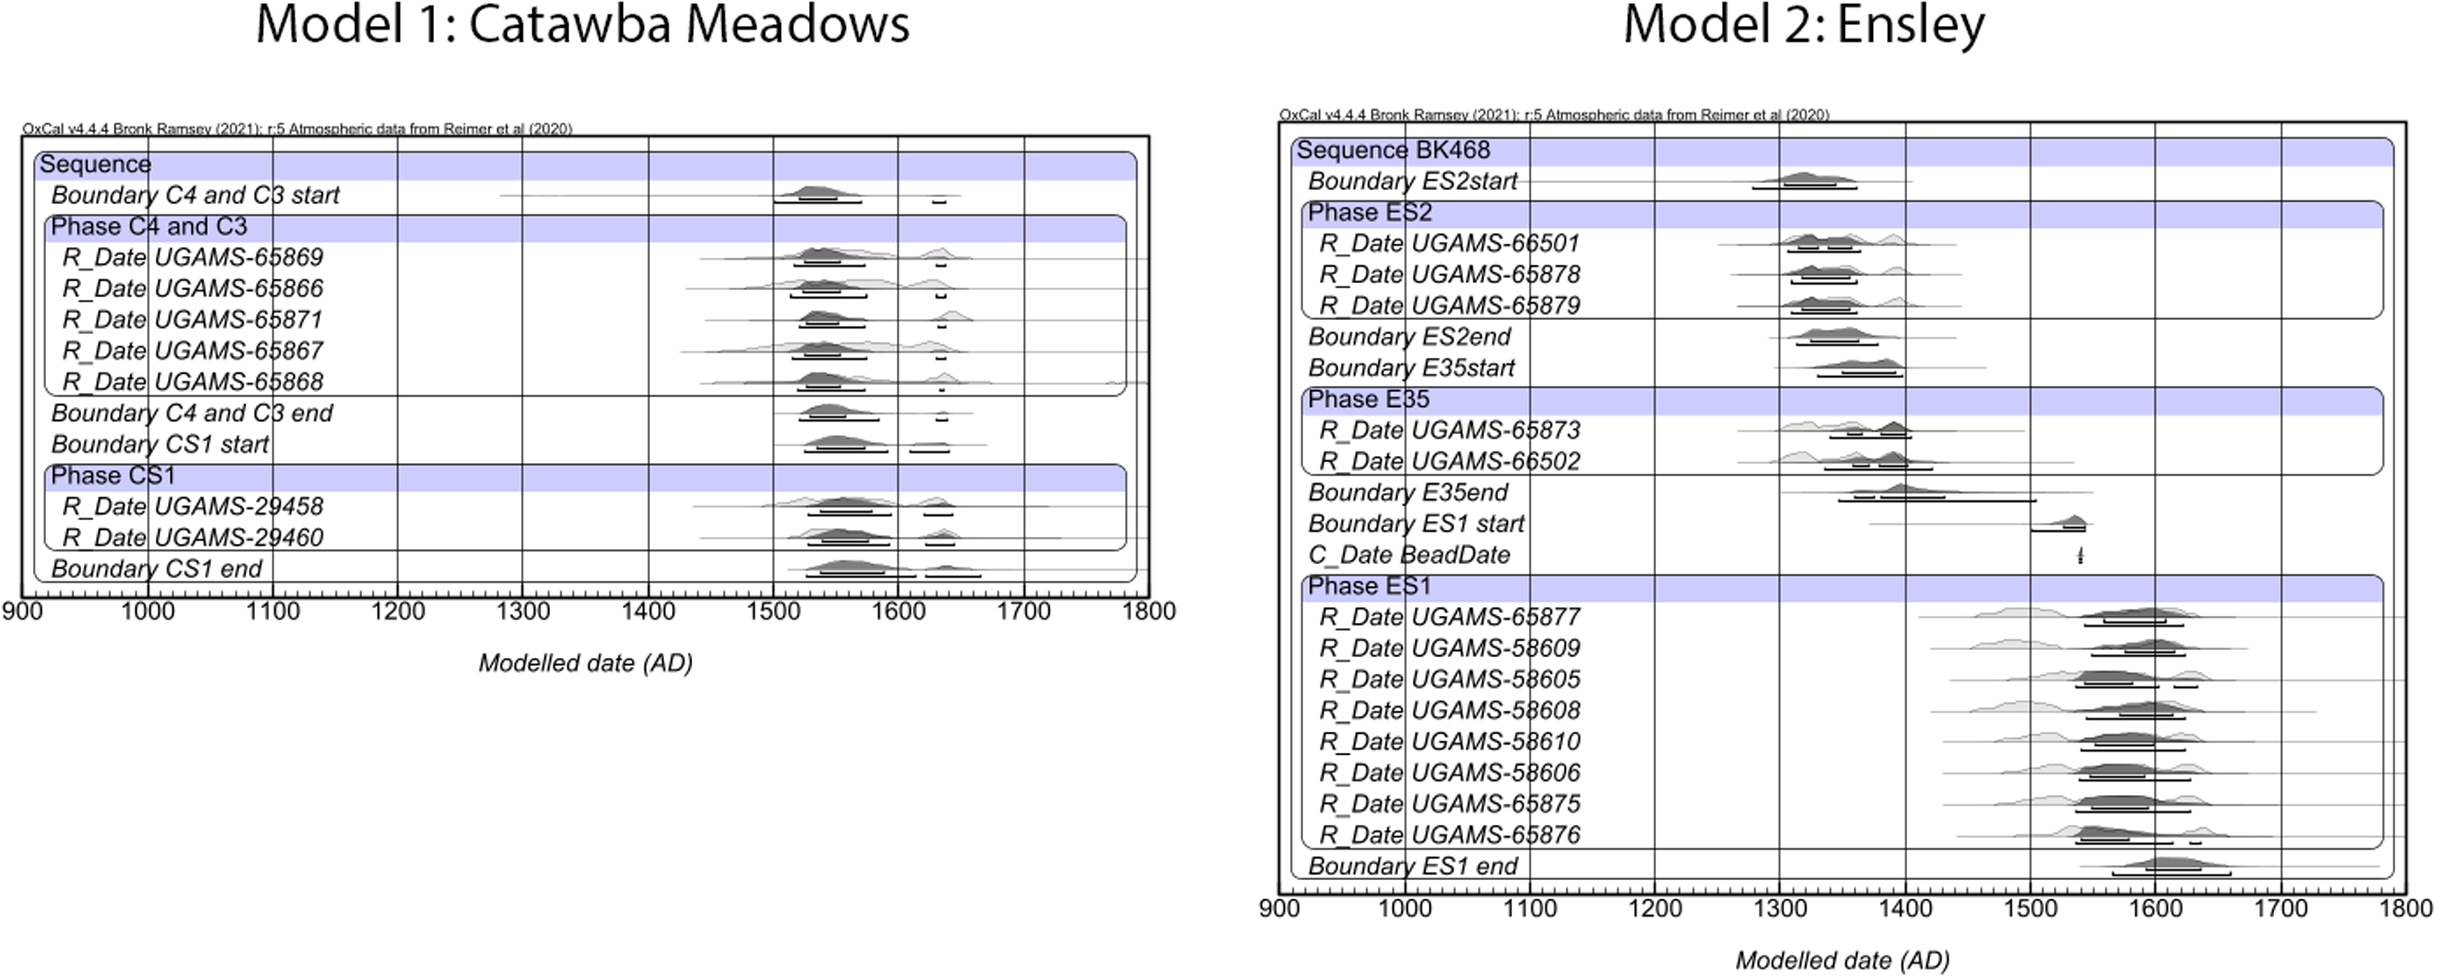
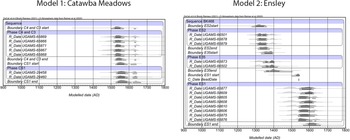
The AMS 14C data from Catawba Meadows is sourced from three separate contexts within the site; CS1 and the two pit features (C3 and C4). There is no stratigraphic information to relate these contexts beyond the ceramic material evidence, which suggests that they were probably all affiliated with a similar occupational sequence. As noted earlier, the samples from CS1 cannot be ordered with stratigraphic sequencing as the structure appears to have only one stage; C3 and C4 did have internal stratigraphy. Using certain priors, including the interpretation that C3 and C4 were simultaneously filled, single deposition events, Model 1 organized Catawba Meadows data into one sitewide Sequence with two Phases (Figure 4): “Phase C4 and Phase C3,” and “Phase CS1.” Three samples, UGAMS-29459, UGAMS-65865, and UGAMS-65870, continuously returned low agreement indices individually in OxCal, indicating they were likely statistically anomalous measurements and were removed from the model. The resulting model, with an overall agreement index of about 110% estimates a range for the pair of features (C4 and C3) from about cal AD 1515 to 1640 (95.4% hpd) and a modeled range of cal AD 1525 to 1645 (95.4% hpd). While these are still admittedly long date ranges, these data suggest that the Catawba Meadows occupation likely has a late 16th-century component representing an occupation during and after the violent expulsion of an attempted Spanish colonial presence at the nearby Berry site in 1569.
odels 1 (Catawba Meadows) and 2 (Ensley). Dark-shaded distributions indicate modeled probability, light shaded are unmodeled. The brackets under the modeled distributions indicate 68.3% and 95.4% high posterior density (hpd) ranges. Data modeled in OxCal 4.4.4 (Bronk Ramsey Reference Bronk Ramsey2009a) with IntCal20 (Reimer et al. Reference Reimer, Austin, Bard, Bayliss, Blackwell, Bronk Ramsey, Butzin, Cheng, Edwards, Friedrich, Grootes, Guilderson, Hajdas, Heaton, Hogg, Hughen, Kromer, Manning, Muscheler, Palmer, Pearson, van der Plicht, Reimer, Richards, Scott, Southon, Turney, Wacker, Adolphi, Büntgen, Capano, Fahrni, Fogtmann-Schultz, Köhler, Kudsk, Miyake, Olsen, Reinig, Sakamoto, Sookdeo and Talamo2020), and with curve resolution of 5 years. (Model Indices: Catawba Meadows: Amodel = 109.1, Aoverall = 110.1, Ensley: Amodel = 100.8, Aoverall = 100.1).
Model 2: Ensley
Unlike Catawba Meadows, material and unmodeled AMS 14C data suggested that Ensley had a longer occupation, involving at least two material practices and 16th-century Spanish artifacts. The samples collected directly from the fill of ES1 were primarily informed by stratigraphic sequencing for the Phase model (“Phase ES1”). Throughout the final stage of ES1, three small blue glass beads, two small copper-alloy aglets, and two fragments of rolled copper or brass were identified. While there is certainly a chance that the copper-alloy artifacts are Native-sourced, the glass beads are decidedly European and appear morphologically similar to the beads identified from the Spanish compound at Berry (Beck et al. Reference Beck, Rodning and Moore2016). This allows for the addition of a conservative terminus post quem (TPQ) of AD 1540; the date of Soto’s arrival in interior North Carolina and the earliest calendrical date possible for a glass bead to appear in the Western North Carolina Piedmont. Along with the presence of Burke ceramics, the final stage of ES1 was then expected to postdate 1540. This TPQ, applied in the model as a “C_Date” function, assisted in cutting the bimodal estimates of the ES1 samples, a consistent issue in 16th-century contexts (Figure 4).
The other two sampled contexts at Ensley, ES2 and the pit feature E35, provided both complex stratigraphic and material data as well as far earlier estimated ranges than ES1. ES2, the smaller round structure, had an intrusive pit feature (E38) with material culture (Burke pottery) and a measured radiocarbon estimate (UGAMS-65877) which placed the feature broadly within the same context as ES1 (the 16th century) and was thus included in the ES1 Phase of the model. Dates from ES2 were organized in their own Phase (“Phase ES2”) in stratigraphic order, due to their initial estimates and the indications that the structure’s construction appeared very different from ES1 and more in line with earlier Late Woodland period structures. Dates from Feature E35 were similarly modeled in their own Phase (“Phase E35”) based on the pit’s stratigraphic position below ES1 and the inclusion of Pisgah ceramic materials. One of the three samples from this context, UGAMS-65874, was collected at the bottom of E35 and returned unmodeled estimates nearly 300 14C years later than the other two. This difference can be accounted for in at least two scenarios: the sample returned an anomalous estimate, or the ashy layer above this sample represents a deposition of old ash from an earlier occupation. In either case, UGAMS-65874 was removed from the final Ensley model as an anomaly. Similarly, sample UGAMS-65872, taken from the top stratigraphic zone of ES1, produced continued low agreement indices and was also removed from the final version of Model 2 as an anomaly. The zone it was affiliated with, Zone A/B was impacted by recent centuries of agriculture and may have influenced these anomalous estimates. The results of Model 2, with an overall agreement index of around 101% suggest that ES2 was burned sometime between cal AD 1305 and 1365 (95.4% hpd), the ash layer of E35 ranges from cal AD 1340 to 1405 (95.4% hpd), and ES1’s final phase ranges from cal AD 1540 to 1640 (95.4% hpd).
Model 3: Joara
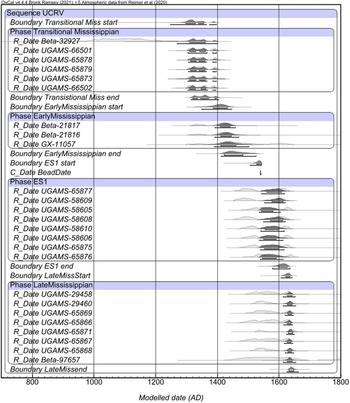
With the above Catawba Meadows and Ensley data modeled, we can now turn to a broader Bayesian model of the Upper Catawba River valley, including not only recent AMS 14C data (Thorpe et al. Reference Thorpe, Hoover and Rodning2018; Pigott Reference Pigott2024) but legacy radiocarbon data collected from related sites in the region including radiometric data with large probability margins (Eastman Reference Eastman1994a, Reference Eastman1994b; Moore Reference Moore2002; Ward Reference Ward1977). It should be noted with this model series that many of the included sites only have a small number of radiocarbon measurements, which generally does not provide an ample estimation of the occupational histories of these sites. Six samples were excluded from Model 3 (Beta-21818, UGAMS-29459, UGAMS-65865, UGAMS-65870, UGAMS-65874, and UGAMS-65872). The original excavators of the McDowell site (31MC41) suggested that Beta-21818 was likely an erroneous date due to its unexpected early age in relation to its stratigraphic location and association with Burke, Pisgah, and McDowell ceramics (Ward Reference Ward1977). As discussed above, UGAMS-29459, UGAMS-65865, and UGAMS-65870 were removed as anomalous estimates from Model 1 and UGAMS-65874 and UGAMS-65872 were already removed from Model 2 as anomalous dates and were thus excluded from Model 3 as well.
In constructing this region-wide model, Phases were associated with sites, and within that, context and stratigraphy. For example, the three Phases developed for Ensley from Model 2 were maintained in Model 3. Additional Phases related by material culture were developed from legacy data: “Phase Transitional Mississippian” included the early sample from Tyler-Loughridge (Beta-32927) and the data from Ensley’s ES2 (UGAMS-66501, UGAMS-65878, UGAMS-65879, UGAMS-65873, and UGAMS-66502) and “Phase Early Mississippian” involved dates from Berry (Beta-21816 and Beta-21817) and McDowell (GX-11057). These two Phases would be strengthened with additional data for a later study. The single Broyhill date was also included in this model in “Phase Late Mississippian” due to its ceramic association. Although the Broyhill site is located in the Upper Yadkin River drainage, the site is likely chronologically and culturally affiliated with Joara. It has a Mississippian structure and Burke ceramics and sits within a projected model of the Joara polity constructed through a modified Tobler’s Hiker Function in ArcGIS (Pigott Reference Pigott2024, 65).
This region-wide model allowed for further refinement of the data presented above. Catawba Meadow’s occupation was adjusted to an estimated range of AD 1610 to 1650 (95.4% hpd). This also adjusted the estimated range for the single sample at Broyhill, which was refined to cal AD 1610 to 1655 (95.4% hpd), supported by its association with Burke material culture and the occupations within the Catawba valley, particularly the age estimates at Catawba Meadows. Overall agreement indices of this model are about 113%. These results illustrate an occupational landscape of the Upper Catawba River valley spanning five centuries, from cal AD 1245 through 1655 (Figure 5). An alternative model (Model 3a) available in the supplementary data, completely removed the Broyhill Phase due to its wide distribution. It resulted in little change to the overall estimates in site occupations. From these two models the opportunity is apparent for collecting new AMS samples from Broyhill to refine the ranges at this site, which could contribute greatly to a regional chronology, but right now a single wide-ranging estimate does little to refine the regional data.
Model 3 (Joara). Dark-shaded distributions indicate modeled probability, light shaded are unmodeled. The brackets under the modeled distributions indicate 68.3% and 95.4% high posterior density (hpd) ranges. Data modeled in OxCal 4.4.4 (Bronk Ramsey Reference Bronk Ramsey2009a) with IntCal20 (Reimer et al. Reference Reimer, Austin, Bard, Bayliss, Blackwell, Bronk Ramsey, Butzin, Cheng, Edwards, Friedrich, Grootes, Guilderson, Hajdas, Heaton, Hogg, Hughen, Kromer, Manning, Muscheler, Palmer, Pearson, van der Plicht, Reimer, Richards, Scott, Southon, Turney, Wacker, Adolphi, Büntgen, Capano, Fahrni, Fogtmann-Schultz, Köhler, Kudsk, Miyake, Olsen, Reinig, Sakamoto, Sookdeo and Talamo2020), and curve resolution of 5 years. Model Indices: Amodel = 108.9, Aoverall = 108.3.
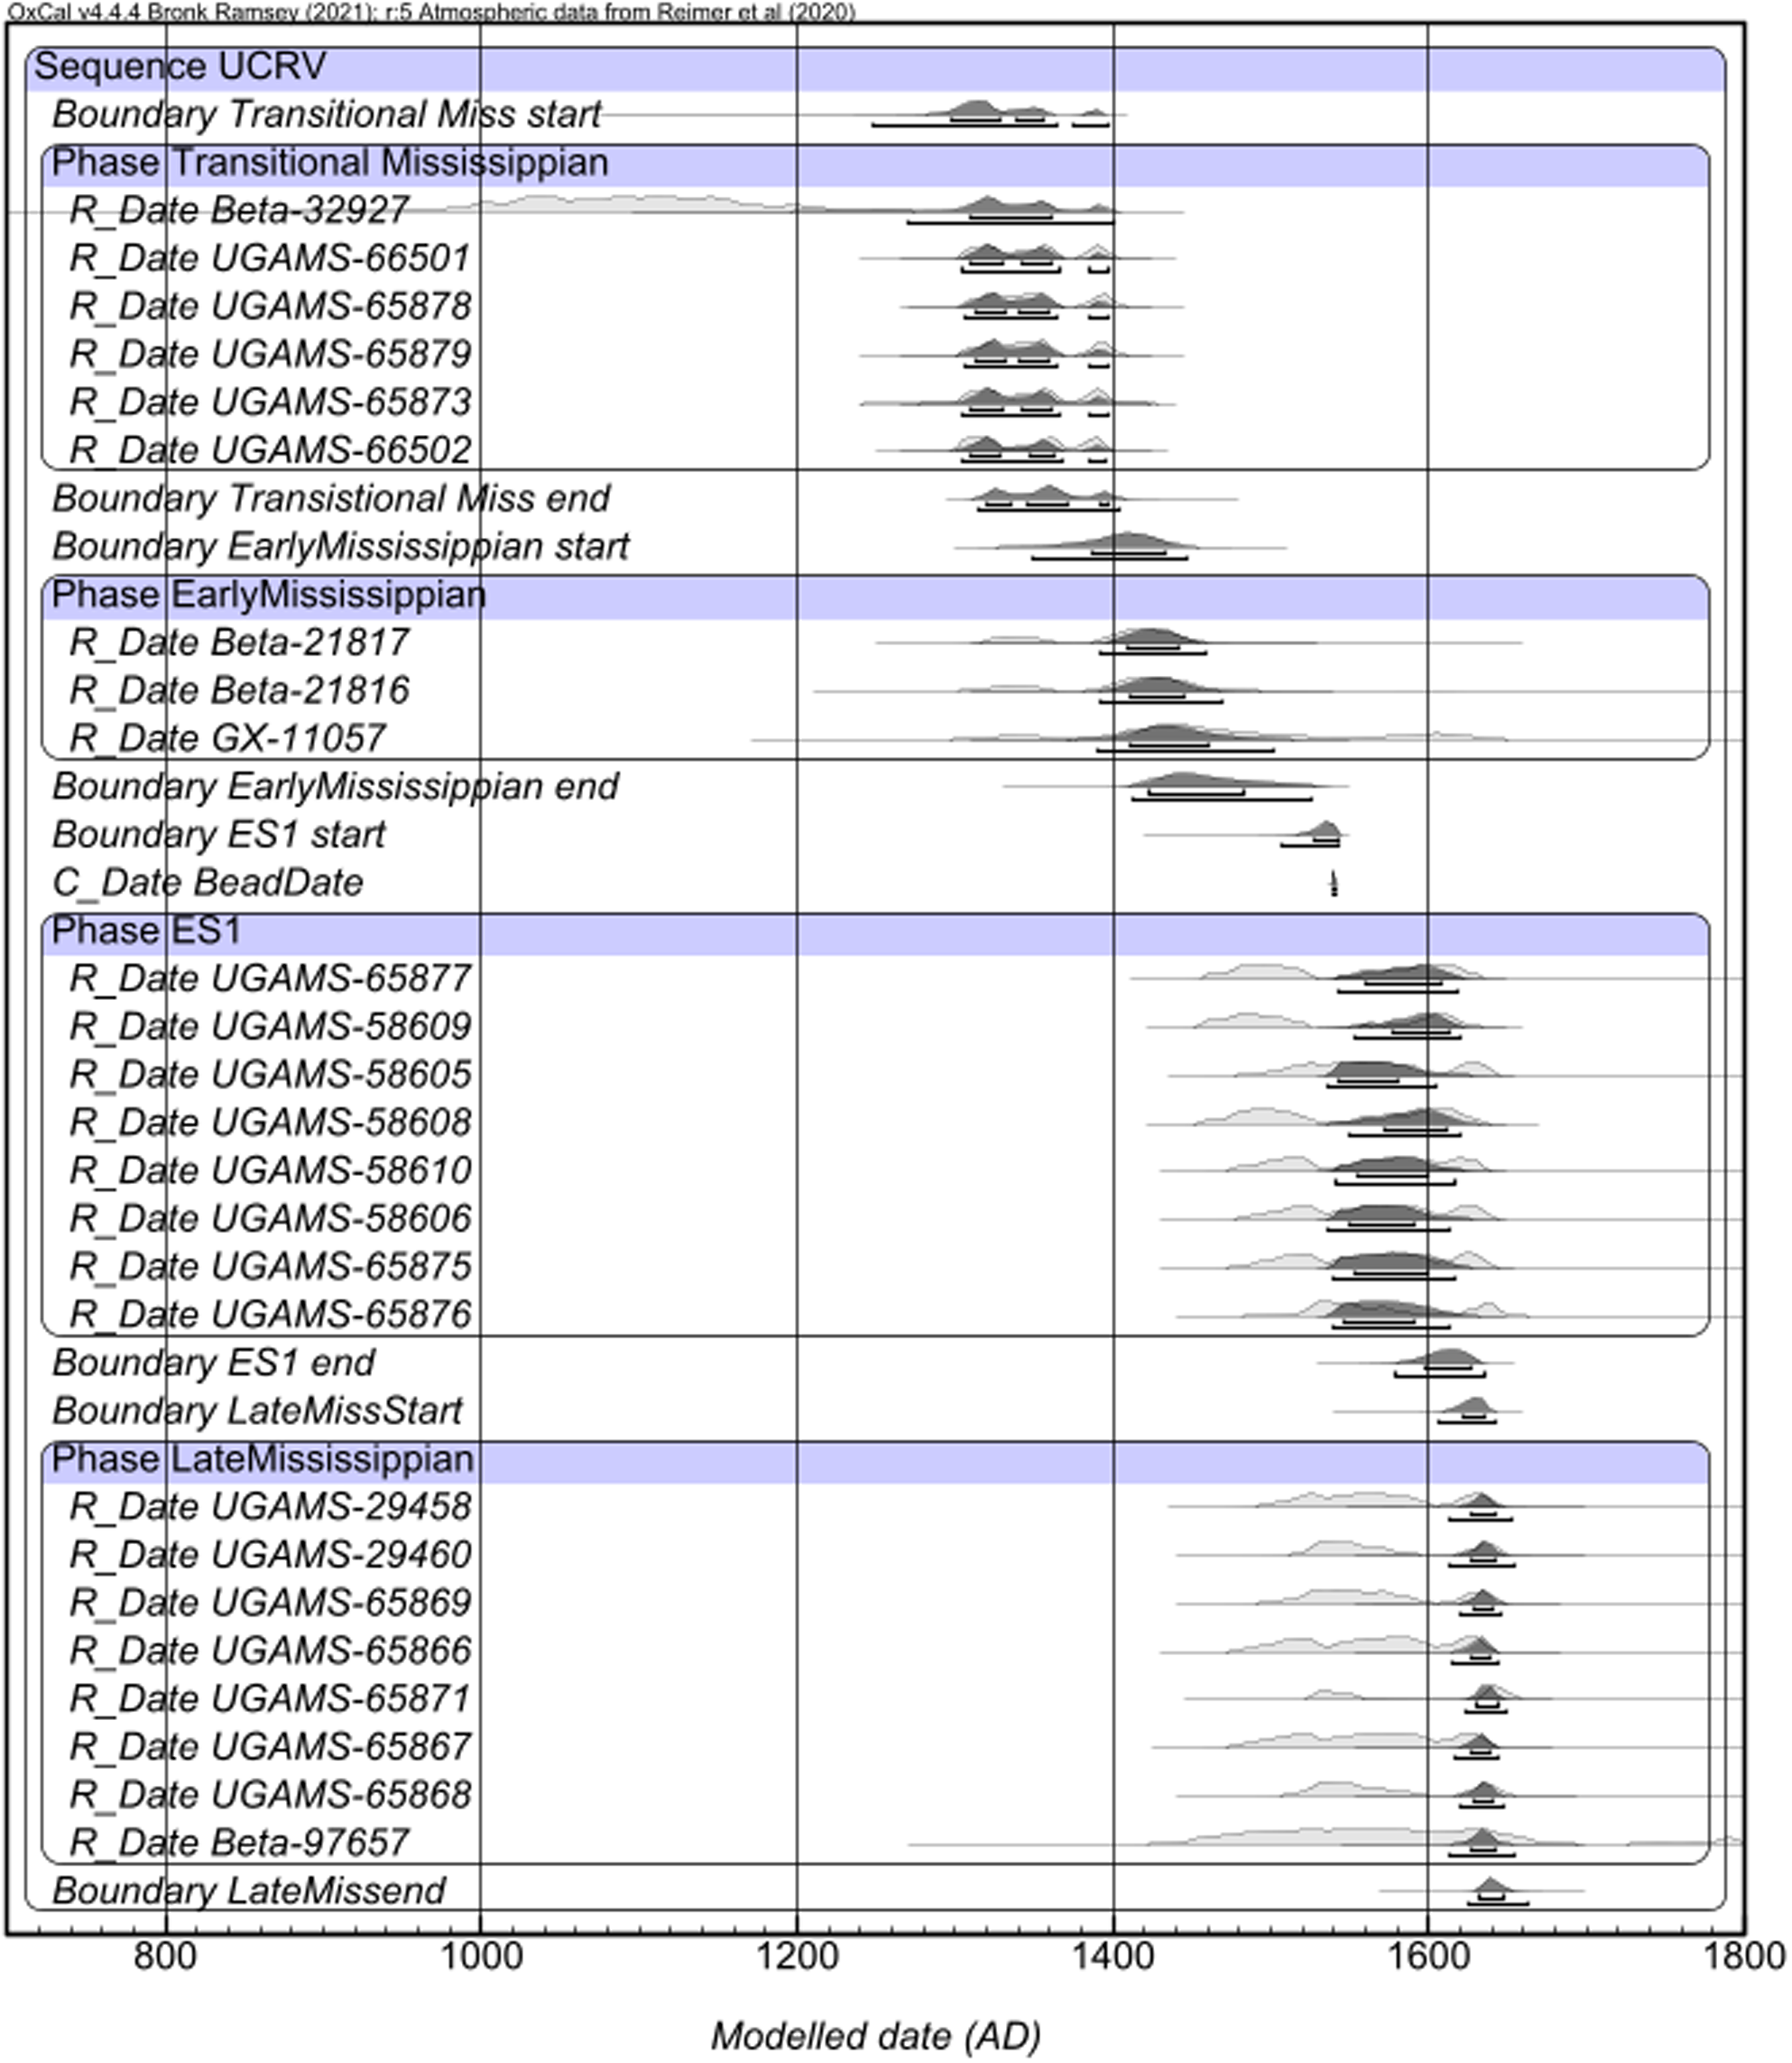
Model 4: Lower Catawba River valley
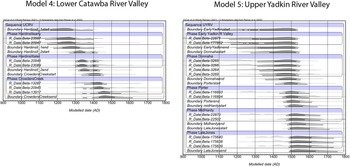
In an attempt to create a comparable dataset from a nearby region, I created a preliminary model for the Lower Catawba River valley region (Figure 6). I followed the same parameters used in the production of Model 3, made possible by published legacy radiocarbon data from the Hardins II (GS30) and Crowders Creek (GS55) sites. While there are fewer dates available and these data have higher uncertainty values, as they were radiometric radiocarbon samples, Model 4 can be used as a proof-of-concept for the feasibility of Bayesian chronologies in the region. These data were organized by Phases related to published site occupational and material data, including initial researchers’ suggestion that Hardins II likely had two occupations. One sample from the Hardins II site (Beta-23088) was removed from the model due to anomalous estimates. Excavations at Hardins II were impacted by extensive erosion and pothunting throughout the 20th century; this sample may have been impacted by these disturbances (Mathis Reference Mathis1980). At an overall agreement index of about 86%, Model 4 indicates there is an extensive range of occupation represented at these two sites. The model suggests that Hardins II’s two occupations range from cal AD 1130 to 1405 (95.4% hpd), an admittedly long span, and cal AD 1300 to 1435 (95.4% hpd). The Crowders Creek Phase spans from cal AD 1350 to 1555 (95.4% hpd), another long range. These are generous conclusions from this model: the estimates could be strengthened by additional AMS radiocarbon samples and a deeper analysis of associated stratigraphy and material culture, for example targeting features to explore whether the interpretation of two occupations at these places is feasible.
Models 4 (Lower Catawba River valley) and 3 (Upper Yadkin River valley). Dark-shaded distributions indicate modeled probability, light shaded are unmodeled. The brackets under the modeled distributions indicate 68.3% and 95.4% high posterior density (hpd) ranges. Data modeled in OxCal 4.4.4 (Bronk Ramsey Reference Bronk Ramsey2009a) with IntCal20 (Reimer et al. Reference Reimer, Austin, Bard, Bayliss, Blackwell, Bronk Ramsey, Butzin, Cheng, Edwards, Friedrich, Grootes, Guilderson, Hajdas, Heaton, Hogg, Hughen, Kromer, Manning, Muscheler, Palmer, Pearson, van der Plicht, Reimer, Richards, Scott, Southon, Turney, Wacker, Adolphi, Büntgen, Capano, Fahrni, Fogtmann-Schultz, Köhler, Kudsk, Miyake, Olsen, Reinig, Sakamoto, Sookdeo and Talamo2020), and with curve resolution of 5 years. Model Indices: Lower Catawba River valley: Amodel = 86.3, Aoverall = 86.8, Upper Yadkin River valley: Amodel = 95.1, Aoverall = 93.9.
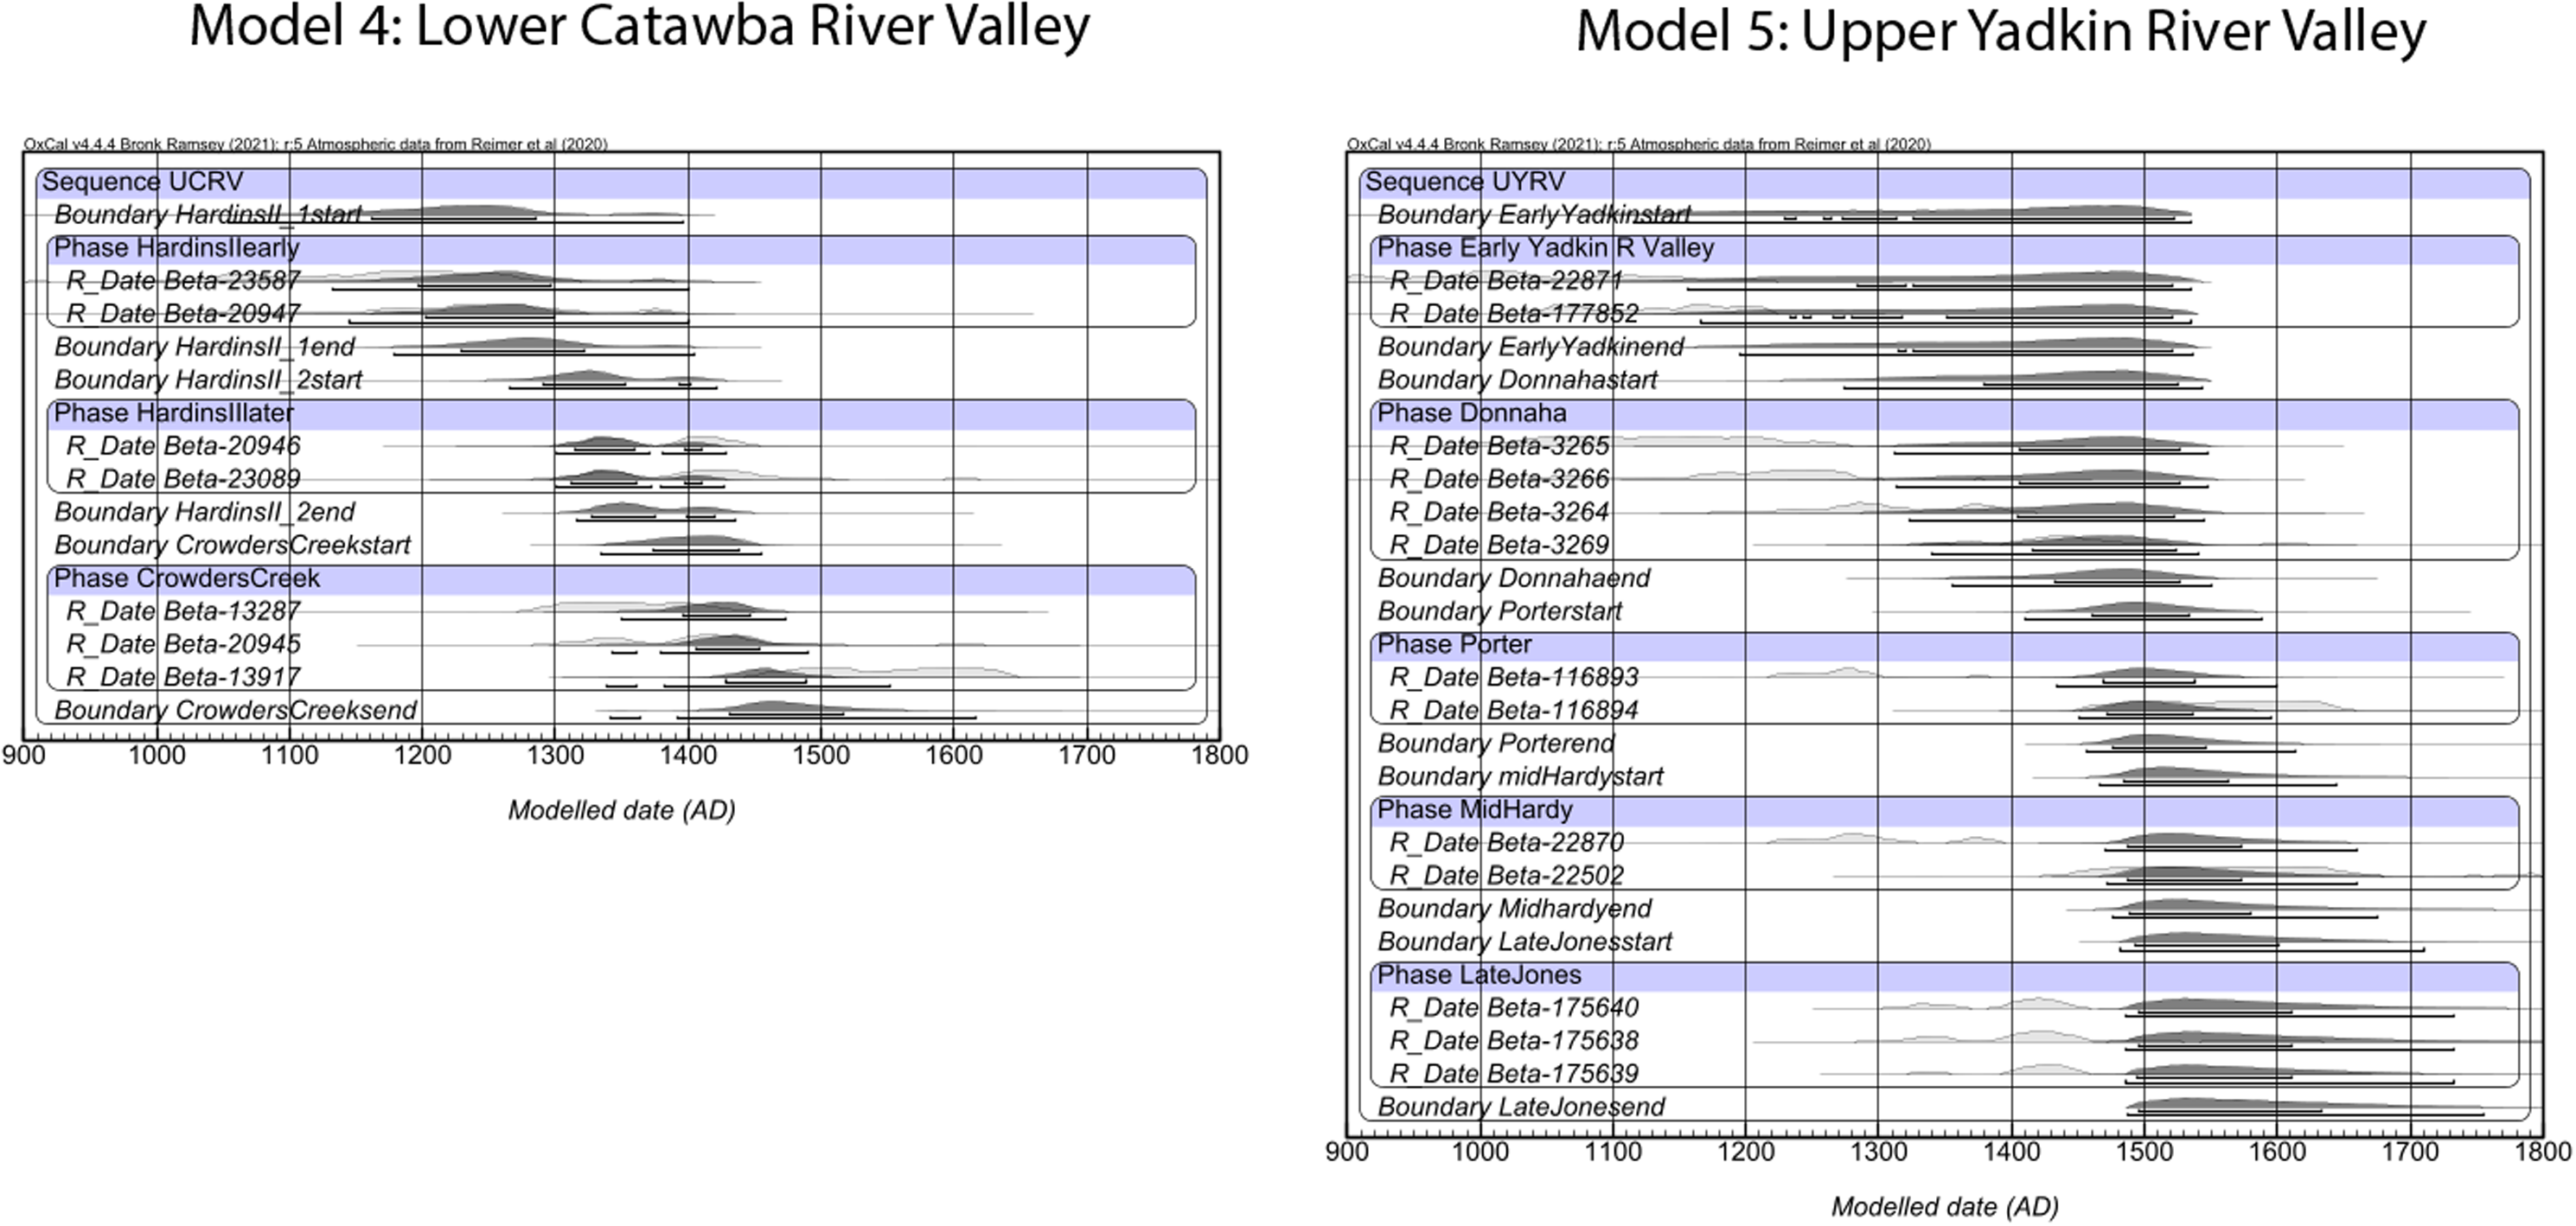
Figure 6. Long description
Two graphs depict modeled dates for sequences in the Lower Catawba River Valley and Upper Yadkin River Valley. Panel A: Model 4 for the Lower Catawba River Valley. This graph shows a sequence of modeled dates from 900 to 1800 AD. The x-axis represents the modeled date in AD, and the y-axis lists various sequences and phases. Dark-shaded distributions indicate modeled probability, while light-shaded areas are unmodeled. The brackets under the modeled distributions indicate 68.3% and 95.4% high posterior density (hpd) ranges. Key sequences include UCRV, Phase Hardinslearly, Phase Hardinslate, and Phase CrowdersCreek. Panel B: Model 5 for the Upper Yadkin River Valley. This graph also shows a sequence of modeled dates from 900 to 1800 AD. The x-axis represents the modeled date in AD, and the y-axis lists various sequences and phases. Dark-shaded distributions indicate modeled probability, while light-shaded areas are unmodeled. The brackets under the modeled distributions indicate 68.3% and 95.4% high posterior density (hpd) ranges. Key sequences include UYRV, Phase Early Yadkin R Valley, Phase Donnaha, Phase Porterend, Phase MidHardy, and Phase Late Jones.
Model 5: Upper Yadkin River valley
The Upper Yadkin River valley data produced a workable model to test the feasibility of new AMS data collection in the region (Figure 6). Model 5 was developed much in the same way as Model 4, however there were more published legacy data available. In addition, every sample in Model 4 was unidentified wood charcoal. This model was developed from data collected at 4 sites and Phases were created based on material and stratigraphic data. The Jones site was the only Yadkin site to contain some Burke ceramics and those dates were arranged in their own Phase (“LateJones”) separate from the sample related to PVT ceramic styles (Beta-177852). Unlike Broyhill, Jones is located outside of the projected Joara polity and was therefore included in Model 5. The site’s cultural materialalso appears to be more hybridized, involving PVT and Burke style ceramics. Only one sample was excluded from Model 5. Beta-175641 was noted by original researchers to have problematic estimates related to its associated cultural material and stratigraphy (Woodall Reference Woodall2009) and was considered an outlier for Model 5.
The results of Model 5 illustrate the constant issues with resolving radiocarbon estimates during the 15th through 17th centuries. The radiometric charcoal data likely contributed to the long estimates illustrated in this model. This entire sequence is rather broad, running from as early as cal AD 1050 (95.4% phd) through the 17th century. The Jones site samples affiliated with Burke and Pisgah material culture pushed the model’s range late, producing an estimated range of cal AD 1485–1735 (95.4% hpd). The 1 sigma range of the Jones Phase, however, narrows it to about cal AD 1490–1635, suggesting that with additional new data the Jones site may align with Upper Catawba River valley contexts at the McDowell, Berry, and Ensley sites. An alternative model available in the supplementary material that included Broyhill (Model 5a) nominally adjusted the estimates for the Jones Phase, but do point to the opportunity in collecting new AMS data from these sites to strengthen the chronological estimates in local site occupations. Contexts associated with PVT ceramics and structures at Donnaha (cal AD 1295–1545, 95.4% hpd) and Porter (cal AD 1430–1600, 95.4% hpd) have rather broad estimates. However, it should be noted that AMS C14 of a PVT site along the Yadkin’s Great Bend region, Forbush Creek, was recently published (Paul Reference Paul2023) and was not included in this model. From Model 5 and the new data from Forbush Creek, there is a clear opportunity in developing a radiocarbon dating project focused on the relationship between Mississippian and PVT peoples along the Yadkin River that could narrow these ranges significantly.
Conclusion and discussion
Joara’s history
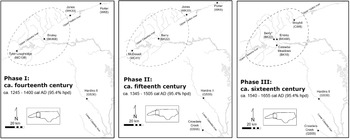
The results of these models point to a deep and persistent history for the people of Joara and their neighbors, uninterrupted by 16th-century Spanish entradas. Returning to the questions posed at the start of this article: how did the Indigenous landscape encountered by 16th-century Spaniards develop and how long did it persist after they were removed from it? Model 3, the preliminary chronology of Joara, serves as the core to discuss these questions. As it incorporates radiocarbon data from places across the Upper Catawba River valley, associated with the Burke pottery practice and Mississippian structures, this model can start to address both the expansion of the South Appalachian Mississippian cultural sequence and the persistence beyond Soto and Pardo. Model 3 can be broadly organized into three chronological phases highlighting the historical development of Joara’s rise to prominence in the 16th century and persistence after 1569 (Figure 7).
Map of proposed chronological phases identified in the preliminary Bayesian models; dotted line indicates proposed limits of Joara chiefdoms (figure by author).
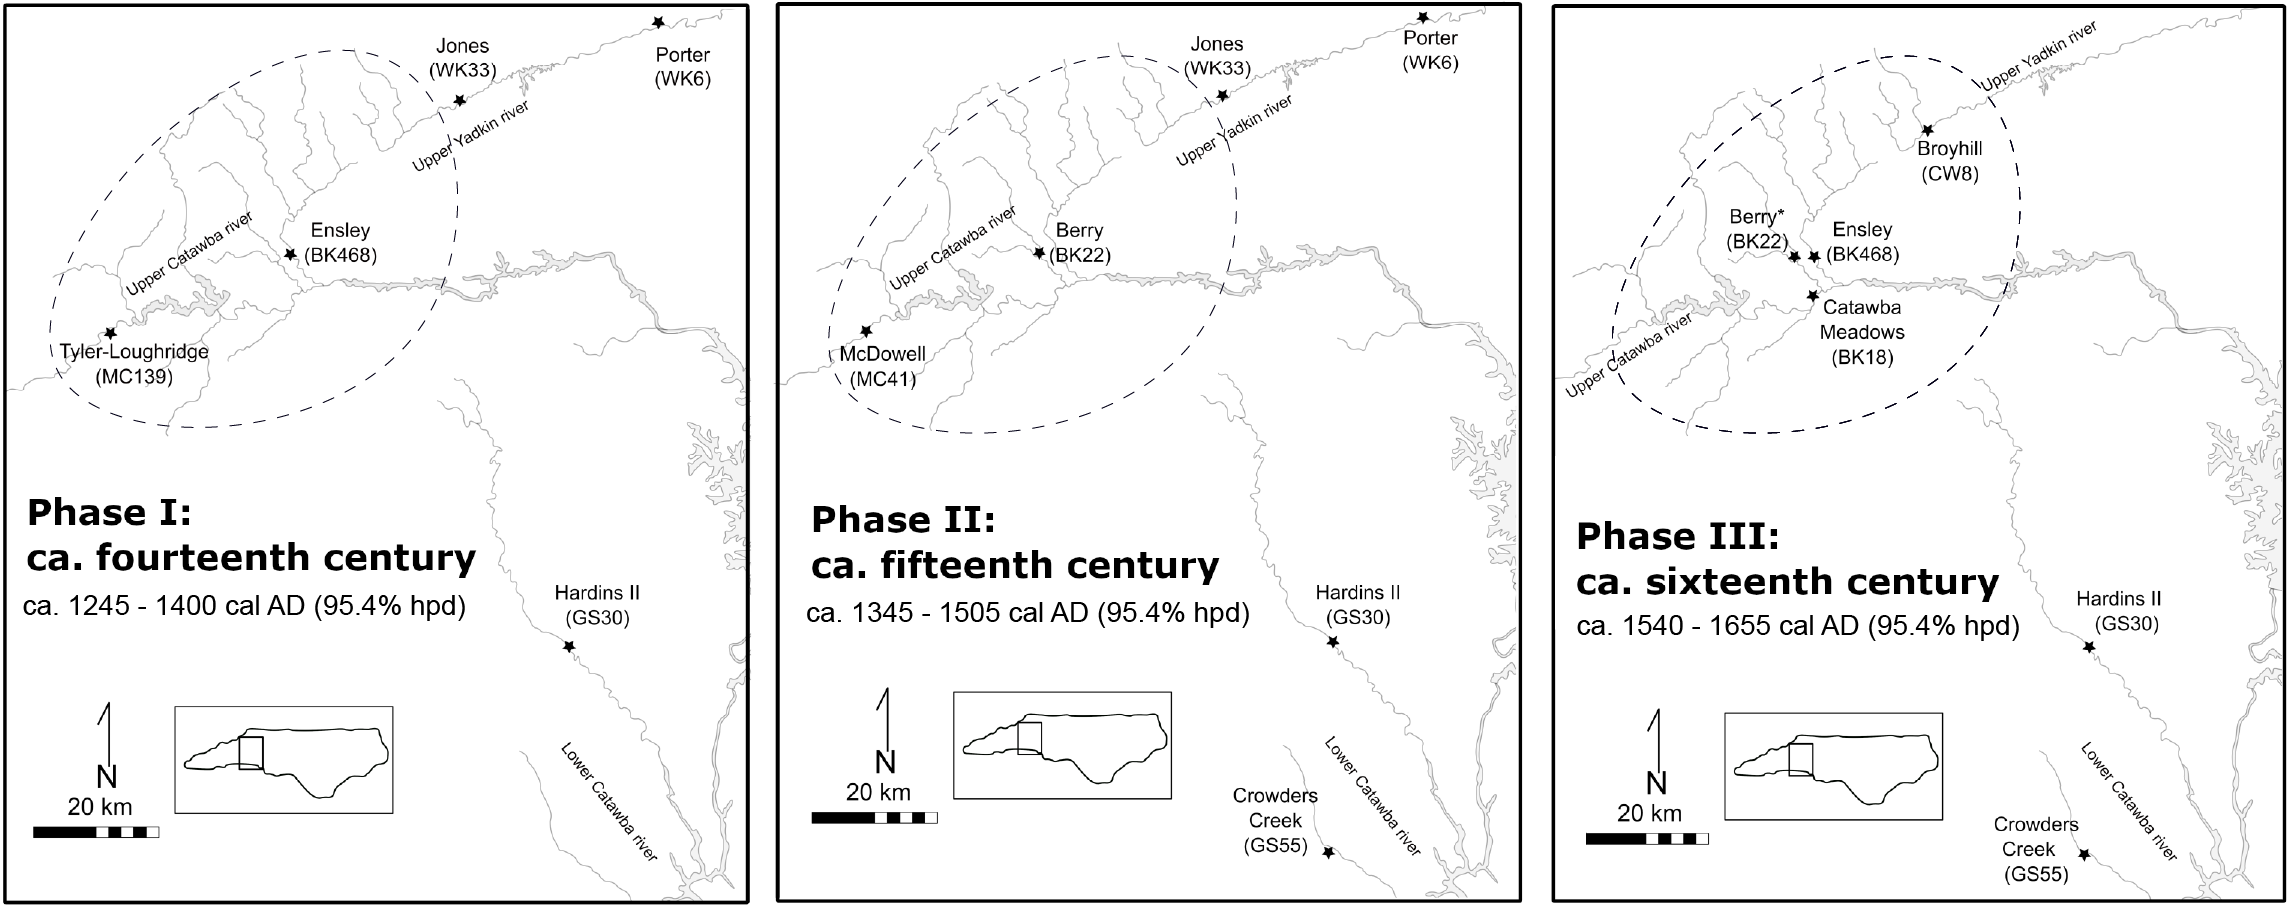
The earliest phase is characterized by contexts at the Tyler-Loughridge and Ensley sites ranging from about cal AD 1245–1400 (95.4% hpd). The material contexts at these sites, notably ES2 and Feature E35, as well as Feature 102-1 at Tyler-Loughride, are dominated by Pisgah-style ceramics and Woodland-style structures. These occupations likely align with the transitional period during the earliest Mississippian expansion across the South Appalachians (Ferguson Reference Ferguson1971). This early phase is parallel to the earliest occupations examined in the Lower Catawba valley region (the Hardins II site) and the Upper Yadkin River valley (the Jones and Porter sites). The contexts related to this period would benefit from additional radiocarbon sampling to better understand this period, as a range of 300 years is admittedly not refined. In addition, the factors that facilitated such a cultural shift in the Western North Carolina Piedmont are currently not well explored; new research into this subject would greatly contribute to broader questions surrounding the nature of the expansion of the Mississippian World across the North American Southeast.
Ranging from cal AD 1345–1505 (95.4% hpd), there is next a chronological phase characterized by contexts at McDowell and Berry. The AMS data from Berry are taken from pits with Burke material culture, whereas the McDowell context is associated with a mix of ceramic materials including Burke, Pisgah, and “McDowell” ceramics (Moore Reference Moore2002, 73), perhaps highlighting a transitional phase of ceramic practice in the Upper Catawba River valley as the Mississippian World takes hold in the region. A planned AMS sampling project at Berry (Rodning et al. Reference Rodning, Moore, Briggs and Beck2025) will add several new data to the Berry sequence and likely narrow the broad estimates associated with this occupation. For now, we can interpret this second chronological phase as a rising Mississippian cultural sequence prior to the 16th-century interactions that tend to dominate the archaeological narrative of the region.
Finally, there is a Late Mississippian chronological phase characterized by contexts at Ensley, Catawba Meadows, and Broyhill, ranging from about cal AD 1540 to as late as 1655 (95.4% hpd). All three of these contexts are connected to Burke material culture and Mississippian architecture. The Broyhill date is somewhat problematic in this sequence and as discussed above, the site’s local chronology would benefit from additional AMS samples to refine the single estimate. However, even with Broyhill removed, data from Ensley and Catawba Meadows highlight an occupied landscape during and after the well-documented Spanish entradas. Importantly, the Catawba Meadows site, which has no European materials, is estimated to be not only contemporaneous to 16th-century Indigenous-Spanish interactions, it may post date these events as well. This alone highlights the importance of AMS 14C methods in contextualizing Late Mississippian places. While much broader in estimates, Models 4 and 5 add to this pattern on a regional scale, illustrating that these regions were clearly occupied during the same centuries and that much of the Western North Carolina Piedmont was occupied through the 16th century AD.
Conclusion
The AMS 14C data and preliminary models presented here suggest two important takeaways. First, AMS 14C data, supported by Bayesian methodologies, are not only possible, but important contextual evidence for Late Mississippian occupations in the American Southeast. While the models presented in this text are generally simple, they point to an opportunity in expanding such a research program within the archaeological landscape of the 15th through 16th centuries. These centuries are significant on two levels for researchers; they comprise the initial encounters between Indigenous and European nations in North America and they are covered by a series of plateaus and reversals on the calibration curve. While these models are in many ways proof-of-concept for the Western North Carolina Piedmont, they contribute to a growing body of literature that demonstrates that we can pull meaningful data from these centuries in spite of calibration challenges.
Secondly, these data point to a Western North Carolina Piedmont that has a complex and long-lived political landscape, characterized by periods of persistence, instead of impermanence. Past archaeological and historical interpretations of the region have suggested a somewhat chronologically piecemeal cultural landscape; a vague knowledge of impermanent sites pre-dating the 14th century, before more recently established settlements of sedentary agriculturalists appear (Beck and Moore Reference Beck and Moore2002; Ferguson Reference Ferguson1971) and were soon ruptured by the sudden appearance of European foreigners in the 16th century (Merrell Reference Merrell1989; Hudson Reference Hudson2017). The models presented above populate a cultural landscape which was recorded by Spanish chroniclers in the 16th century, but there are occupations that span before and after the entradas. Prior to this work, much of our knowledge of the Indigenous history of this region was isolated to site reports, extensive work at the Berry site, and ethnohistoric data which all individually suggested a complex chronology reaching through time beyond the Spanish entradas of Soto and Pardo. The combination of legacy and new radiocarbon data presented here indicate the opportunities that Late Mississippian archaeological sites present to large-scale chronological modeling, even with the calibration curve’s 16th-century challenges.
Regional chronological models in the 16th-century American Southeast are in their fledgling stages but have presented promising results in both the Middle Cumberland Region (Cobb et al. Reference Cobb, Krus, Deter-Wolf, Smith, Boudreaux and Lieb2024; Krus and Cobb Reference Krus and Cobb2018) and Northern Georgia (Holland-Lulewicz et al. Reference Holland-Lulewicz, Thompson, Wettstaed and Williams2020). In the region of Joara, new data from the extant collections of McDowell and Broyhill could fill in some of the apparent gaps in this preliminary chronology related to the early expansion and persistence of the Mississippian World in the Western North Carolina Piedmont. There is also further opportunity to collect additional AMS data to refine the microhistory of Ensley, which itself points to a persistent occupation reaching back towards the initial expansion of Mississippian settlement in the region. A forthcoming radiocarbon research program at the Berry site (Rodning et al. Reference Rodning, Moore, Briggs and Beck2025) will elucidate Indigenous contexts at the site, both as another microhistory complicated by Spanish occupation, as well as the site’s chronological relationship to places like Catawba Meadows and Ensley.
With a preliminary model of AMS 14C data in the Upper Catawba River valley presented here, a complex, long-lived political landscape emerges, connecting the 16th-century Joara chiefdom described in ethnographic records to a deeper history of occupation, persistence, and change spanning from at least the 11th through the 17th centuries AD. Combined with previous archaeological data and Spanish texts, these preliminary models also suggest that many Western North Carolina Piedmont sites persisted beyond Spain’s brief colonial attempt. These data, compared to the neighboring regions of the Upper Yadkin and Lower Catawba river valleys, illustrate a complex social geography, developed out of many generations of continuity and change. They highlight the power of AMS data in connecting the Indigenous Late Mississippian World with the expansion of the post-medieval European world, decentering the colonial histories that often dominate the narrative of 16th-century North America.
Supplementary material
The supplementary material for this article can be found at https://doi.org/10.1017/RDC.2026.10265.
Data availability statement
OxCal data are available in a supplementary file with this work. The referenced materials analysis is freely available within the author’s PhD dissertation, digitally curated by the Howard Tilton Memorial Libraries at Tulane University.
Acknowledgments
The author would like to respectfully acknowledge the Native places upon which most of this research was conducted and written. Warren Wilson College, where the author spent months researching and handling artifacts, is within the ancestral homelands of the Cherokee people, who called the area Suwa′lĭ-Nûñnâ′hĭ, or the path to the Suwali (Joara). Morganton, North Carolina, where the author lived and worked through much of the project’s data collection, was once home to Joara, one of many ancestral towns to the Catawba Indian Nation, who now maintain lands in Rock Hill, South Carolina. The author would like to thank Christopher B. Rodning, David Moore, Rachel V. Briggs, and Robin Beck for their support in field and lab research which led to much of the data presented here as well as the anonymous peer reviewers and the author’s sister, Eileen Pigott, who offered valuable insights for this article. Special thanks to Carla Hadden at the UGA CAIS and Jennifer Birch at UGA for their guidance in sampling strategies and suggestions for Bayesian models. All errors within the Bayesian Models and sampling strategies are the author’s own.
Funding statement
The research presented here was funded by the Southeastern Archaeological Conference’s Charles Hudson Award, the Connolly Alexander Institute for Data Science Summer Graduate Award, the Tulane University School of Liberal Arts Summer Research Award, the Tulane University Stone Center for Latin American Studies, and the Tulane University Anthropology Graduate Student Fund.
Appendix 1. Tables
Legacy radiocarbon data included in this study (more likely ranges are in bold). All dates were calibrated in OxCal 4.4.4 (Bronk Ramsey Reference Bronk Ramsey2009a) with IntCal20 (Reimer et al. Reference Reimer, Austin, Bard, Bayliss, Blackwell, Bronk Ramsey, Butzin, Cheng, Edwards, Friedrich, Grootes, Guilderson, Hajdas, Heaton, Hogg, Hughen, Kromer, Manning, Muscheler, Palmer, Pearson, van der Plicht, Reimer, Richards, Scott, Southon, Turney, Wacker, Adolphi, Büntgen, Capano, Fahrni, Fogtmann-Schultz, Köhler, Kudsk, Miyake, Olsen, Reinig, Sakamoto, Sookdeo and Talamo2020).
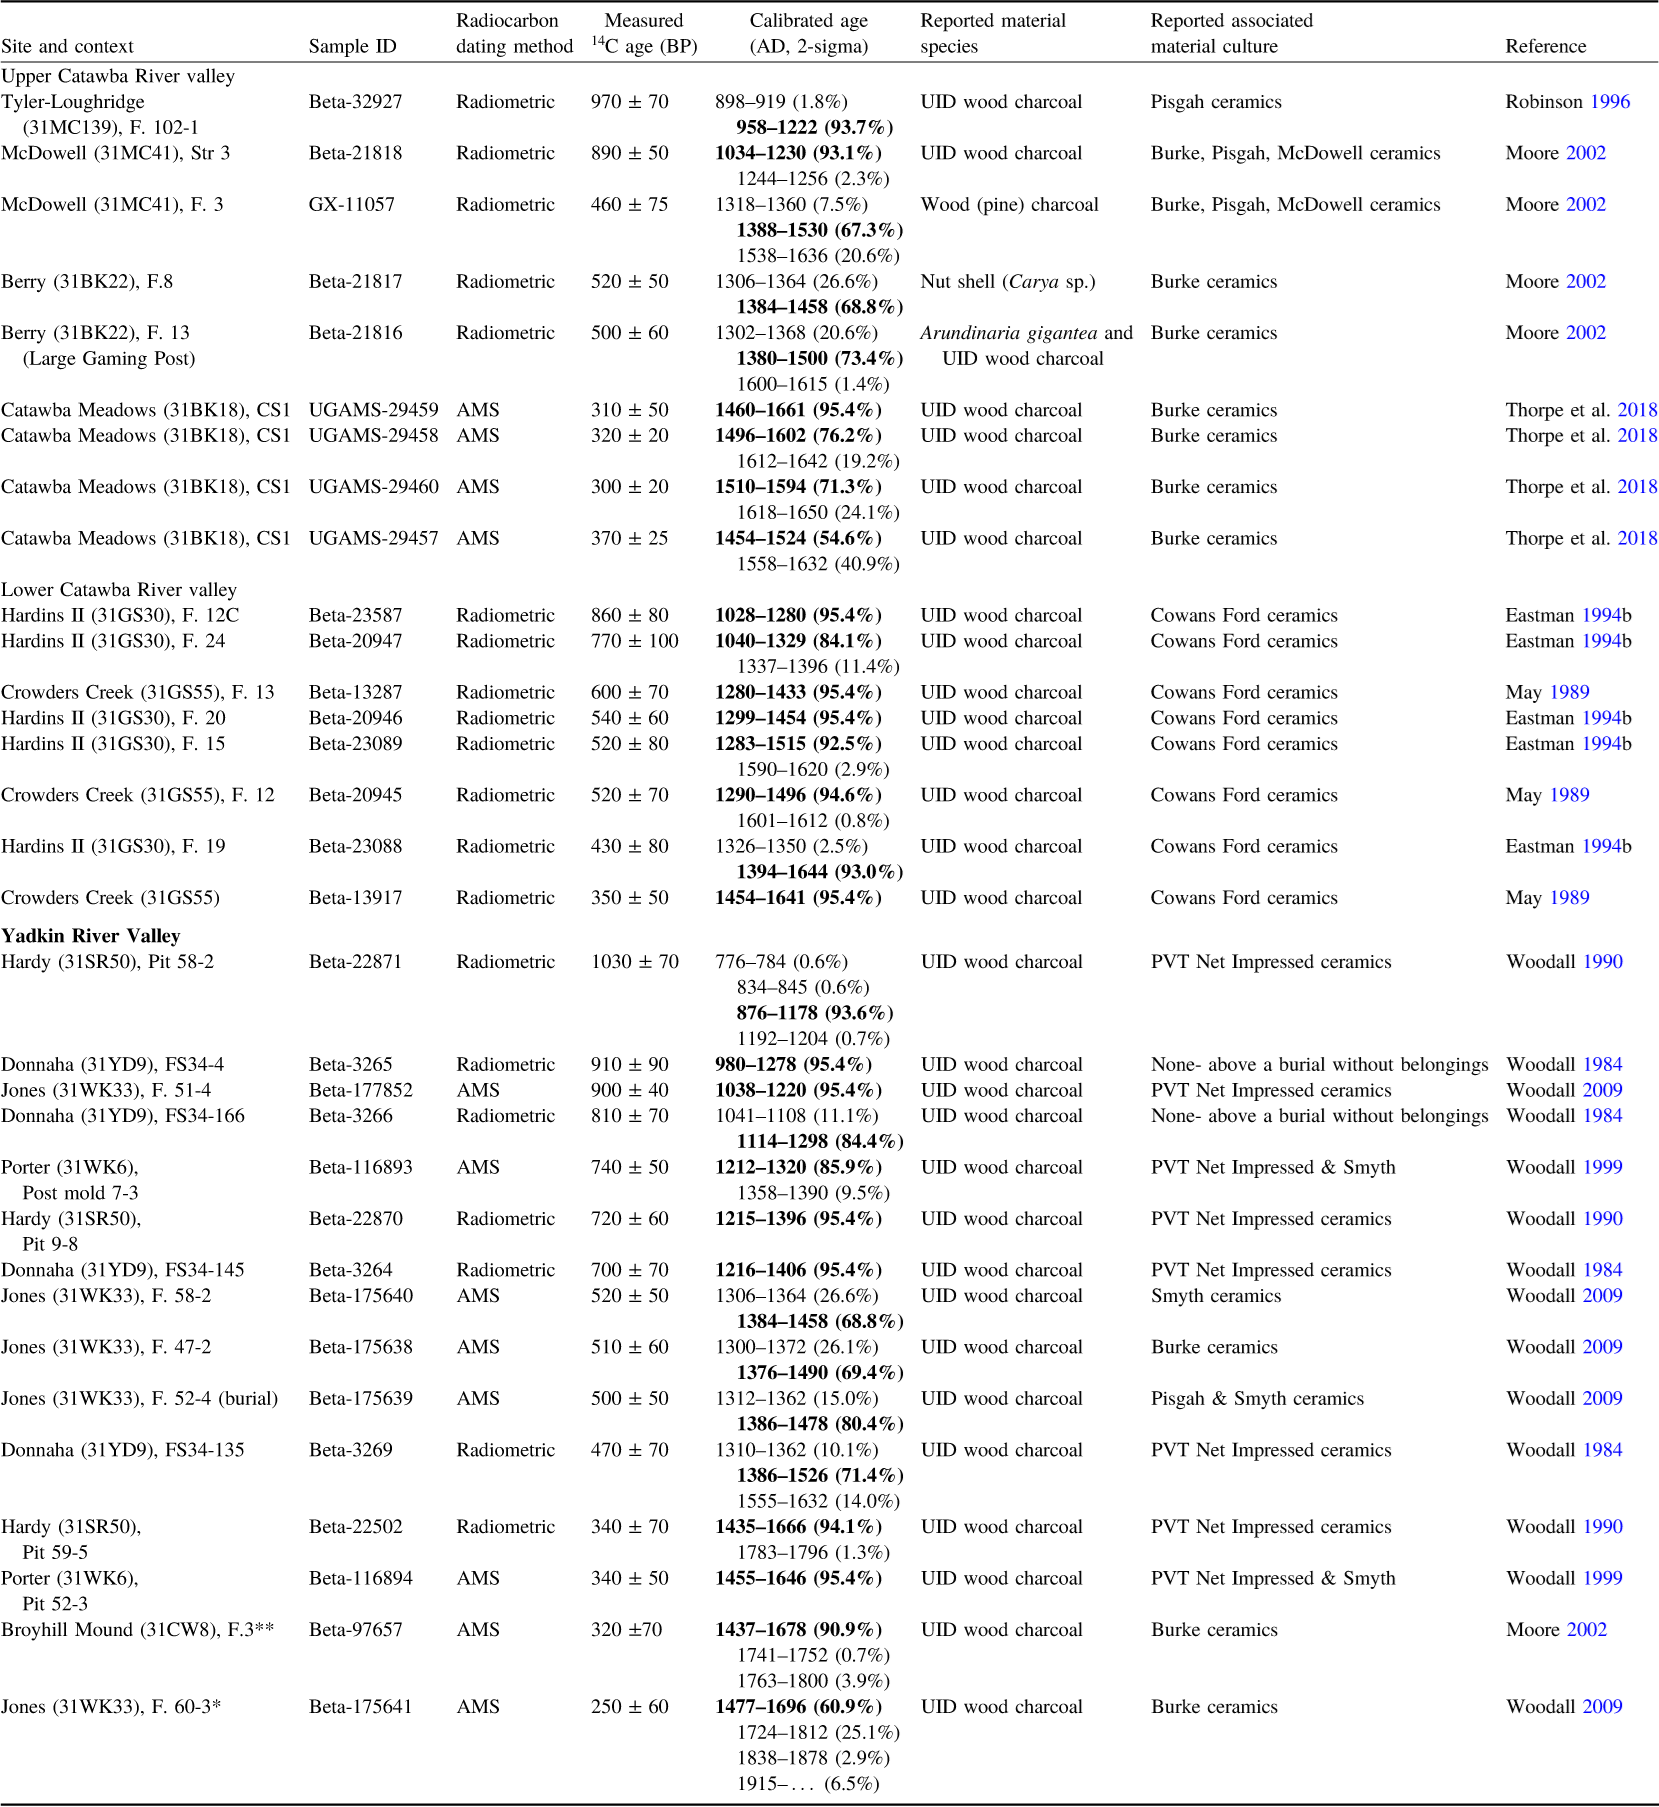
Table 1. Long description
A table with 34 rows and 7 columns summarizing radiocarbon dates from various archaeological sites. The columns are labeled Site, Sample ID, Type, Radiocarbon dating, Measured 14C age, Calibrated age (AD/BC), and Reference. The table includes data from the Upper Catawba River valley, Lower Catawba River valley, and Upper Yadkin River valley. Each row provides details on the site, sample ID, type of dating, measured 14C age, calibrated age, and reference. The data includes both radiometric and AMS dates, with some dates in bold indicating more likely ranges.
New AMS 14C results from Ensley and Catawba Meadows reported in this study (more likely ranges are in bold). All dates were calibrated in OxCal 4.4.4 (Bronk Ramsey Reference Bronk Ramsey2009a) with IntCal20 (Reimer et al. Reference Reimer, Austin, Bard, Bayliss, Blackwell, Bronk Ramsey, Butzin, Cheng, Edwards, Friedrich, Grootes, Guilderson, Hajdas, Heaton, Hogg, Hughen, Kromer, Manning, Muscheler, Palmer, Pearson, van der Plicht, Reimer, Richards, Scott, Southon, Turney, Wacker, Adolphi, Büntgen, Capano, Fahrni, Fogtmann-Schultz, Köhler, Kudsk, Miyake, Olsen, Reinig, Sakamoto, Sookdeo and Talamo2020).
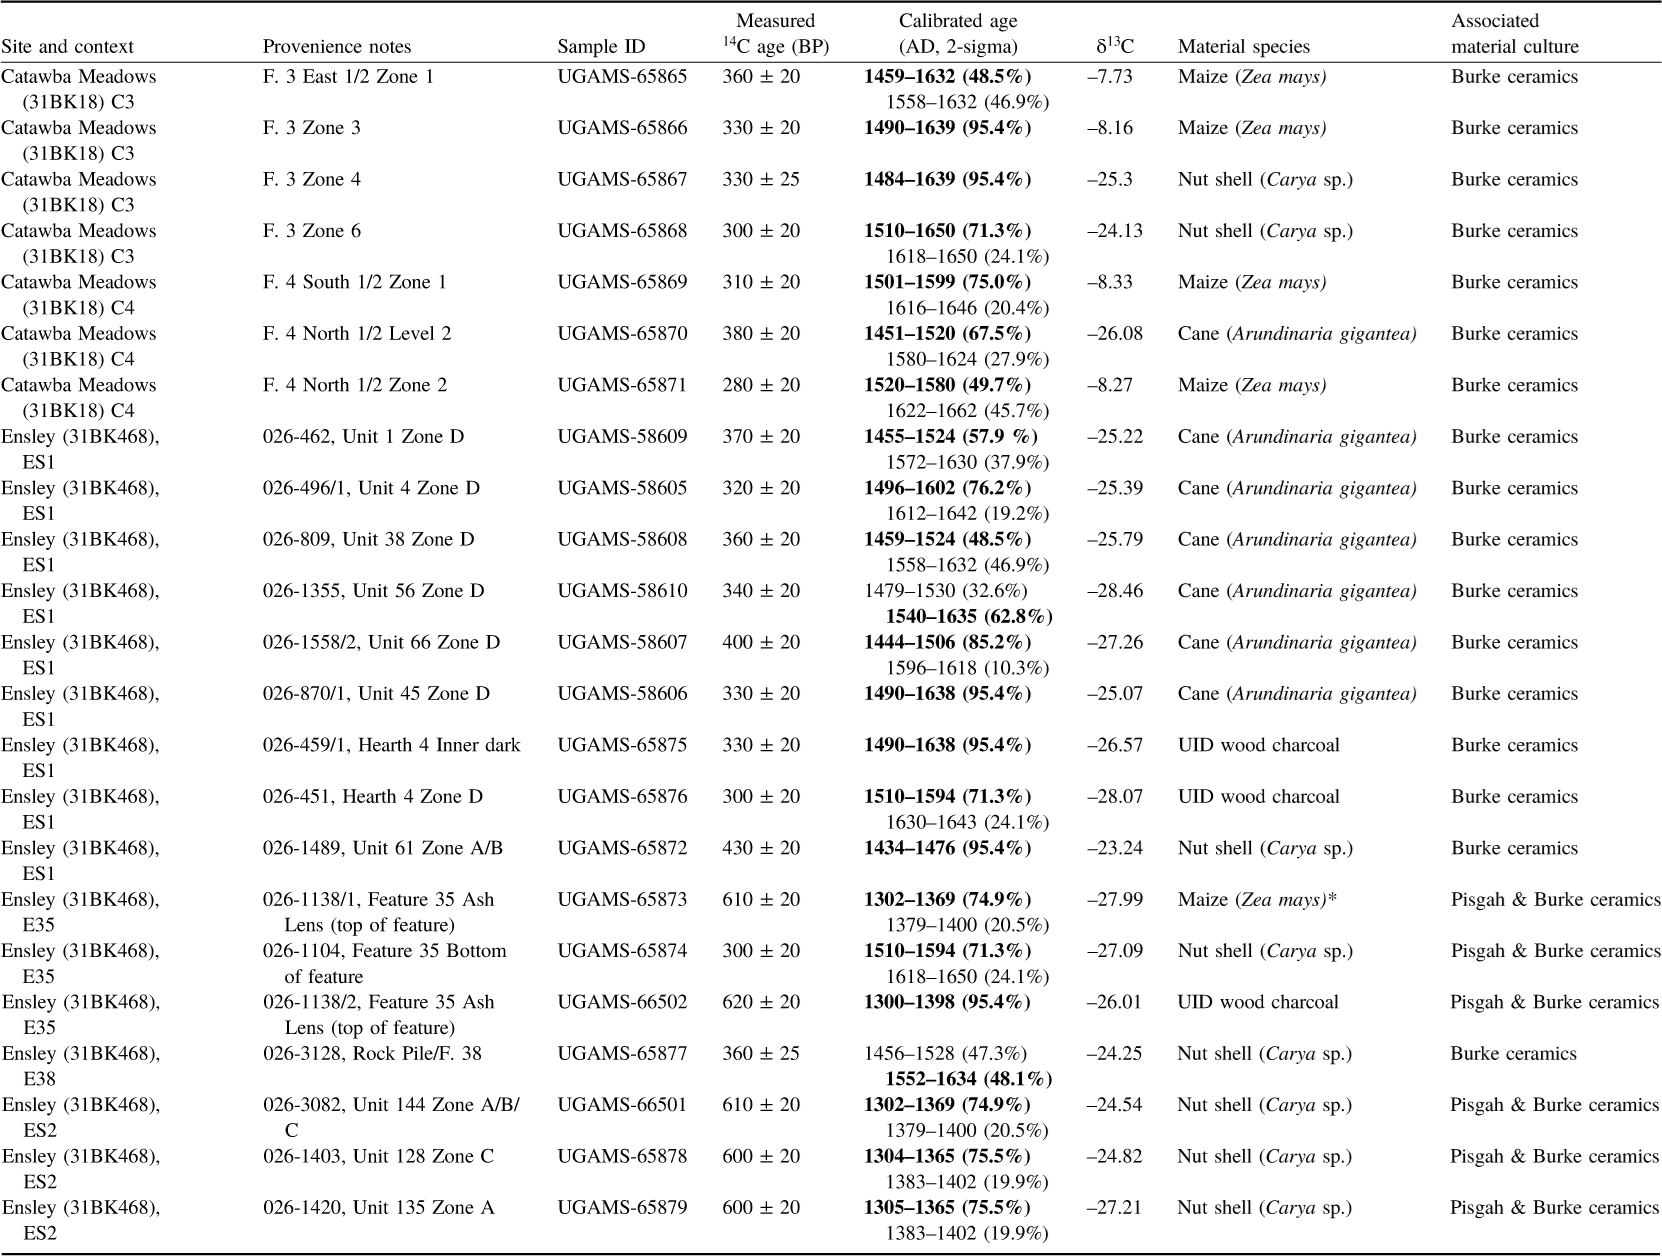
Table 2. Long description
A table with 30 rows and 8 columns detailing radiocarbon dating results from archaeological sites. Columns include Site and context, Provenience notes, Sample ID, Measured age in BP with error, Calibrated age in cal AD with 2-sigma range, delta 13C, Material species, and Associated material culture. Each row provides specific data for different samples, including their context, material type, and radiocarbon dates. The table includes various material species such as Burke ceramics, Arundinaria gigantea, Carya sp., and Zea mays, with associated material culture noted. The calibrated age ranges and delta 13C values are also provided for each sample.


 Open access

