Introduction
Aromatic hydrocarbons, particularly benzene, toluene, and xylene (BTX), play a crucial role as raw materials in the petrochemical industry. These compounds are essential feedstocks in the production of materials such as synthetic rubber, dyes, detergents, and intermediates. In petroleum processing, the BTX compounds can be derived from reforming and cracking processes. The aromatic stream produced from these processes contains small amounts of undesirable olefins, which can negatively impact subsequent processes and adversely affect the quality and application of the aromatics. Considering purity standards of catalysts, the existence of olefins, even in concentrations as low as ppm, is damaging and they must be removed. Owing to the large specific surface area and acidic nature, modified bentonite is one of the best candidates for this purpose (Li et al., Reference Li, Luan, Zeng and Shi2011; Luan et al., Reference Luan, Li and Shi2011; Pu et al., Reference Pu, Liu, Jiang and Shi2012; Pu and Shi, Reference Pu and Shi2013; Guo et al., Reference Guo, Zhang, Li, Peng, Xiong, Wang, Hu, Yao and Chen2020; Rouhani and Farhadi, Reference Rouhani and Farhadi2020).
In recent decades, natural and modified bentonite have gained considerable attention for a wide range of applications, due to their low cost, unique structure, high stability, and strong interactions with various materials. Bentonite primarily consists of montmorillonite and is generally classified into calcium (Ca), sodium (Na), or mixed (Na-Ca) types based on the predominant exchangeable ion (Önal and Sarikaya, Reference Önal and Sarıkaya2007; Boylu et al., Reference Boylu, Çinku, Esenli and Sabri Çelik2010; Biglari Quchan Atigh et al., Reference Biglari Quchan Atigh, Heidari, Karimi, Pezhman, Asgari Lajayer and Lima2021). Note that in addition to montmorillonite, bentonite contains several minerals that are regarded as impurities. The common impurities in bentonite include quartz, feldspar, calcite, cristobalite (or opal-C), mica, and illite. As the presence of these compounds reduces the quality of bentonite and interferes with the exfoliation process, it is advisable to remove them to purify the bentonite before its usage. According to the literature, several methods are employed to purify bentonite. These methods include the dissolution of (hydr)oxides, the oxidation of organic materials, and the decomposition of carbonates. Another method for purifying raw bentonite is the dispersion method, which utilizes sodium hexametaphosphate (NaHPM) to diminish edge-to-face interactions and deflocculate the bentonite particles (Srasra et al., Reference Srasra, Bergaya, van Damme and Ariguib1989; Gong et al., Reference Gong, Liao, Lv and Wang2016; Shabani Moghaddam et al., Reference Shabani Moghaddam, Ghanbari, Mirkazemi and Ahmadi2024). Very pure montmorillonite was produced by Ahmadi et al. (Reference Ahmadi, Ghanbari, Shabani Moghaddam and Naghizadeh2022) using raw bentonite and purified bentonite treated with NaHPM. Their results indicated that nano montmorillonite prepared from purified bentonite had better properties than those of the sample obtained from raw bentonite. In another investigation, Song et al. (Reference Song, Zhang, Liu and Zhang2005) achieved high-purity montmorillonite from ore using a dispersion and sedimentation process with sodium pyrophosphate as a dispersant. Their results demonstrated the effectiveness of this method which may be attributed to the adsorption of pyrophosphate ions on montmorillonite surfaces, thereby reducing the swelling capacity of the mineral particles.
In addition, to enhance the efficiency of bentonite as a catalyst for catalytic reactions, various modification methods, including thermal treatment, acid activation, and pillaring processes, have been investigated (Bovey and Jones, Reference Bovey and Jones1995; Önal et al., Reference Önal, Sarıkaya, Alemdaroğlu and Bozdoğan2002; Babaki et al., Reference Babaki, Salem and Jafarizad2008; Carrado and Komadel, Reference Carrado and Komadel2009; Taxiarchou and Douni, Reference Taxiarchou and Douni2014; Nouri et al., Reference Nouri, Tasviri and Ghasemzadeh2021). Acid activation of bentonite with mineral acids such as hydrochloric acid, sulfuric acid, and nitric acid, leads to the substitution of exchangeable ions with H+ ions from the acid used. This process can result in the dealumination of the structure, enhancing the clay’s BET surface area and adsorption capacity. As a result of acid activation, some acidic sites are formed, making the clay suitable for certain special catalytic reactions. Acid-activated bentonites have more acidic sites than the untreated version (Breen and Watson, Reference Breen and Watson1998; Salem and Karimi, Reference Salem and Karimi2009; Foletto et al., Reference Foletto, Colazzo, Volzone and Porto2011; Komadel, Reference Komadel2016; Elfadly et al., Reference Elfadly, Zeid, Yehia, Abouelela and Rabie2017). The effectiveness of the acid activation depends on the origin of bentonite, its chemical composition, and the temperature of acid activation (Mills et al., Reference Mills, Holmes and Cornelius1950; Kooli and Jones, Reference Kooli and Jones1997; Kooli and Yan, Reference Kooli and Yan2013). The process of removal of olefins from aromatic compounds using activated clay was investigated by Rouhani et al. (Reference Rouhani, Farhadi, Kenari, Eskandari and Ramakrishna2021). In the latter study, the activation of clay was performed through acid treatment with hydrochloric acid and sulfuric acid, and the results indicated that the performance of activated clay was superior to that of natural clay in this process.
In the present study, an optimized activated clay catalyst was developed for the removal of olefins as impurities from a BTX stream. To achieve this goal, first, the effect of bentonite/acid ratio on acid leaching was investigated. Purification and acid activation were then carried out on Iranian bentonite in order to obtain a highly active catalyst for the removal of olefins from BTX. Various catalysts were prepared, and their activity was tested during this process. The effect of urban and deionized water on the activity of prepared samples was also investigated.
Materials and methods
Materials
Raw bentonite, the main material, with a specific surface area of 57.2 m2 g–1, was purchased from Iran Barite. The raw bentonite consists mainly of 60.42% SiO2, 13.42% Al2O3, 3.57% CaO, 2.98% Fe2O3, 2.76% MgO, 2.55% Na2O, and 14.3% LOI. Sulfuric acid (98% purity) and sodium hexametaphosphate (96% purity) were purchased from Merck Chemical Co. The aromatic compounds used as feed for the olefins-removal process were acquired from Nouri Petrochemical Co. (Bushehr, Iran). The Bromine Index (BI) of the aromatic compounds used was ~250 mg of Br2 per 100 g, which is very high and poses a difficulty in the industry.
Methods
In the first phase, the ratio of bentonite to acid was optimized, and in the second phase, the effect of water quality on the two purification steps and acid activation was evaluated.
Acid treatment
Acid treatment was used to activate the bentonite. Leaching was initiated by adding 120 g of acid to urban tap water to obtain a final volume of 1 L, after which the mixture was stirred. Various amounts of raw bentonite (50, 100, and 150 g) were then added to the solution. The resulting suspensions were stirred using a magnet at 95°C for 6 h. Afterward, filtration and thorough washing with water were performed; the filtration was carried out using a Büchner funnel and Whatman filter paper (20-40). After the initial filtration, the remaining solid material (the so-called filter cake) was transferred into water for washing, dispersed in the water using a magnetic stirrer, and then filtered again. The resulting product was finally dried at 100°C overnight. Three catalysts (AC-01, AC-02, and AC-03) were prepared at this stage (Table 1). The characteristics of the urban water are listed in Table 2.
Characteristics of the synthesized samples based on preparation steps and water quality

Table 1. Long description
The table consists of five columns: Sample, Bentonite forward slash acid (g cm super minus 3), Acid molarity (mol L super minus 1), Purifying step, and Acid-activation step.
* Sample A C dash 01: 50 forward slash 65 is approximately 0.8 g cm super minus 3; 1.2 mol L super minus 1 acid; no purifying step; Urban water acid-activation.
* Sample A C dash 02: 100 forward slash 65 is approximately 1.5 g cm super minus 3; 1.2 mol L super minus 1 acid; no purifying step; Urban water acid-activation.
* Sample A C dash 03: 150 forward slash 65 is approximately 2.3 g cm super minus 3; 1.2 mol L super minus 1 acid; no purifying step; Urban water acid-activation.
* Sample A C dash 04: No bentonite or acid data; Urban water purifying step; no acid-activation step.
* Sample A C dash 05: No bentonite or acid data; Deionized water purifying step; no acid-activation step.
* Sample A C dash 06: 0.8 g cm super minus 3; 0.4 mol L super minus 1 acid; Urban water purifying step; Urban water acid-activation.
* Sample A C dash 07: 0.8 g cm super minus 3; 0.4 mol L super minus 1 acid; Urban water purifying step; Deionized water acid-activation.
* Sample A C dash 08: 0.8 g cm super minus 3; 0.4 mol L super minus 1 acid; Deionized water purifying step; Deionized water acid-activation.
Comparative analyses of the water samples used

Table 2. Long description
The table consists of 13 columns and 2 data rows.
Column headers from left to right are: Water Type, Cl (p p m), S (p p m), Ca (p p m), Na (p p m), Mg (p p m), K (p p m), Co (p p m), T D S, E C, Sigma Cations (m e q L super -1), Sigma Anions (m e q L super -1), and Charge balance (%).
Row 1: Urban water
- Cl: 98
- S: 42
- Ca: 315
- Na: 44
- Mg: 3
- K: 8
- Co: 3
- T D S: 397
- E C: 620
- Sigma Cations: 18.18
- Sigma Anions: 5.38
- Charge balance: 54.3
Row 2: Deionized water
- All chemical elements (Cl, S, Ca, Na, Mg, K, Co) are listed as N D (not detected).
- T D S: 2
- E C: 4
- Sigma Cations, Sigma Anions, and Charge balance are all approximately 0.
Footnote: N D equals not detected; T D S equals total dissolved solids; E C equals electrical conductivity.
ND = not detected; TDS = total dissolved solids; EC = electrical conductivity.
Purification
Fifty grams of raw bentonite was added to 2 L of a NaHMP suspension (0.125 wt.%). The mixed suspension was then stirred using a magnet for 1 h and left undisturbed for 24 h to allow the heavier particles to settle and separate from the upper part. To perform further characterizations, some of the supernatant was dried at 80°C for 24 h. Samples AC-04 and AC-05 were prepared using this method.
Purification and acid treatment
Sample preparation was carried out in several steps (Fig. 1). In the first step, the purification method mentioned above was carried out exactly as described. In the second step, referred to as the acid-activation stage, 1 L of supernatant was transferred to a beaker, and 42 g of sulfuric acid was added. The suspension was then stirred using a magnet for 6 h at 95°C. The final suspension was washed twice and filtered with sufficient water until the pH reached 2–3 and then dried at 100°C overnight.
Schematic diagram of sample preparation.

Three catalysts (AC-06, AC-07, and AC-08) were prepared using water of various qualities during the purification and acid-activation steps (Table 1). Urban water was used in both steps for the first catalyst. For the second catalyst, urban water was used only during purification, while deionized water was used for acid activation. In the third catalyst, deionized water was used throughout the process. Note that, according to the analyses performed (Table 2), the ions present in these waters are different.
Characterization
The nitrogen adsorption/desorption analysis was carried out at 77 K to investigate the BET surface area and pore characterization of the samples. This analysis was conducted using a Micromeritics Tristar II Plus (USA) instrument. Before the analysis, all of the samples were degassed under vacuum at 180°C for 90 min to remove moisture. The XRD patterns of the samples were recorded using a Philips PW1730 (Netherlands) diffractometer. The instrument was equipped with a Cu target (λ = 0.154 nm) and operated in the 0.8–8.0°2θ range (low angle) and 5–80°2θ range (normal mode), with a scan rate of 0.04°2θ s–1. Note that the samples were dried at 100°C before the recording. The crystalline sizes of the samples were determined using the Scherrer equation (D = 0.9λ/βcosθ, where D represents the crystallite size, θ is the Bragg angle (°), λ is the X-ray wavelength (nm), and β is the full width at half-maximum (FWHM) of the peaks). The composition of the samples was measured by XRF using a Philips PW2404 (Netherlands) instrument.
The surface acidity of the samples was examined by temperature-programmed desorption (NH3-TPD) using a Belcat II (USA) analyzer. In this method, 0.05 g of the sample was heat-treated in a tubular reactor purged with He gas (50 mL min–1) at 180°C for 90 min, cooled to 100°C, then, in a passing flow of He and NH3 (95:5) (50 mL min–1), heated again from 100 to 800°C. The evolved ammonia was analyzed using an online thermal conductivity detector (TCD). The microstructure of the fresh and spent samples was investigated by scanning electron microscopy (SEM) using a MIRA3-Tescan (Czech Republic) instrument.
Evaluation of catalyst activity
To evaluate the catalytic activity, 10 cm3 of the catalyst (30–60 mesh) was fixed in the center of a fixed-bed reactor. Inert materials (α-Al₂O₃) were then added to the reactor: these were placed above and below the catalyst to fix the catalyst bed in the center of the reactor (below) and to provide uniform flow distribution across the catalyst bed and prevent channeling (above). This reactor was placed in a three-zone furnace, which is capable of controlling the temperature of all three zones. After reaching the temperature of the bed at 160°C, a liquid feed stream with a flow rate of 0.83 mL min–1 entered the reactor until the pressure reached 11 bar, and under these conditions, the process of removing olefin from the feed was carried out. The sampling interval was 10 h. During the reaction, each sample exhibited different BI values based on its efficiency in olefin removal. The BI was considered to be an indicator of the olefin content in the aromatic compounds and is defined as milligrams of bromine consumed by 100 g of the hydrocarbon sample. A low BI indicates the presence of a small amount of olefins in aromatic compounds; a large BI value suggests that the aromatic compound contains a large amount of olefins.
Results and Discussion
Acid treatment
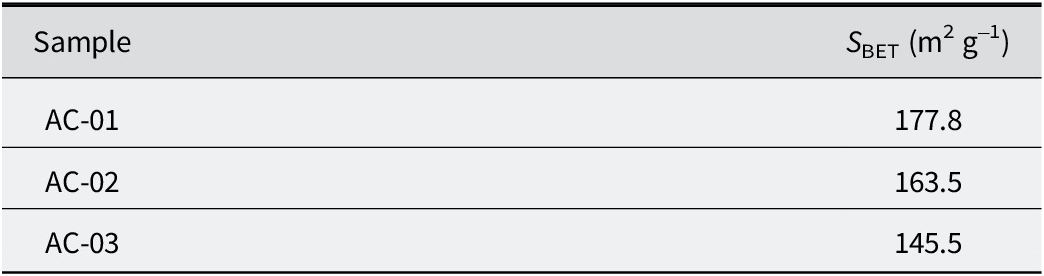
In order to determine the most suitable bentonite/acid ratio for leaching, BET and NH3-TPD analyses were carried out to investigate the specific surface area and acidic sites of the catalysts prepared, respectively. The results of the BET analysis (Table 3) revealed that, as the smaller amount of starting clay resulted in greater surface area, a more effective acid activation could then be expected due to more surface being exposed to acid.
BET surface area of prepared samples with different initial bentonites

Table 3. Long description
The table consists of two columns. The first column is titled Sample and the second column is titled S sub B E T in units of meters-squared per gram.
* Row 1: Sample A C – 01 has a surface area of 177.8.
* Row 2: Sample A C – 02 has a surface area of 163.5.
* Row 3: Sample A C – 03 has a surface area of 145.5.
The surface acidity of the catalyst was crucial in controlling the activity of the alkylation reactions. The results of the NH3-TPD analysis (Fig. 2) indicate that increasing the ratio of bentonite/acid prevents the acid activation process, leading to a decrease in the number of acidic sites on the clay structure. These results are consistent with those obtained from BET analysis (Table 3), which showed that acid activation was more successful because of a larger surface area. In fact, by increasing the ratio, the probability of reaction between the H+ of the sulfuric acid with the montmorillonite structure and the removal of cations from the structure decreased (Komadel, Reference Komadel2003; Faghihian and Mohammadi, Reference Faghihian and Hadi Mohammadi2014). Moreover, the acidity of the samples increased with the decrease in the amount of initial bentonite (AC-01 = 1.947 mmol NH3 g−1, AC-02 = 1.704 mmol NH3 g−1, and AC-03 = 1.489 mmol NH3 g−1), which confirms the validity of the NH3-TPD results.
NH3-TPD analysis of the acid-activated samples.

Figure 2. Long description
The x-axis represents Temperature in degrees Celsius, ranging from 100 to 800. The y-axis represents T C D signal in arbitrary units (a. u.). Four samples are plotted: A C-01 (bright green), A C-02 (teal), A C-03 (maroon), and A C-06 (black).
All four curves follow a similar multi-peak profile:
* A broad, low-intensity shoulder or peak occurs between 150 and 300 degrees Celsius.
* A plateau or secondary broad peak is visible between 350 and 500 degrees Celsius.
* A primary, high-intensity peak occurs between 550 and 650 degrees Celsius, followed by a sharp decline toward the baseline at 800 degrees Celsius.
Vertical distribution of signal intensity:
* A C-06 (black) consistently shows the highest signal intensity across the entire temperature range, with its maximum peak reaching the highest point at approximately 600 degrees Celsius.
* A C-01 (bright green) follows as the second highest in intensity.
* A C-02 (teal) is third in intensity.
* A C-03 (maroon) shows the lowest signal intensity across the majority of the spectrum.
At approximately 650 degrees Celsius, the curves for A C-01, A C-02, and A C-03 intersect with the declining A C-06 curve, as A C-06 drops more rapidly at higher temperatures.
Purification and acid treatment
Phase-evolution study
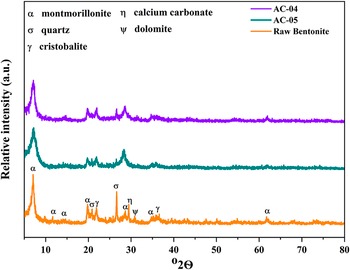
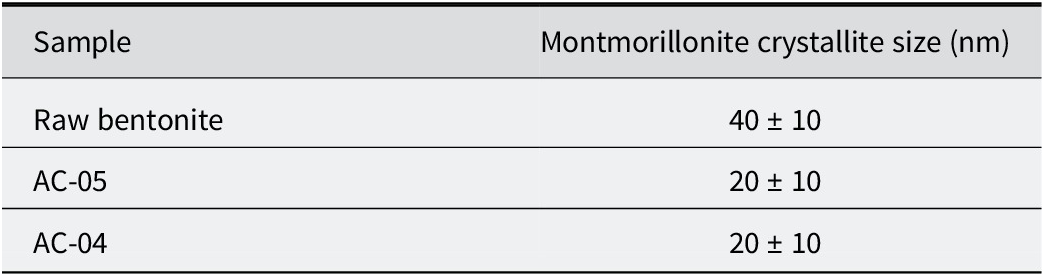
The XRD patterns of raw bentonite and purified bentonites (AC-04 and AC-05) (Fig. 3) showed that montmorillonite (reference code: 00-002-0037), quartz (01-078-2315), calcium carbonate (01-086-2334), cristobalite (01-082-0512), and dolomite (00-002-0767) were present in the raw bentonite (Shabani Moghaddam et al., Reference Shabani Moghaddam, Ghanbari, Mirkazemi and Ahmadi2024). The crystallite size was calculated using Scherrer’s equation (Table 4). As indicated in the XRD pattern, the crystallite size of this phase was reduced compared with the raw bentonite, which was representative of the removal of coarser clay that happened during purification. On the other hand, quartz/montmorillonite relative peaks were reduced, confirming that the purification process was successful in terms of the reduction in the number of quartz particles, which were mostly associated with the montmorillonite phase. Moreover, further examination of the XRD patterns revealed that dolomite and calcium carbonate phases, along with quartz, were almost removed during the purification stage using deionized water compared with urban water, with the accuracy of the XRD instrument. This behavior is consistent with the enhanced dispersion that occurs under low-ionic-strength conditions, where increased electrical double-layer thickness promotes the separation and the removal of fine mineral particles. Within the detection limits of the XRD instrument, these results indicate a better performance of deionized water in comparison with urban water in eliminating accessory phases.
The XRD patterns of raw bentonite and of bentonite purified with deionized (AC-05) and urban water (AC-04).

Figure 3. Long description
A line graph showing X-ray diffraction patterns. The horizontal X-axis is labeled 2 theta in degrees ranging from 5 to 80. The vertical Y-axis is labeled Relative intensity in arbitrary units a dot u dot.
At the top left, a mineral key identifies symbols used in the plot.
- alpha: montmorillonite
- sigma: quartz
- gamma: cristobalite
- eta: calcium carbonate
- psi: dolomite
At the top right, the legend identifies three colored lines.
- Purple: A C dash 0 4
- Teal: A C dash 0 5
- Orange: Raw Bentonite
The data consists of three stacked diffractograms.
- The bottom orange line (Raw Bentonite) shows the most distinct peaks. A sharp alpha peak appears near 7 degrees. Smaller alpha peaks are at 12 and 15 degrees. A cluster of peaks for alpha, sigma, and gamma occurs between 20 and 22 degrees. A sharp sigma peak is at 27 degrees, followed by alpha, eta, and psi peaks near 30 degrees. Further alpha and gamma peaks are at 36 degrees, and a final alpha peak is at 62 degrees.
- The middle teal line (A C dash 0 5) and top purple line (A C dash 0 4) show similar patterns to the raw bentonite but with significantly reduced peak intensities and broader features, particularly in the 20 to 40 degree range, indicating changes in crystallinity or mineral composition after purification.
Crystallite size of the montmorillonite of various samples

Table 4. Long description
The table consists of two columns: Sample and Montmorillonite crystallite size in n m.
* The first row lists Raw bentonite with a crystallite size of 40 plus or minus 10 n m.
* The second row lists A C dash 05 with a crystallite size of 20 plus or minus 10 n m.
* The third row lists A C dash 04 with a crystallite size of 20 plus or minus 10 n m.
The XRD analysis of the raw bentonite, and of the acid-activated samples (Fig. 4) showed that the relative intensity of the (002) peak related to the montmorillonite phase were diminished by the activation of the clay with sulfuric acid. The intensity reduction of this peak while maintaining the other peaks of montmorillonite after acid treatment suggests partial dissolution of the montmorillonite layers, resulting from H+ exchange with interlayer cations. The protonation of the clay surface and the consequent modification of electrical double layer promote dispersion of the layers, facilitating delamination without structural collapse (Luna et al., Reference Luna, Cecilia, Alves Saboya, Barrera, Sapag, Rodríguez-Castellón and Cavalcante2018; Hao et al., Reference Hao, Pudasainee, Gupta, Kashiwabara, Alessi and Konhauser2019).
XRD analysis of the raw bentonite, and of purified and acid-activated samples.

Figure 4. Long description
A line graph displaying four stacked X-ray diffraction patterns. The horizontal X-axis is labeled degree 2 theta, ranging from 0 to 80. The vertical Y-axis is labeled Relative intensity in arbitrary units.
At the top left, a legend identifies mineral phases with Greek letters: alpha for montmorillonite, sigma for quartz, gamma for cristobalite, eta for calcium carbonate, and psi for dolomite.
From bottom to top, the datasets are:
* Raw Bentonite (orange line): Shows the most distinct peaks. A sharp alpha peak appears near 7 degrees. Multiple peaks are clustered between 20 and 30 degrees, including alpha, sigma, gamma, eta, and psi. A smaller alpha peak is visible near 62 degrees.
* AC-06 (black line): The baseline is shifted upward. The sharp alpha peak at 7 degrees is significantly reduced and broadened. Peaks between 20 and 30 degrees remain but with lower relative intensity.
* AC-07 (red line): The baseline is shifted further upward. The initial alpha peak is almost entirely flattened, indicating structural degradation of the clay mineral.
* AC-08 (blue line): The top-most pattern, showing the highest baseline shift and the most suppressed crystalline peaks, with only broad humps remaining where sharp mineral signatures once existed.
Structural investigation
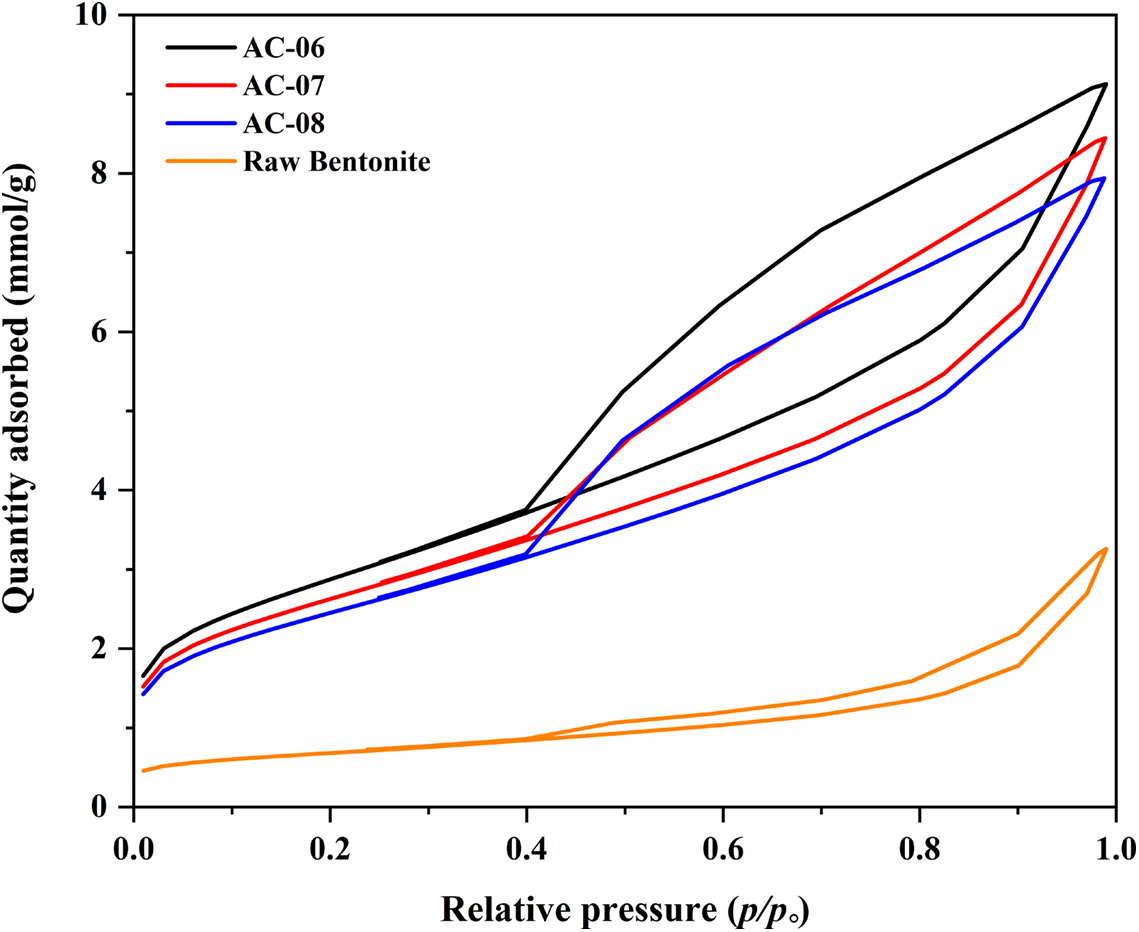
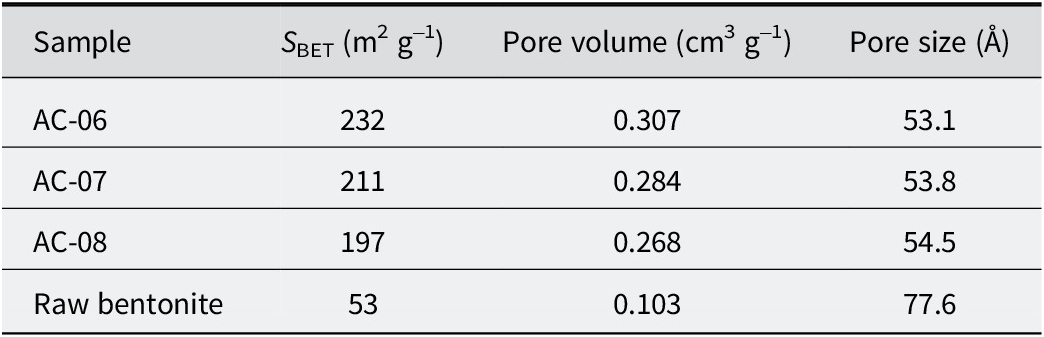
N2 adsorption-desorption analysis of the raw bentonite, and of its purified and acid-activated forms was also carried out (Fig. 5). The corresponding S BET, pore volume, and pore size are also compared in Table 5. According to IUPAC classification, all the samples exhibited type IV isotherms, associated with mesoporous adsorbent materials. This porosity is well-suited to accommodating aromatic molecules. The hysteresis loops of the samples prepared resemble the H3 type loop which is assigned to solids composed of agglomerated particles with non-uniform slit-like channels. The significant increase in the BET surface area of the acid-activated samples may result from the opening of the edges of the platelets, accompanied by substantial leaching of cations from the tetrahedral and mostly octahedral sheets, which are then replaced by hydrogen ions (Elfadly et al., Reference Elfadly, Zeid, Yehia, Abouelela and Rabie2017; Mirasgari et al., Reference Mirasgari, Alavi and Rezaei2024).
N2 adsorption-desorption isotherms of the raw bentonite, and of purified and acid-activated samples.

Figure 5. Long description
The X-axis represents Relative pressure ranging from 0.0 to 1.0. The Y-axis represents Quantity adsorbed (m m o l per g) ranging from 0 to 10.
All four samples exhibit Type 4 isotherms with H 3 hysteresis loops, where the desorption branch sits above the adsorption branch.
* A C-06 (black line): The highest curve, starting at approximately 1.8 m m o l per g, rising steadily to an inflection point at 0.4 relative pressure, then increasing more sharply to a peak of 9.2 m m o l per g at 1.0 relative pressure.
* A C-07 (red line): Follows a similar path to A C-06 but lower, peaking at approximately 8.5 m m o l per g.
* A C-08 (blue line): Slightly lower than A C-07, peaking at approximately 8.0 m m o l forward slash g.
* Raw Bentonite (orange line): Positioned significantly lower than the acid-activated samples, starting near 0.5 and reaching a maximum of only 3.2 m m o l per g at 1.0 relative pressure, indicating much lower porosity.
Physicochemical properties of the raw bentonite, and of purified and acid-activated samples

Table 5. Long description
The table consists of four columns and five rows including the header.
Column headers from left to right are:
1. Sample
2. S sub B E T in meters squared per gram
3. Pore volume in centimeters cubed per gram
4. Pore size in Angstroms
Data rows from top to bottom:
* Sample A C 06: S sub B E T is 232, Pore volume is 0.307, Pore size is 53.1.
* Sample A C 07: S sub B E T is 211, Pore volume is 0.284, Pore size is 53.8.
* Sample A C 08: S sub B E T is 197, Pore volume is 0.268, Pore size is 54.5.
* Raw bentonite: S sub B E T is 53, Pore volume is 0.103, Pore size is 77.6.
The data show that acid-activated samples have significantly larger surface area and pore volume but smaller pore sizes compared to raw bentonite.
The increase in pore volume and decrease in pore size of the bentonite after the purification and acid activation can result from the effective dissolution of the bentonite caused by the removal of most of the silica and carbonate phases in the purification pre-processing step. In fact, the distance between the particles is mainly replaced by the distance between the layers of the montmorillonite released by this method of purification (Babaki et al., Reference Babaki, Salem and Jafarizad2008; Carrado and Komadel, Reference Carrado and Komadel2009).
TPD analysis
As mentioned above, the surface acidity of the catalyst is vital in controlling the activity of the alkylation reactions. The total acidity of the purified and acid-activated bentonites was measured using NH3-TPD analysis (Fig. 6) (AC-06 = 2.263 mmol NH3 g−1, AC-07 = 2.49 mmol NH3 g−1, AC-08 = 2.61 mmol NH3 g−1). Note that these samples demonstrated greater acidity than the samples that were just acid-treated (AC-01 = 1.947 mmol NH3 g−1, AC-02 = 1.704 mmol NH3 g−1, and AC-03 = 1.489 mmol NH3 g−1), clearly highlighting the significant impact of the purification step on the acidity of the final catalyst. Moreover, as can be seen, the raw bentonite sample contained a small number of Lewis acid sites and a large number of Brønsted acid sites, and the Brønsted acid sites were decreased during acid activation. After acid activation, weak, medium, and strong acid sites were observed in all of the samples prepared, showing that it is from the newly formed acid sites that the catalyst activity originated. The first peak, below 250°C, corresponds to Lewis acid sites. The second peak, in the temperature range of 300–500°C, is associated with moderate Brønsted acid sites. Finally, the peak at temperatures above 500°C belongs to strong Brønsted acid sites (Elfadly et al., Reference Elfadly, Zeid, Yehia, Abouelela and Rabie2017). As shown, the sample treated with deionized water during both the purification and acid-activation steps exhibited greater surface acidity, which results in greater activity. The results from other samples also showed that purification with deionized water, even in the washing stage, has a significant effect on increasing the number of acidic sites in the catalyst. The smaller amount of cations in washing water also increased the number of weak and moderate Brønsted acid sites due to the more effective ion exchange.
NH3-TPD analysis of the raw bentonite, and of purified and acid-activated samples.

Figure 6. Long description
A line graph plotting T C D signal in arbitrary units on the Y-axis against Temperature in degrees Celsius on the X-axis, ranging from 100 to 800.
Three horizontal brackets at the top of the plot area define acidity regions:
* weak acid sites from approximately 120 to 250 degrees.
* medium acid sites from approximately 320 to 450 degrees.
* strong acid sites from approximately 500 to 750 degrees.
Four curves are shown:
* Raw Bentonite (orange line): Remains nearly flat and lowest until 550 degrees, then rises sharply to a very high, narrow peak at approximately 675 degrees before dropping steeply.
* A C-06 (black line): Shows a broad, low plateau across the weak and medium regions, rising to a moderate peak at 600 degrees within the strong acid site region.
* A C-07 (red line): Follows a similar trend to A C-06 but maintains a higher intensity across all regions, peaking slightly higher at 600 degrees.
* A C-08 (blue line): Exhibits the highest intensity among the activated samples, with the most pronounced plateau in the medium acid site region and the highest peak at 600 degrees.
In the strong acid site region, the raw bentonite peak is significantly taller and shifted to a higher temperature compared to the broader, lower-temperature peaks of the A C series samples.
Catalytic activity
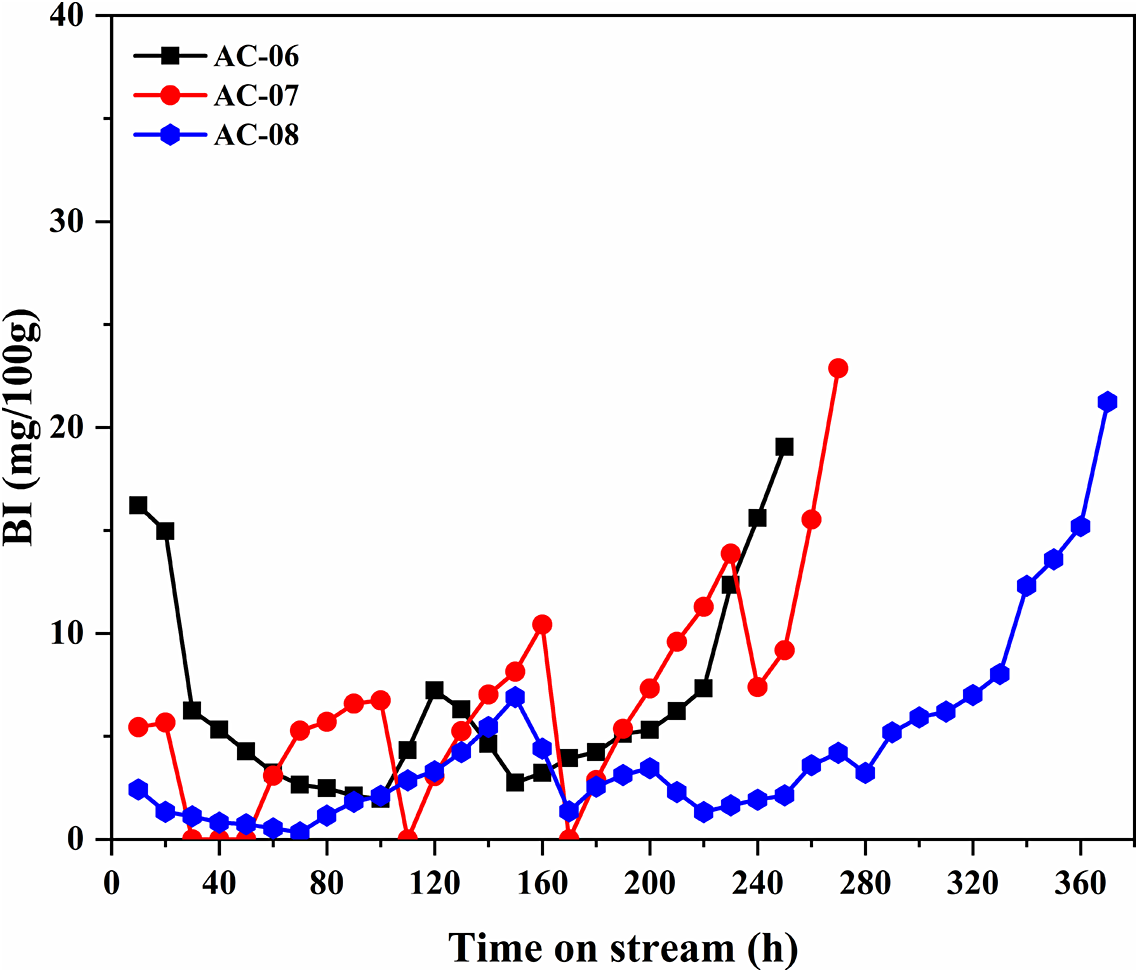
The performance of purified and acid-activated clays in the process of olefin removal from the aromatic stream was investigated (Fig. 7). As mentioned, during the reaction, each sample exhibited different BI values based on its efficiency at olefin removal. The results showed that the sample synthesized with deionized water in both the purification and acid activation steps showed better catalytic activity than other samples (AC-06 maintained BI <20 mg per 100 g for ~250 h and AC-07 maintained BI <20 mg per 100 g for ~270 h). This catalyst (AC-08) was able to maintain the BI at <20 mg per 100 g for up to 370 h.
Catalytic activity of the purified and acid-treated samples in the olefin-removal process.

Figure 7. Long description
The line graph plots B I in milligrams per 100 grams on the Y-axis against T O S in hours on the X-axis. The X-axis ranges from 0 to 360 hours with increments of 40. The Y-axis ranges from 0 to 40 with increments of 10.
Three data series are shown.
1. A C dash 06 (black squares) starts at approximately 16 B I at 10 hours, drops sharply to 3 B I by 80 hours, fluctuates between 3 and 8 B I until 220 hours, and then rises steeply to 19 B I at 250 hours.
2. A C dash 07 (red circles) starts at 5 B I, fluctuates significantly between 0 and 10 B I until 240 hours, then shows a sharp exponential increase reaching 23 B I at 270 hours.
3. A C dash 08 (blue hexagons) maintains the lowest B I levels for the longest duration, staying below 5 B I until 280 hours. After 280 hours, it shows a steady upward trend, reaching 21 B I at 370 hours.
Overall, all three samples show an initial period of low activity followed by a breakthrough where B I levels increase rapidly, with A C dash 08 showing the longest stability.
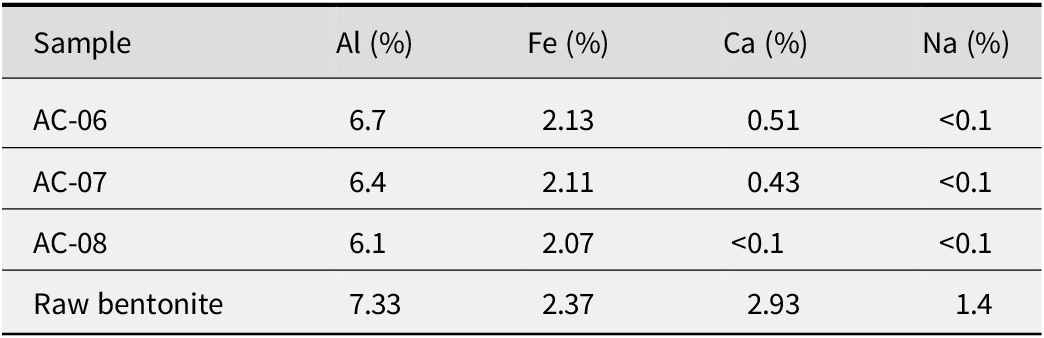
Meanwhile, the other catalysts exhibited less activity in terms of olefin conversion. Note that the catalytic performance results confirmed the findings from the NH3-TPD analysis and the acidity sites of the samples (AC-06 = 2.263 mmol NH3 g−1, AC-07= 2.49 mmol NH3 g−1, AC-08 = 2.61 mmol NH3 g−1). During the acid-activation process, some exchangeable ions (Ca2+, Na+, etc.) are replaced by hydrogen ions, and Al3+ and Fe3+ cations are leached from the octahedral and tetrahedral sheets, leading to the formation of acidic sites. As deionized water is almost free of any ions, it helps to carry out this process effectively (Faghihian and Mohammadi, Reference Faghihian and Hadi Mohammadi2014; Rouhani et al., Reference Rouhani, Farhadi, Kenari, Eskandari and Ramakrishna2021). However, due to the presence of various ions in urban water, exchangeable ions cannot be extracted efficiently, which leads to better catalytic activity and more acidic sites in the sample synthesized with deionized water. To investigate this issue, atomic absorption spectroscopy (AAS) analysis was performed to determine the elemental content of the catalysts and the raw bentonite (Table 6).
Results of AAS analysis

Table 6. Long description
The table consists of five columns: Sample, A l (%), F e (%), C a (%), and N a (%).
* Row 1: Sample A C – 06 contains 6.7% A l, 2.13% F e, 0.51% C a, and less than 0.1% N a.
* Row 2: Sample A C – 07 contains 6.4% A l, 2.11% F e, 0.43% C a, and less than 0.1% N a.
* Row 3: Sample A C – 08 contains 6.1% A l, 2.07% F e, less than 0.1% C a, and less than 0.1% N a.
* Row 4: Raw bentonite contains 7.33% A l, 2.37% F e, 2.93% C a, and 1.4% N a.
The results show that the AC-08 sample, which has a smaller S BET value compared with AC-06 and AC-07, is obviously more effective because the BI remained unchanged below 20 mg per 100 g for longer than the other catalysts. This can be related mainly to the larger amount of weak and moderate acid sites produced by deionized water-based purification and activation steps. As can also be observed, sample AC-07 exhibited a better performance than AC-06, due to its greater surface acidity (Nouri et al., Reference Nouri, Tasviri and Ghasemzadeh2021).
Catalyst microstructure and surface changes caused by the olefin-removal process
Structural investigation
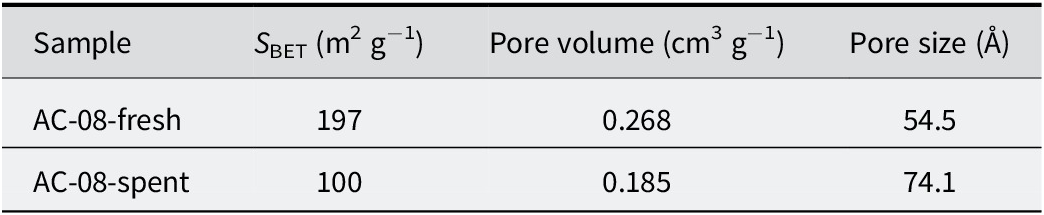
The structural characteristics (Table 7), such as specific surface area, pore volume, and pore size of the optimized catalyst (AC-08), were investigated before and after usage in the olefin-removal process. The BET analysis clearly indicated a reduction in specific surface area and pore volume, as well as an increase in pore size. This significant decrease in S BET is related to potential coke deposition and the destruction of smaller-sized pores, which disturbed the non-uniform porous structure of the catalyst (Occelli, Reference Occelli1988). These changes are caused by operating conditions, including high gas pressure and elevated temperatures, which reduce the mechanical properties of the catalyst.
Physicochemical properties of the fresh and spent acid-activated samples

Table 7. Long description
The table consists of four columns and three rows including the header.
Column 1: Sample.
Column 2: S sub B E T in meters squared per gram.
Column 3: Pore volume in centimeters cubed per gram.
Column 4: Pore size in Angstroms.
Row 1 (Data): A C 08-fresh has an S sub B E T of 197, a pore volume of 0.268, and a pore size of 54.5.
Row 2 (Data): A C 08-spent has an S sub B E T of 100, a pore volume of 0.185, and a pore size of 74.1.
Morphological investigation
The morphology of the optimized catalyst (AC-08) was investigated before and after usage in the olefin-removal process (T = 160°C and P = 11 bar). The structure of the spent sample (Fig. 8b) is degraded compared with the fresh sample (Fig. 8a). This structural degradation of the catalyst is the main reason for the significant decrease in its catalytic activity during the processing time. The effect of the pressure of gas and high temperature causes the destruction of smaller-sized pores and the deformation of the structure, which is observed in SEM images of the activated clay after the olefin-removal process. Note that this finding is consistent with the BET results presented in Table 7.
SEM images of: (a) fresh; and (b) spent acid-activated samples.

Figure 8. Long description
A two-panel S E M micrograph set.
Panel a, located on the left, shows the fresh acid-activated sample. It features distinct, irregular clusters of material with relatively smooth, plate-like surfaces and sharp edges. The particles appear loosely packed with visible voids between the larger aggregates. A scale bar at the bottom right indicates 2 micrometers.
Panel b, located on the right, shows the spent acid-activated sample. The morphology has shifted to a more fragmented and densely packed appearance. The individual clusters seen in the fresh sample are now covered with smaller, granular debris and finer particles, suggesting surface degradation or deposition during use. The overall texture is rougher and more heterogeneous than the fresh sample. A scale bar at the bottom right indicates 2 micrometers.
Conclusions
In the present study, the effects of various bentonite=to-acid relative ratios were investigated during acid activation under constant preparation conditions. NH3-TPD and BET analyses were conducted to evaluate the properties of the catalysts synthesized. Based on the results of these analyses, bentonite/acid = 0.8 was ultimately identified as the optimal ratio for clay activation. Afterward, bentonite-based catalysts were prepared using purification and acid activation, and their performance in olefin removal from aromatic compounds was evaluated. The samples were synthesized using different types of water and were compared in terms of structure, phase, and acidity differences. The XRD patterns show the effective dissolution of the montmorillonite phase as a result of acid activation in deionized water purification and the activation process. In addition, the NH3-TPD analysis results indicate the significant role of Lewis acid sites in the olefin-removal process from aromatic compounds, which are mainly formed in activated, purified bentonite. The catalytic performance of the samples in the olefin-removal process from aromatic compounds at 160°C indicates the superior performance of the catalyst prepared totally with deionized water. This is due to the presence of various ions in urban water, which prevents efficient extraction of exchangeable ions. The AAS analysis of raw bentonite and other samples confirmed this issue. The optimized catalyst (AC-08) maintained the BI below 20 mg per 100 g for 370 h, demonstrating the best performance compared with other samples.
Acknowledgments
None.
Author contributions
Hamid Pourdelan, Azadeh Papan, and Maryam Mirasgari contributed to the study conception, design, experimental work, data analysis, interpretation of the results, and manuscript preparation. Hajar Ghanbari contributed as a consultant to the research. Amin Mardanloo, as the Head of the Research and Development Department at Khwarizmi Technology Development Company and the corresponding author, supervised the research process and contributed to the final revision of the manuscript. All authors reviewed and approved the final version of the manuscript.
Financial support
This research did not receive any specific financial support from governmental organizations, academic institutions, or other funding agencies. All research expenses were fully covered by Khwarizmi Technology Development Company.
Data availability statement
Data are available from the corresponding author upon reasonable request.