1 Introduction
Many are concerned that the US health care workforce may prove inadequate for meeting projected patient demand, especially within primary care settings (Bodenheimer and Pham, Reference Bodenheimer, Chen and Bennett2010; Hofer et al., Reference Hofer, Abraham and Moscovice2011; Kirch et al., Reference Kirch, Henderson and Dill2012; Huang and Finegold, Reference Huang and Finegold2013). Health insurance changes operating through the Affordable Care Act (ACA) are expected to increase overall demand for services but perhaps more intensely within expanding insurance groups. Millions of individuals will be newly eligible for Medicaid benefits within participating states (Sommers et al., Reference Sommers, Gordon, Somers, Ingram and Epstein2013), and presumably these new enrollees will want their coverage gains to improve their access to care. On the supply side, this poses several challenges, including delivering sufficient services to a patient group historically associated with lower reimbursements and less desirability from the plurality of providers. Which practices will ultimately accommodate these new Medicaid beneficiaries in the wake of expansions remains an open question – one important for evaluating this component of the ACA.
The structure and organization of clinical practices has been of long-standing interest to researchers and policy-makers, with a particular focus on how the combinations of different types of providers (physicians, nurse practitioners, and physician assistants) and supporting staff influence their clinical output (Reinhardt, Reference Reinhardt1972; Newhouse, Reference Newhouse1973; Kehrer and Intriligator, Reference Kehrer and Intriligator1974; Zeckhauser and Eliastam, Reference Zeckhauser and Eliastam1974; Stimson and Charles, Reference Stimson and Charles1975; Boardman et al., Reference Boardman, Dowd, Eisenberg and Williams1983; Brown, Reference Brown1988; Richards et al., Reference Richards, Carley, Jenkins-Clarke and Richards2000; Thurston and Libby, Reference Thurston and Libby2002; Hogg et al., Reference Hogg, Rowan, Russell, Geneau and Muldoon2008; Dobson et al., Reference Dobson, Pinker and Van Horn2009). While many of these studies emphasize measures of efficiency and broad productivity (e.g. number of visits per week), less work has detailed the relationships between provider mix and access for various patient-payer groups. Insights into whether certain clinic structures are more willing providers to different patients – and under what conditions – can help shape expectations for the ongoing expansions as well as present policy opportunities to couple with current health reforms.
Within this work, we leverage experimental (audit study) data to examine the associations between primary care clinics’ provider mix and their accessibility to prospective new patients. We specifically focus on Medicaid beneficiaries and non-physician providers (i.e. nurse practitioners and physician assistants) to empirically explore whether practices with more non-physician staff are more willing to accommodate new Medicaid patients into their existing patient panel. We likewise investigate if greater use of non-physician clinicians (NPCs) translates to cheaper visits supplied to the market, more generally. However, state-to-state variation in practice restrictions for these providers suggests possible heterogeneity across regulatory environments. Thus, we incorporate these regulatory differences across states to enhance our analyses. Our findings support the notion that greater provider mix translates to lower cost appointments and improves access for lower reimbursing patients (i.e. Medicaid enrollees) – but these associations are only found in states with favorable scope of practice laws toward NPCs.
While largely descriptive, our unique data and set of compelling results offer a new angle on the implications of clinic structure for the availability of primary care services – especially for disadvantaged patient groups. Our work also suggests that relaxing some provider regulations could be an efficient and timely way for states to cope with post-ACA increases in demand for care.
2 Provider mix and the price at the margin
Delivering medical care in the US is a complicated affair since the same service (e.g. a new patient visit) can receive widely varying levels of compensation. Practices are effectively selling their services to multiple markets (e.g. privately insured and Medicaid) and therefore sensitive to the relative prices between them (Sloan et al., Reference Sloan, Mitchell and Cromwell1978; Cromwell and Mitchell, Reference Cromwell and Mitchell1984). Relatedly, clinics differ in their costs for providing services, which can reflect different practice styles and targeted consumers (Boardman et al., Reference Boardman, Dowd, Eisenberg and Williams1983) and/or differences in resource utilization. Thus, the combination of prevailing fees in available markets and intrinsic practice costs determine much of the distribution of services to different patient-payer groups.
One potential mechanism to lower service delivery costs is the blending of physician and non-physician labor within a practice (Roblin et al., Reference Roblin, Howard, Becker, Adams and Roberts2004). Clinicians’ human capital is one of the more expensive and adjustable inputs for a practice, and it can be allocated to a host of tasks (Kehrer and Intriligator, Reference Kehrer and Intriligator1974; Richards et al., Reference Richards, Carley, Jenkins-Clarke and Richards2000; Dobson et al., Reference Dobson, Pinker and Van Horn2009). For various services, different providers can play substitutive or complementary clinical roles (Zeckhauser and Eliastam, Reference Zeckhauser and Eliastam1974; Stimson and Charles, Reference Stimson and Charles1975; Marsh, Reference Marsh1991; Jacobson et al., Reference Jacobson, Parker and Coulter1998; Richardson et al., Reference Richardson, Maynord, Cullum and Kindig1998; Richards et al., Reference Richards, Carley, Jenkins-Clarke and Richards2000; Cooper and Aiken, Reference Cooper and Aiken2001; Thurston and Libby, Reference Thurston and Libby2002), and substituting NPCs for physicians is one plausible strategy to lower some costs (Reinhardt Reference Reinhardt1972; Cooper, Reference Cooper2001; Cooper and Aiken, Reference Cooper and Aiken2001; Glied et al., Reference Glied, Prabhu and Edelman2009). If true, then a physician practice staffing more non-physician providers should be more likely to accept patients from the lower-paying market (i.e. Medicaid) since the reimbursement rate is more likely to meet or exceed the marginal costs of providing care.
Yet, clinics’ staffing choices and the subsequent effects on their costs may depend on existing scope of practice legislation. Provider regulations impose a policy constraint on practices (Zeckhauser and Eliastam, Reference Zeckhauser and Eliastam1974; Kleiner et al., Reference Kleiner, Marier, Won Park and Wing2014) by prohibiting non-physicians from performing some clinical duties or mandating physician involvement (effectively making use of NPCs more costly to the practice). Under these restrictions, physicians and non-physicians become more like complements (Buchmueller et al., Reference Buchmueller, Orzol and Shore-Sheppard2014), which narrows the substitution – and hence cost-lowering – possibilities for practices desiring to do so. Regulations that drive up the costs of producing services consequently make visits more expensive on the margin and make it more likely that low-reimbursing (i.e. Medicaid) patients are turned away. We can illustrate this possibility in Figure 1.
Representative practice cost curves by presence of non-physician providers and scope of practice regulation. Adapted from Cromwell and Mitchell (Reference Cromwell and Mitchell1984). SOP=scope of practice; NP=nurse practitioner.

With light regulation, a practice supplies considerably more services to the Medicaid market (S3 compared to S1) all else equal; however, extensive NPC regulations undo much of the cost-savings from having a mix of providers in the clinic (S2 compared to S1) – leaving Medicaid volume largely unchanged.
Existing research highlights the importance of Medicaid prices on enrollee access (McGuire and Pauly, Reference McGuire and Pauly1991; Baker and Royalty, Reference Baker and Royalty2000; Cunningham and Cunningham, Reference Cunningham and Cunningham2005; Decker, Reference Decker2007, Reference Decker2009; Buchmueller et al., Reference Buchmueller, Miller and Vujicic2013), but practice costs are the other side of the same coin. Policies that raise all practice costs or shrink the variance in costs across practices can have the same deleterious effects on access as a fall in Medicaid’s reimbursement rate. Less provider restrictions (i.e. granting full non-physician autonomy), on the other hand, can encourage more services supplied to these patients, who often struggle to find adequate access.
Admittedly, other factors likely influence practices’ labor tradeoffs as well. Increasing the numbers and types of providers within the clinic can make coordinating care between them more difficult (Newhouse, Reference Newhouse1973; Dobson et al., Reference Dobson, Pinker and Van Horn2009), and some local consumers may have preferences for which provider types deliver certain aspects or quantities of care. But at the very least, scope of practice laws have the potential to introduce a market distortion that can lower patient welfare (Glied et al., Reference Glied, Prabhu and Edelman2009) – perhaps most for already disenfranchised groups.
3 Scope of practice landscape and non-physician workforce
Limits on provider activities can happen at the state and federal level in the United States – although the former is more common due to states’ licensing function (Cooper and Aiken, Reference Cooper and Aiken2001). While most states require similar qualifications for a specific provider type (e.g. advanced nurse practitioner), there are remarkable differences across states in what a given type is ultimately allowed to do (Pohl et al., Reference Pohl, Hanson, Newland and Cronenwett2010; Schiff, Reference Schiff2012). For instance, only 18 states in 2012 offer nurse practitioners full authority to see, treat, and prescribe for patients, while the remaining states mandate physician accompaniment to varying degrees – such as phone or in-person consultation (Cassidy, Reference Cassidy2013).
Despite differing and often unfavorable regulations, the non-physician workforce continues to expand across the nation and play an increasing role in primary care (Cooper, Reference Cooper2001; Naylor and Kurtzman, Reference Naylor and Kurtzman2010; Stange, Reference Stange2014). At the same time, patients generally express satisfaction with care from NPCs (Laurant et al., Reference Laurant, Akkermans, Sibbald and Grol2008), and clinical studies show that the quality and adequacy of primary care services delivered by NPCs are comparable to that of physicians (Mundinger et al., Reference Mundinger, Kane, Lenz, Totten, Tsai, Cleary, Friedewald, Siu and Shelanski2000; Lenz et al., Reference Lenz, Mundinger, Kane, Hopkins and Lin2004; Wright et al., Reference Wright, Romboli, DiTulio, Wogen and Belletti2011). With this backdrop, a strong chorus advocates for less restrictive scope of practice legislation as a means to improve access throughout the health care system (IOM, 2010; Naylor and Kurtzman, Reference Naylor and Kurtzman2010; Pohl et al., Reference Pohl, Hanson, Newland and Cronenwett2010; Fairman et al., Reference Fairman, Rowe, Hassmiller and Shalala2011; Hofer et al., Reference Hofer, Abraham and Moscovice2011; Schiff, Reference Schiff2012; Cassidy, Reference Cassidy2013; Spetz et al., Reference Spetz, Parente, Town and Bazarko2013).
4 Data
Our data are from a simulated patient (audit) experiment, which was a large field study approved by the Institutional Review Board at the University of Pennsylvania and conducted in 10 US states between November 2012 and March 2013. The states are diverse and include Arkansas, Georgia, Illinois, Iowa, Massachusetts, Montana, New Jersey, Oregon, Pennsylvania and Texas (Rhodes et al., Reference Rhodes, Kenney, Friedman, Saloner, Lawson, Chearo, Wissoker and Polsky2014). Here, we provide an abbreviated overview of the experiment, see Rhodes et al. (Reference Rhodes, Kenney, Friedman, Saloner, Lawson, Chearo, Wissoker and Polsky2014) for a complete description of the study (including a supplementary appendix) and aggregate state estimates.
Using a census of physicians from a commercial research firm, a sample frame of existing clinics serving working-age adults with at least one active primary care physician (i.e. family medicine, general medicine, or internal medicine) was created for each state. The study used trained interviewers, posing as standardized patients, to call randomly selected offices within the sample frame. Interviewers’ insurance status (private, Medicaid, or self-pay) and stated reason for a visit (either wellness visit or follow up from a recent hypertension screening) were also randomized to separate insurance type from other unobserved factors that could drive practice acceptance rates for new patients. After contacting the randomly drawn practice, callers requested new patient visits, recorded their subsequent appointment status, and cancelled all appointments at the conclusion of the call. Conditional on receiving an appointment at the contacted clinic, self-pay callers then elicited the out-of-pocket expense they would have to bear at the time of visit in order to be seen – thereby receiving a direct, real-time price quote from the physician practice. This provides a unique and attractive component for the data in that we observe a measure of real prices for office visits as opposed to common proxies (such as charged amounts or geographically aggregated amounts).
The experimental sample was independently drawn within each insurance type from offices within the sample frame and in relation to the proportion of the population with the insurance type in the county where the call was to be made. The pool of practices eligible for Medicaid calls was further restricted to clinics within Medicaid managed care (MMC) networks or Medicaid Primary Care Case Management (PCCM). All clinics were contacted in a pre-experimental non-deceptive call to collect information about the clinic, including provider mix (number of physicians and non-physician providers – NPs and PAs). These calls also served to ascertain that all offices eligible for an experimental call – regardless of type (e.g. primary care clinics or multi-specialty clinics with at least one primary care physician) – provided relevant adult primary care services. We also note that 80% of the audit clinics are exclusively primary care (i.e. family medicine, general medicine or internal medicine practices) and removing the multi-specialty clinics (that also deliver primary care) from our analyses does not alter our pattern of findings (results available upon request).
With the field study data available, we then classify the 10 states by their current scope of practice regulatory environment. We deem a state as ‘liberal’ – in a market rather than political sense – with respect to its laws if the state grants full autonomy to NPCs in terms of ability to independently see, diagnosis, treat, and prescribe (Fairman et al., Reference Fairman, Rowe, Hassmiller and Shalala2011; Cassidy, Reference Cassidy2013). These regulations primarily apply to NPs, but this is also the provider type most likely to fully substitute for physician primary care duties. Moreover, the majority of NPs in the US work in primary care practices; meanwhile, the large majority of PAs work in specialist practices (Hooker and Berlin, Reference Hooker and Berlin2002; Bodenheimer et al., Reference Bodenheimer, Berenson and Rudolf2009). Three of the ten study states fall into the ‘liberal’ category (Iowa, Montana, and Oregon). The remaining seven states are a blend of moderate regulation states and fully restrictive states (i.e. those mandating full physician involvement in care provided by non-physician clinicians).
The full field study data set includes 11,347 completed cases; however, we restrict our analytic sample to all calls to clinics that are not designated as Federally Qualified Health Centers (FQHCs) (including FQHC ‘look-alikes’) or Rural Health Clinics (RHCs), which removes a total of 924 observations. These clinics generally have different objective functions, clinic structures, finances and constraints relative to the typical physician practice. Additionally, they receive special reimbursements for Medicaid patients. The FQHC and RHC components of the data are fully detailed in other work (Richards et al., Reference Richards, Saloner, Kenney, Rhodes and Polsky2014, Reference Richards, Saloner, Kenney, Rhodes and Polsky2015). After removing the minority of cases (3.7%) with missing information on the number of NPCs working within the clinic,Footnote 1 we have 10,034 calls from privately insured, self-pay and Medicaid groups for our primary analyses. County-level measures (poverty rate, unemployment rate, and fraction of the population African-American) come from the Area Health Resource File. Corresponding zip code level measures are from the American Community Survey. All other variable information is directly from the audit study.
5 Methods
We examine three specific outcomes. The first two capture the willingness of a practice to accept a new patient from a particular payer type. The latter outcome reflects the entry fee quoted to self-pay patients in order to be seen. We can then compare the consistency of the experimental data with what economic theory might predict.
5.1 New patient acceptance
Our primary outcome of interest is a binary indicator for whether an appointment was granted to the new patient caller. We then augment this outcome using a within-clinic measure. While the audit study was not designed to deliver paired calls to all randomly sampled clinics, over 2500 clinics did receive a call from both Medicaid and privately insured callers. This is useful as the Medicaid calls were restricted to clinics indicating participation in an MMC or PCCM program. We use this subset of clinics to determine if our findings generalize to practices already tilted toward providing Medicaid care. The within-clinic component of our work also has stronger internal validity because it eliminates the possibility that an imbalance in the practices within the experimental arms might be contributing to any observed differences in the primary outcome. We define this measure as a binary variable equal to ‘1’ when the privately insured caller is granted an appointment but the Medicaid caller is not within the same physician practice.
5.2 Primary care visit price
The final outcome complements our study’s central focus by using the self-pay experimental arm to explore visit prices. The continuous measure reflects the out-of-pocket payment that would be required of self-pay patients at the time of their scheduled visit in order to keep their appointment. This unique data feature allows us to model how a measure of primary care service price varies with provider mix and offers some corroborating evidence in relation to our conceptual starting points.
5.3 Empirical models
We begin with linear probability models (LPMs) to estimate the associations between greater numbers of physician and non-physician providers and the likelihood of receiving an appointment for Medicaid and self-pay patients relative to privately insured patients. We focus on the relative difference (or access gap) since the privately insured group can serve as an access benchmark within a state and also help control for overall practice capacity within the state (e.g. if states with different regulatory regimes also have relatively more or less busy primary care practices). Our first least squares regression specification uses a single call to a given practice as the unit of observation. We use two indicator variables for patient type (Medicaid and self-pay), with privately insured patients as the omitted category. We then construct a set of variables to reflect practices’ mix of providers within the office. The first group is an exhaustive list of three categorical variables for number of physicians within the practice (one, two to three, and four or more physicians). We use solo physician practices as the base group, and we follow this with a single indicator for the presence of any NPCs in the practice – making practices with no NPCs the omitted category. We can then fully interact our patient type indicators (Medicaid and self-pay) with our set of provider mix variables to reveal any appointment granting differentials for practices using non-physician staff. We also include controls for caller demographics and stated reason for the visit, county characteristics, and state fixed effects. As a sensitivity check, we replace the county characteristics with zip code characteristics – the results are virtually identical (available upon request).
Importantly, we then partition the analytic sample by state regulation groups (‘liberal’ and ‘all others’) to present separate estimates alongside the full sample. A qualitatively different set of findings across the two collection of states can reveal important heterogeneity that may be disguised in the full sample models and suggest richer complexity for these relationships. Additionally, analyzing the data by regulatory grouping (as opposed to a pooled sample with a policy variable interaction) allows us to retain state fixed effects, which can account for state-level differences, such as primary care capacity or prevailing Medicaid reimbursements set by state legislators/administrators. However, our key practice-level variation remains the degree of provider mix diversity (i.e. the presence or absence of NPCs) within offices.
The results from our primary specification, which include all three patient groups, then motivate the narrowing of our attention to the Medicaid population. To do so, we focus on clinics receiving two types of experimental calls. The unit of observation is now the individual practice (where both a commercial insurance and Medicaid call were made) and includes 2473 clinics for our analyses. The specification is also now simpler as we only need our dummy variables for a practice’s provider mix (two indicators for physician counts, and one indicator for use of NPCs). The coefficient for the NPC variable captures the association between more non-physicians in the practice and likelihood of disparate appointment granting across these two key payer groups. We also include the same caller and geographic information as in the first model, and estimate the model for the full 10 states and then by the scope of practice groups to explore any heterogeneity corresponding to prevailing regulations.
Our final model for visit cost to the patient (continuous outcome) is identical to the preceding least squares model except that the unit of observation is once again an individual call (only self-pay observations are relevant to this outcome). While outlier price quotes may be of concern, the first moment of the outcome’s distribution is close to the median.
Throughout our empirical analyses, observations are weighted according to the proportion of the population that has the same insurance status within the county where the call was made, and the standard errors are clustered at the county level. We also rely on LPMs as opposed to non-linear models for our binary outcomes due to the ease of presenting and interpreting results and the desire to compare coefficients across models (Allison, Reference Allison1999; Mood, Reference Mood2010).
6 Results
Table 1 provides a snapshot of practices’ provider mix within the data. The majority of practices are relatively small in terms of physician and non-physician counts within a given clinic (top portion of Table 1).
Summary provider mix for the full sample and by regulatory environment (excluding FQHC and RHC clinics)

FQHC=Federally Qualified Health Centers; RHC=Rural Health Clinic.
Restricting to unique non-FQHC and non-RHC practices in the study sample without missing information on provider mix (6468 clinic observations in total).
Non-physician clinicians (NPCs) include nurse practitioners and physician assistants.
While primary care clinics in liberal regulation states have a larger fraction with at least one non-physician provider on staff (~55%), use of NPCs is not uncommon in states with stricter policy regimes (~40%). This is also evident within the bottom portion of Table 1, which shows summary measures of NPC staffing by the three physician practice size categories. Two data patterns standout: first, practices often rely on labor from NPCs irrespective of scope of practice laws (especially as the clinic size grows), and second, the provider compositions are not extremely different between regulatory groups. Most of the discrepancies across policy environments are found on the extensive margin (i.e. the use of any non-physician providers) for smaller physician practices. Table 2 provides summary measures for new patient appointment rates amongst the three patient groups for the three SOP categories. Overall willingness to accept new patients is comparable across regulatory settings.Footnote 2
Mean new patient acceptance rates by insurance type and regulation groups
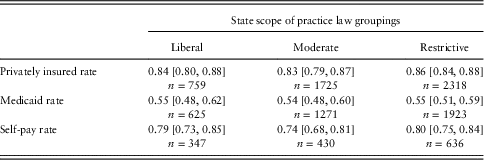
Sample restricted to Non-FQHC and Non-RHC practices.
95% confidence intervals in parentheses.
‘SOP’: Scope of Practice regulatory environment, ‘Liberal’ includes IA, MT, and OR.
Table 3 contains our core findings and demonstrates how practices’ characteristics are associated with the probability of receiving an appointment by insurance status of the caller. For privately insured patients (holding the number of NPCs fixed), appointment rates improve as the size of the physician group increases. This positive association holds within each regulation group (column 2 and column 3). Appointment rates by number of physicians for Medicaid patients are often not significantly different from private patients; although, the interaction estimates are typically negative (and significant in column 3), suggesting less of a positive relationship between number of physicians and appointment rates for Medicaid patients. The interaction estimates for the self-pay group are small in magnitude and never statistically significant in any model. Focusing on the coefficients for NPCs in the bottom portion of Table 3, column 1 indicates that more NPCs increase the likelihood a privately insured caller receives an appointment – with no evidence of a differential for the Medicaid or self-pay groups, holding all else constant. However, substantive heterogeneity is revealed when the sample is stratified by existing scope of practice laws. The findings for the full 10 states (column 1 Table 3) appear entirely driven by the large and strong associations within the three liberal legislation states. The association for non-physician providers in liberal states (column 2) implies as much as a 18 percentage point increase in the probability a Medicaid caller receives an appointment (adding the constitutive and interaction coefficients), which is more than twice the magnitude of the association for privately insured callers (constitutive coefficient only). Column 3, comprising moderate and restrictive scope of practice states, shows no similar pattern. The estimates for all three patient groups in column 3 suggest no NPC relationship with the likelihood of receiving an appointment.
OLS regressions for probability of receiving an appointment for all states and by scope of practice environment

NPC=non-physician clinician (nurse practitioners and physician assistants)
*p value at 0.10 level; **p value at 0.05 level; ***p value at 0.01 level.
Standard errors in parentheses and clustered at the county level, observational weights used.
Caller controls: acute scenario and demographics.
County controls: poverty rate (including quadratic), unemployment rate, and fraction of the population African-American
‘SOP’: Scope of Practice regulatory environment, ‘Liberal’ includes IA, MT, and OR.
Sample restricted to Non-FQHC and Non-RHC calls.
Replacing the county measures with zip code level measures provides virtually identical results (available upon request).
Within Appendix Table A1, we explore the same relationships within a given physician practice size to assess if the patterns are meaningfully different for smaller versus larger practices. We also use finer grain cutoffs for number of physicians and number of NPCs as a further sensitivity check. The pattern of estimates closely parallels the findings in Table 3, and despite the demands these specifications place on the data, the estimates generally maintain their statistical significance. Moreover, the common findings across the various physician practice sizes suggest that non-physicians’ relationship with Medicaid access is not confined to very large groups (e.g. ‘Medicaid mills’) or other uncommon practice organizations.
Table 4 and Table 5 present the results for our within-clinic access measure and visit price measure, respectively. The same theme from Table 3 emerges. More NPCs on staff is associated with an 12 percentage point lower likelihood of disparate access between privately insured and Medicaid patients, but again, only within states with lighter regulatory burdens (Table 4, column 2). Similarly, a mix of providers within the clinic is associated with a visit price that is $29 cheaper on average in the Liberal SOP states (Table 5, column 2). While this does not reveal the practices’ actual cost functions or marginal costs for accepting a new patient, it is corroborating evidence for our prior arguments – although caution is encouraged due to modest sample sizes. It is also consistent with the notion that practices in liberal policy states can substitute for physician labor to generate more product differentiation – and hence price variation – in the market. Practices in other states appear unable to do likewise, as there is no meaningful correlation between practices’ provider composition and appointment prices.
Probability of a within clinic access difference for Medicaid callers relative to private callers

*p value at 0.10 level; **p value at 0.05 level; ***p value at 0.01 level.
Standard errors in parentheses and clustered at the county level, observational weights used.
Caller controls: acute scenario and demographics, sample restricted to non-FQHCs and Non-RHCs.
County controls: poverty rate (including quadratic), unemployment rate, and fraction of the population African-American
OUTCOME is equal to ‘1’ if, within the same clinic, the privately insured patient received an appointment but the Medicaid patient did not (i.e. there is evidence of a disparity in appointment rates by insurance type in the subset of clinics receiving two calls).
Provider mix associations with out-of-pocket costs at time of appointment for self-pay (cash) patients

*p value at 0.10 level; **p value at 0.05 level; ***p value at 0.01 level.
Standard errors in parentheses and clustered at the county level, observational weights used.
Caller controls: acute scenario and demographics.
County controls: poverty rate (including quadratic), unemployment rate, and fraction of the population African-American.
Sample restricted to Non-FQHCs and Non-RHCs and cash-paying (no insurance) callers receiving an appointment
Replacing the county measures with zip code level measures provides virtually identical results (available upon request).
We also note that results for moderate SOP states in isolation (data not shown) are sometimes suggestive of an intermediate case (e.g. some estimates hint at increased willingness to accept a new Medicaid patient with more NPCs on staff). However, the associations are never as strong or consistent as those found among the liberal SOP states.
7 Discussion
The supply of non-physician providers has grown considerably through the years, and our data, along with others, indicate that they are now integral parts of many US physician practices. Not surprisingly, research spanning several decades has investigated their subsequent impact on the delivery of care. However, much less emphasis has been placed on differential access implications across payers, and importantly, if scope of practice regulations moderate these relationships. Using data from a large-scale field study, we provide new evidence relevant to each of these research and policy areas.
Our findings suggest that practices with NPCs are associated with greater willingness to accept new Medicaid patients – so long as the policy environment is right. Conversely, states that withhold clinical autonomy from non-physicians show no perceptible differences with more NPCs on staff. Looking at the subset of clinics receiving experimental calls from both insurance groups further underscores these relationships. The full sample results incorrectly imply a lower likelihood of within-clinic differences when NPCs are present (Table 4), but in actuality, the appointment disparity is only meaningfully narrowed within liberal scope of practice states. And in accordance with our conceptual setup, these same practices also supply cheaper visits to self-pay patients – consistent with some other contemporary findings for medical and dental services (Spetz et al., Reference Spetz, Parente, Town and Bazarko2013; Kleiner et al., Reference Kleiner, Marier, Won Park and Wing2014; Wing and Marier, Reference Wing and Marier2014). While we consider our results as descriptive in nature, we argue that the set of findings is both compelling and benefits from its logical consistency.
Another recent paper by Stange (Reference Stange2014) finds minimal evidence of access or cost-of-care improvements with a greater supply of NP and PA clinicians – even within states with less onerous regulations. However, the author notes that the positions of these providers within different practice organizations may have greater implications than aggregate supply. Our empirics are consistent with his conjecture and bolster arguments made by Kirch et al. (Reference Kirch, Henderson and Dill2012) that relaxing some scope or practice constraints could release some productive capacity that is otherwise underutilized.
More broadly, the ACA will ‘create’ more health care consumers by construction, with perhaps the largest increases due to Medicaid expansions. This is likely to test the existing US primary care infrastructure in one or more ways (Hofer et al., Reference Hofer, Abraham and Moscovice2011). Primary care’s low popularity among current physicians and the long training times for new clinicians could also challenge any near-term adjustments to shifts in demand (Whitcomb and Cohen, Reference Whitcomb and Cohen2004; Bodenheimer et al., Reference Bodenheimer and Pham2007; Steinbrook, Reference Steinbrook2009; Bodenheimer and Pham, Reference Bodenheimer, Chen and Bennett2010). For these reasons, a missing piece in the health reform puzzle may be a concomitant movement toward more accommodating policies for NPC practice and payment. Doing so is likely more efficient than short-run investments in greater provider volume (e.g. increasing primary care physician trainees or medical students) and is also consistent with other contemporary shifts in health care delivery, such as the medical-home model and team-based care (Rosenthal, Reference Rosenthal2008; Rittenhouse and Shortell, Reference Rittenhouse and Shortell2009; Reid et al., Reference Reid, Coleman, Johnson, Fishman, Hsu, Soman, Trescott, Erickson and Larson2010).
Besides expediting supply-side adjustments to any ACA-induced spikes in demand, granting primary care practices greater flexibility in their staffing choices is valuable within a market characterized by multiple prices for the same good (e.g. a new patient visit). This can facilitate lower costs of delivering care for practices desiring to do so and consequently improve access for patients associated with lower reimbursement rates. Additionally, greater product differentiation – and thereby price variation – in local markets could also help new exchange plans keep their prices low while preserving wider networks. Patient welfare, and Medicaid enrollees in particular, could be better off in terms of access – with no evidence to date that quality of care would suffer (Mundinger et al., Reference Mundinger, Kane, Lenz, Totten, Tsai, Cleary, Friedewald, Siu and Shelanski2000; Lenz et al., Reference Lenz, Mundinger, Kane, Hopkins and Lin2004; Laurant et al., Reference Laurant, Akkermans, Sibbald and Grol2008; Ohman-Strickland et al., Reference Ohman-Strickland, Orzano, Hudson, Solberg, DiCiccio-Bloom, O’Malley, Tallia, Balasubramanian and Crabtree2008; Wright et al., Reference Wright, Romboli, DiTulio, Wogen and Belletti2011; Kleiner et al., Reference Kleiner, Marier, Won Park and Wing2014).
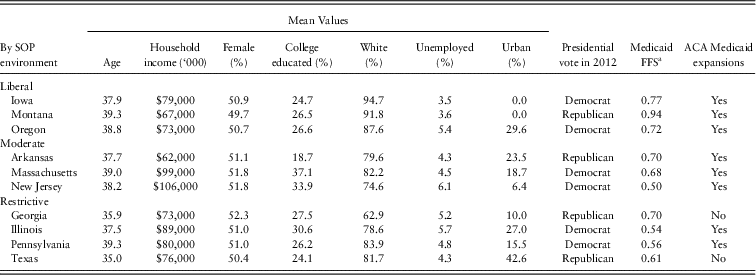
That said, politics and other underlying motivations could speed up or slow down any movement toward lighter NPC regulation. While a full elaboration of this dimension is beyond the scope of this work, we list some socioeconomic and policy descriptive information for each of the 10 audit states within Appendix Table A2. It is not obvious that only certain types of states are willing to adopt more expansive SOP laws. The mix of characteristics among the ‘liberal’ group is comparable to the more restrictive SOP clusters – with one noticeable exception: urbanization. The need for more providers in rural areas may have galvanized less restrictive provider laws in these states, but a similar ‘out-of-necessity’ motivation may be sufficient for other states in the wake of 2014 coverage expansions. Additional sensitivity tests focused on the urban-rural element also confirm that our findings are not driven by this factor (i.e. ‘liberal’ states being more rural and thereby using NPCs differently than the other seven states in the data – irrespective of SOP environment).Footnote 3 Thus, the relationships between SOP laws and adult primary care services demonstrated in our study seem to go beyond any ‘rural effect’.
7.1 Limitations
This study is not without its limitations. While these data are unique and valuable, they are not nationally representative and only 3 of the 10 study states qualify as having ‘liberal’ provider regulations. Another clear limitation is the fact that states differ on other margins besides scope of practice laws, which may contribute to the associations we find between provider mix and willingness to accept new Medicaid patients within different SOP environments. The single cross-section also precludes us from observing changes in the laws over time, which could help separate out these effects. That said, we have intentionally explored the data in certain ways and from multiple angles to partly assess the validity of such concerns. For example, we estimate differences for practices with and without NPCs that exist in the same state and hence policy environment – rather than across states. Additionally, to claim that other policies underlie the pattern of results we find for Medicaid patient acceptance, the same policies must also explain the findings we see for primary care visit prices across scope of practice settings.
We admittedly lack granular detail on the diversity of NPCs within a given clinic and the various tasks they perform. For the former, different regulations may have a disproportionate impact on certain types of NPCs, and for the latter, we plan to investigate this more with different data in future work. Our static view also cannot inform us as to why some practices use more NPCs than others. This may result from some unobserved strategic decisions by practices in response to their local market environment – but these unobserved differences would again have to vary across our two regulatory groups in order to fully explain our findings. Our existing data also cannot speak to the presence and influence of non-physician managed clinics (e.g. those run by NPs) on the supply of Medicaid services since the audit study’s sample frame excludes clinics without any physician staff.
Finally, we have intentionally downplayed our results for private insurance callers, and instead focused our attention on appointment differentials between Medicaid and private callers, for two reasons: first, insofar as NPCs lower the cost of providing the marginal visit, this should typically have more importance within the lower-priced market. Second, the field study design does not reflect consumer tastes for different styles of practices and what types of providers are seen – which is likely to be more heterogeneous among the larger and more diverse commercially insured group. Thus, while a privately insured patient may be offered an appointment at a slightly higher rate in a clinic with more non-physicians on staff, in reality, the patient may have never sought care there in the first place.
8 Conclusion
As the makeup and operations of primary care clinics continue to evolve along numerous dimensions, there is a need to better understand if and how much practice organization influences access for different patient-payer types. In this way, our study is both timely and relevant to the broader events reshaping the US health care landscape.
According to our findings, in states where provider labor can be more easily exchanged, appointment availability is dramatically better with a mix of providers on staff – particularly for Medicaid patients, who often struggle to find willing sources of care. Blending provider types within a clinic is universally common, but the implications for accepting new patients varies in our study according to the regulatory constraints imposed on NPCs. If these laws are the underlying reasons for our empirical observations, then lowering regulatory hurdles for NPCs may facilitate improved access for patients – especially as providers seek lower cost ways to deliver care (Pohl et al., Reference Pohl, Hanson, Newland and Cronenwett2010; Fairman et al., Reference Fairman, Rowe, Hassmiller and Shalala2011). More accommodating SOP laws may also better utilize existing providers without requiring more resources devoted to training new ones. While not the only ingredient to ensure a sufficient supply of health services over the long-term, relaxing some regulations could improve patient welfare in the short-term.
Acknowledgments
The authors gratefully acknowledge the Robert Wood Johnson Foundation (grant 70160) for its generous funding of the ongoing audit study project and wish to thank the many excellent team members contributing to this larger research effort, including: Karin Rhodes, Genevieve Kenney, Brendan Saloner, Ari Friedman, Douglas Wissoker and David Chearo. The funding source had no involvement in the design, analyses, or manuscript preparation for this study. The authors also thank Helen Levy, Sean Orzol, and participants at the ASHEcon and APPAM 2014 conferences for providing valuable feedback on this work. The authors have no conflicts of interest to disclose, and all expressed views and remaining errors are their own.
Appendix
OLS regressions for probability of receiving an appointment for all states and by scope of practice environment within physician practice size

Select state population and policy characteristics for audit sample in 2012