




No CrossRef data available.
Article contents
- Abstract
- 1. INTRODUCTION
- 2. RANKINGS USING THEORETICAL ECONOMETRICS CONTRIBUTIONS
- 3. RANKINGS USING ALL CONTRIBUTIONS IN ECONOMETRICS
- 4. THE ECONOMETRICIANS' HALL OF FAME
- 5. IMPACT FACTOR: QUALITY ADJUSTED RANKINGS
- 6. RANKINGS OF INDIVIDUALS AND ACADEMIC INSTITUTIONS BY JOURNAL
- 7. CONCENTRATION RATIOS
- 8. GEOGRAPHICAL FACTORS
- 9. CONCLUDING COMMENTS
- References
WORLDWIDE INSTITUTIONAL AND INDIVIDUAL RANKINGS IN ECONOMETRICS OVER THE PERIOD 1989–1999: AN UPDATE
Published online by Cambridge University Press: 08 January 2003
Article contents
- Abstract
- 1. INTRODUCTION
- 2. RANKINGS USING THEORETICAL ECONOMETRICS CONTRIBUTIONS
- 3. RANKINGS USING ALL CONTRIBUTIONS IN ECONOMETRICS
- 4. THE ECONOMETRICIANS' HALL OF FAME
- 5. IMPACT FACTOR: QUALITY ADJUSTED RANKINGS
- 6. RANKINGS OF INDIVIDUALS AND ACADEMIC INSTITUTIONS BY JOURNAL
- 7. CONCENTRATION RATIOS
- 8. GEOGRAPHICAL FACTORS
- 9. CONCLUDING COMMENTS
- References
Abstract
This paper updates rankings of academic institutions by Hall (1990, Econometric Theory 6, 1–16) and Baltagi (1998, Econometric Theory 14, 1–43) by publication activity in econometrics over the period 1989–1999. This is based on 15 leading international journals that publish econometrics articles. In addition, a list of the top 150 individual producers of econometrics in these 15 journals over this period is provided. This is done for theoretical econometrics and also for all contributions in econometrics. Sensitivity analysis is provided using (i) alternative conversion factors given to the 15 journals based on citation impact factors, (ii) alternative ranking using the number of articles published in these journals, (iii) separate rankings for both institutions and individuals by journal, (iv) rankings for institutions and individuals based on publications in three core journals.I thank Peter C.B. Phillips for entrusting me with this study, three referees and the editor for their comments and suggestions, and P.M. Kisor for research assistance.
Information
- Type
- Research Article
- Information
- Copyright
- © 2003 Cambridge University Press
1. INTRODUCTION
This paper updates the 1980–1988 worldwide econometrics rankings of academic institutions provided by Hall (1990) to the period 1989–1999. In addition, this paper updates the 1989–1995 worldwide rankings of the top individual producers in econometrics provided by Baltagi (1998) to the period 1989–1999. Studies ranking institutions in the field of economics include Hirsch, Austin, Brooks, and Moore (1984); Conroy, Dusansky, Drukker, and Kildegaard (1995); Scott and Mitias (1996); and Dusansky and Vernon (1998). For the field of statistics, see Phillips, Choi, and Schochet (1988) and Genest (1997).
The journals used for this ranking include American Economic Review (AER), Econometrica, Economic Journal (EJ), Econometric Theory (ET), International Economic Review (IER), Journal of the American Statistical Association (JASA), Journal of Business and Economic Statistics (JBES), Journal of Monetary Economics (JME), Journal of Political Economy (JPE), Journal of Econometrics (JoE), Journals of the Royal Statistical Society (JRSS), Review of Economics and Statistics (ReStat), Review of Economic Studies (ReStud), Journal of Applied Econometrics (JAE), and Econometric Reviews (ER). These are the same journals used by Hall (1987, 1990) except for the addition of the JAE.
Given the concerns expressed over the journals used for these rankings, a survey was undertaken in 1998. The top 50 ranked econometricians from the Baltagi (1998) ranking were asked to participate. This is by no means a random statistical survey but was conducted to get a feel for the most appropriate journals to include when ranking econometrics. The response rate was 64%. Five respondents thought that EJ should be excluded, four respondents suggested excluding JRSS, and three suggested excluding JME and JPE. Only one suggested excluding AER. Ten respondents thought that one or more statistical journals, such as the Annals of Statistics, Biometrika, and the Journal of Time Series Analysis, should be included in econometric rankings.1
A recent study by Cribari-Neto, Jensen, and Novo (1999) focused on 11 economics and statistics journals including Annals of Statistics, Biometrika, JASA, Econometrica, ET, IER, JAE, JBES, JoE, ReStat, and ReStud over the period 1986–1996 and used impact citation weights. Nine of these journals are common with the 15 journals used in this study.
Readers can send me their vote, via e-mail, on what journals they think should be included or excluded from these rankings in future updates.
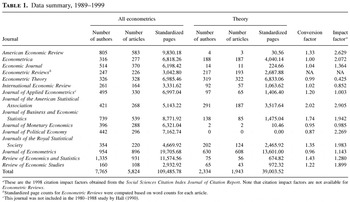
Data for the 1989–1999 study were downloaded from the EconLit database. Historical remarks, software and book reviews, interviews, problems and solutions, comments, and erratum were excluded from the database. A substantial amount of work went into cleaning these data. Some of the problems encountered were due to the lack of standardization of affiliation and authors' names, missing information, typos, etc. Most of these problems were resolved using the worldwide web. Articles with no substantial econometrics content were dropped from the database. The remaining articles were classified as applied or theoretical econometrics. In case of n joint authors, each author received (1/n) of the publication credit. In case an author has m affiliations, each affiliation received (1/m) of the publication credit given to that author. The same conversion factors used by Hall (1990) were used in this study for comparison purposes. These are based upon the average number of characters published on one page of the respective journal with the numeraire set equal to 1 for an Econometrica page. These conversion factors are given in Table 1 and are used to standardize the page counts across the 15 journals. Because of the heterogeneity of the articles published in Econometric Reviews, each article had to be scanned and assigned a conversion factor. In Section 5, the sensitivity of the rankings to alternative conversion factors based on impact citations of these journals is studied. The 1998 impact citation factors are shown in the last column of Table 1. These were obtained from the Social Sciences Citation Index Journal of Citation Report. Briefly, the impact factor for Econometrica in 1998 is the ratio of the number of citations to articles published in Econometrica over the past two years (1996 and 1997) divided by the number of articles published in that journal during these two years.
Data summary, 1989–1999

Table 1 shows that over this 11-year period there were a total of 5,824 articles in econometrics attributed to 7,765 authors and 1,110 affiliations with a total of 109,486 standardized pages. For theoretical econometrics, there were 1,943 articles attributed to 2,334 authors and 554 affiliations with a total of 39,004 standardized pages. Using Table 1, one can answer the following questions.
1. Which journals publish the most standardized pages in the field of econometrics?
Over the period 1989–1999, a total of 39,004 standardized pages were published in the field of econometric theory in these 15 journals. Thirty-five percent of these standardized pages were published by JoE, followed by ET (18%), Econometrica (10%), and JASA (9%). Similarly, a total of 109,486 standardized pages were published in the field of econometrics over the period 1989–1999 in these 15 journals. Eighteen percent of these appeared in JoE, followed by ReStat (11%), AER (9%), and JBES (8%).
2. Which journals published the largest number of articles (or ideas) in the field of econometrics?
Over the period 1989–1999, a total of 1,943 articles were published in econometric theory in these 15 journals. Thirty-one percent of these articles were published in JoE, followed by ET (17%), ER (10%), Econometrica (10%), and JASA (10%). Similarly, a total of 5,824 articles were published in the field of econometrics over the period 1989–1999 in these 15 journals. Sixteen percent of these articles appeared in ReStat, followed by 15% in JoE, 10% in AER, and 9% in JBES. These data are consistent with the earlier study of Baltagi (1998) and confirm that these journals are major outlets for econometric theory publications.
3. Out of all econometric articles published in these 15 journals, which journals have the highest concentration in econometric theory?
Out of 328 econometric articles published by ET over this period, 322 were classified as econometric theory. In fact, ET had the highest concentration of econometric theory articles (98%), followed by ER (85%), JASA (70%), Econometrica (68%), and JoE (68%). Things did not change when we used standardized pages. In fact, 98% of the standardized pages of econometrics published by ET were devoted to econometric theory. This is followed by ER (88%), JoE (69%), JASA (68%), and Econometrica (59%).
2. RANKINGS USING THEORETICAL ECONOMETRICS CONTRIBUTIONS
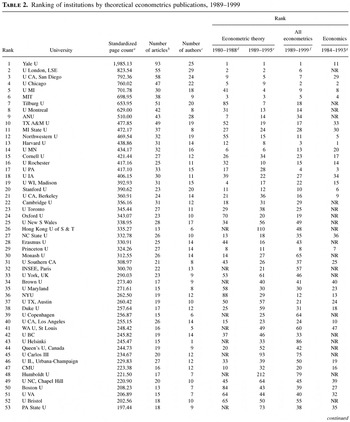
Table 2 ranks the top 150 academic institutions for theoretical contributions in econometrics. This is based on the total standardized page count published by individuals associated with these academic institutions for the period 1989–1999. This is compared with Hall's rankings (1990) for the period 1980–1988 and Baltagi's rankings (1998) for the period 1989–1995 for theoretical econometrics. Note that Hall (1990) ranked only 100 academic institutions, whereas Baltagi (1998) ranked 200 academic institutions. Next, the rankings from Table 3 for all econometrics publications for the period 1989–1999 are included for comparison. Also included are the rankings for the field of economics over the period 1984–1993 published by Scott and Mitias (1996). These economics rankings are for U.S. academic institutions only and are based on publications in 36 leading economic journals, 10 of which are common with the 15 journals listed in Table 1.
Ranking of institutions by theoretical econometrics publications, 1989–1999

Table 2 continued

Table 2 continued

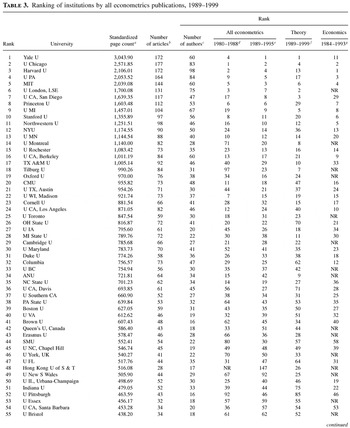
Ranking of institutions by all econometrics publications, 1989–1999

Table 3 continued

Table 3 continued

Yale University is the top ranked institution in theoretical econometrics over the period 1989–1999. It has dominated the number one spot since 1980, as is clear from the earlier rankings over the periods 1980–1988 and 1989–1995. The London School of Economics has held the number two spot since 1980. However, the number of standardized pages for Yale was more than twice that of LSE. The University of California–San Diego is ranked 3rd with a steady improvement in their rankings over time from 9th in 1980–1988 to 5th in 1989–1995 to 3rd in 1989–1999. The University of Michigan has been a big mover from the decade of the 1980s to the 1990s, moving from 41 in 1980–1988 to 5 in 1989–1999. Other big movers in theoretical econometrics publications rankings are Tilburg University, which climbed from 85 in 1980–1988 to 7 in 1989–1999, and the University of Montreal, which climbed from 31 in 1980–1988 to 8 in 1989–1999. Texas A&M University, which was 52 in 1980–1988, climbed to 10 in 1989–1999. Michigan State University, which was 27 in 1980–1988, now ranks 11th. Northwestern University, which was 55 in 1980–1988, is now 12 in 1989–1999. Similarly, Cornell improves from 26 to 15, Rochester from 32 to 16, Iowa from 39 to 18, Oxford from 70 to 24. Hong Kong University of Science and Technology moved from “not ranked” in 1980–1988 to 110 over the period 1989–1995 to 26 over the period 1989–1999. This demonstrates the influence of highly productive theoretical econometricians as they move across universities. Over this 11-year period 1989–1999, it took about 57 Econometrica equivalent pages in econometric theory to rank among the top 150 academic institutions. It takes an additional 40 pages to rank in the top 100 and 110 extra pages to move from rank 100 to rank 50. The climb is steeper at the top, as it takes more than 1,284 pages to move from rank 5 to rank 1.
Although Baltagi (1998) and Hall (1990) provided productivity ranking for academic institutions in econometrics, we will not do so in this paper. This productivity ranking was based on the number of standardized pages per contributing author. This measure has its limitations. As two reviewers correctly point out, the denominator should be the number of econometricians in a given institution, not the number of contributing authors.
Note that Yale, which ranked 1st in econometric theory over 1989–1999, is only ranked 11 in economics over the period 1984–1993, whereas Harvard, which ranked 1st in economics over 1984–1993, ranked 13 in econometric theory over the period 1989–1999. This difference in rankings is more dramatic for UC-San Diego, which ranked 29th in economics over the period 1984–1993, although ranking 3rd in econometric theory over the period 1989–1999. Also, Michigan State ranked 30 in economics and ranked 11 in econometric theory.
3. RANKINGS USING ALL CONTRIBUTIONS IN ECONOMETRICS
Table 3 ranks the top 150 academic institutions by all econometrics publications. This table has the same format as Table 2. The ranking is based on the total standardized page count of all econometrics articles published by individuals associated with these academic institutions for the period 1989–1999. This is compared with Hall's ranking (1990) for the period 1980–1988 and Baltagi's ranking (1998) of all econometrics for the period 1989–1995. Next, the rankings from Table 2 for econometric theory publications for the period 1989–1999 and the rankings for economics for U.S. academic institutions for the period 1984–1993 are included for comparison.
Yale is the top ranked academic institution based on all econometrics publications over the period 1989–1999, moving up from the 4th rank over the period 1980–1988. Chicago is ranked 2nd compared to its number one rank over the period 1980–1988. Major movers in the top 25 include UC-San Diego, which moved up from 17 in 1980–1988 to 7 in 1989–1999; University of Michigan, from 19 to 9; Northwestern, from 16 to 11; NYU, from 24 to 12; Montreal, from 71 to 14; Texas A&M, from 40 to 17; Tilburg, from 97 to 18; Oxford, from 34 to 19; and the University of Texas at Austin, from 44 to 21.
Over the period 1989–1999, it took a total of 133 Econometrica equivalent pages to rank an academic institution in the top 150. It takes an additional 83 pages to move into the top 100. The climb is steeper closer to the top 50, requiring more than 282 additional pages to move from 100 to 50. From rank 5 to rank 1, an additional 1,004 pages are required.
Once again the top ranked universities in economics over the period 1984–1993 are not necessarily the top ranked universities in all econometrics over the period 1989–1999. Yale is ranked 11th in economics but is ranked 1st in all econometrics. Chicago is ranked 2nd in both economics and all econometrics. UC–San Diego is 29th in economics but 7th in all econometrics.
4. THE ECONOMETRICIANS' HALL OF FAME
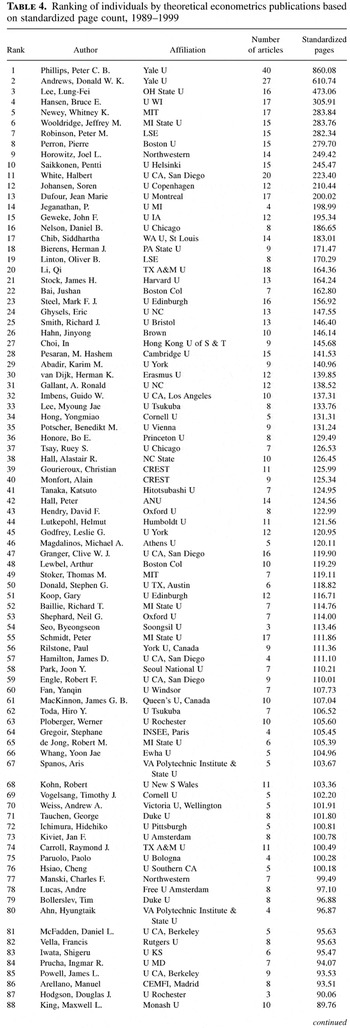
Table 4 shows the list of the top 150 individual publishers in theoretical econometrics in the 15 journals considered from 1989 to 1999. These were ranked using the number of standardized pages published in econometric theory in the 15 journals over this 11-year period. The institutional affiliation is the one listed on the author's most current article and in most cases updated to reflect the most current known affiliation. Unlike the case for Tables 2 and 3, where only academic institutions are ranked, the individual rankings are based upon all publications regardless of affiliation type, whether academic or nonacademic. In case of n joint authors, each author is assigned (1/n) of the publication credit. It took more than 60 Econometrica equivalent pages in econometric theory to belong to the top 150 lists. The top 50 individuals published more than 118 Econometrica equivalent pages, whereas the top 10 individuals published more than 245 Econometrica equivalent pages over this 11-year period.
Ranking of individuals by theoretical econometrics publications based on standardized page count, 1989–1999

Table 4 continued

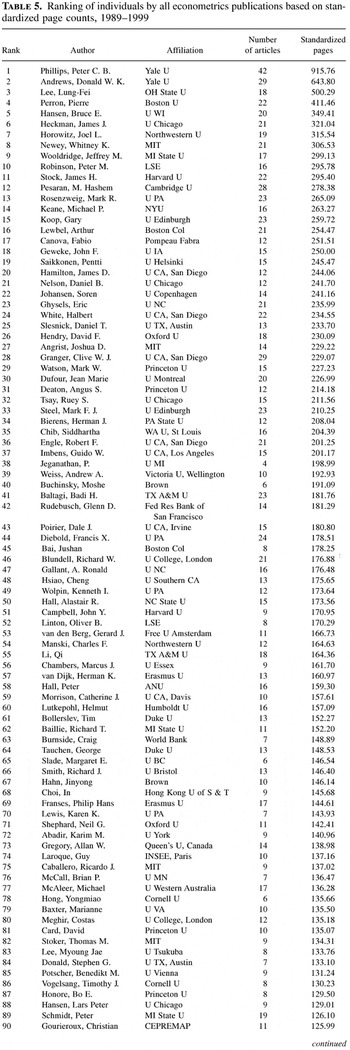
Similarly, Table 5 gives the list of the top 150 individual publishers in all econometrics from 1989 to 1999. These are based on the number of standardized pages published in all econometrics in the 15 journals over this 11-year period. It took more than 100 Econometrica equivalent pages to belong to this top 150 list. The top 50 individuals published more than 173 Econometrica equivalent pages, whereas the top 10 individuals published more than 295 pages over this 11-year period—this is more than 25 pages a year.
Ranking of individuals by all econometrics publications based on standardized page counts, 1989–1999

Table 5 continued

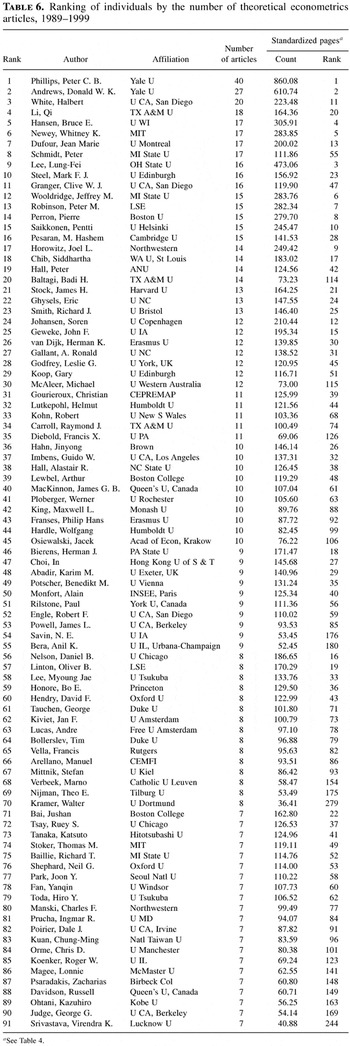
Table 6 shows an alternative ranking of individuals based on the number of articles published in theoretical econometrics in the 15 journals considered over the period 1989–1999. This alternative ranking counts an article as an idea and does not penalize the author for co-authorship as the page count does. However, this table suffers from a quality differential problem in that it weights an article equally among journals and does not reward it for its length. This table gives a list of 91 individuals who published 7 or more econometric theory articles in these 15 journals over this 11-year period. Except for the top ranked two individuals, this ranking differs from that in Table 4, showing the penalty effect of the (1/n) division and the use of standardized page count. For example, Halbert White, who published 20 articles in econometric theory over this period, ranks 3rd by article count as compared to 11 by standardized pages. Qi Li, who published 18 articles in econometric theory over this period, ranks 4th by article count as compared to 20 by standardized pages. Other notable differences in rankings include Peter Schmidt, who is 8th in Table 6 and 55th in Table 4, and also Clive Granger, who is 11th in Table 6 and 47th in Table 4.
Ranking of individuals by the number of theoretical econometrics articles, 1989–1999

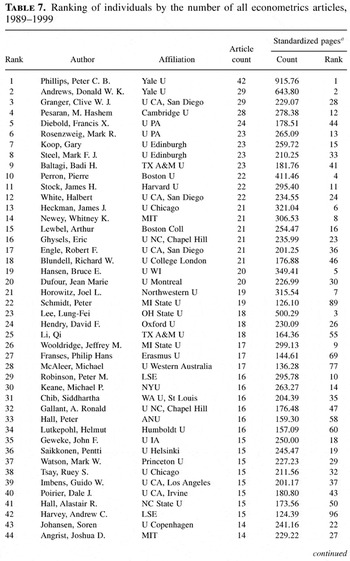
Similarly, Table 7 ranks individuals based on the number of articles published in all econometrics in the 15 journals considered over the period 1989–1999. This table gives a list of 105 individuals who published 10 or more econometrics articles in these 15 journals over this 11-year period. Once again the rankings beyond the first two individuals differ from those in Table 5. For example, Clive Granger, who has 29 articles over this period, is 3rd in this ranking but 28th in Table 5 according to the standardized page count. Frank Diebold, with 24 articles over this period, is 5th in this ranking but ranks 44th by the standardized page count. Other examples of a large differential in rankings include Peter Schmidt, who published 19 articles over this period and ranked 22 by the article count as compared to 89 by the standardized page count. Michael McAleer, who published 17 articles over this period, ranked 28th by article counts and 77th by the standardized page count.
Ranking of individuals by the number of all econometrics articles, 1989–1999

Table 7 continued

5. IMPACT FACTOR: QUALITY ADJUSTED RANKINGS
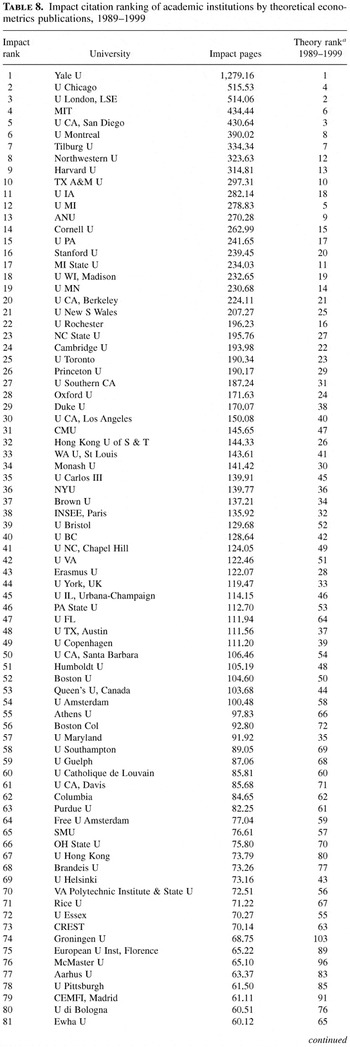
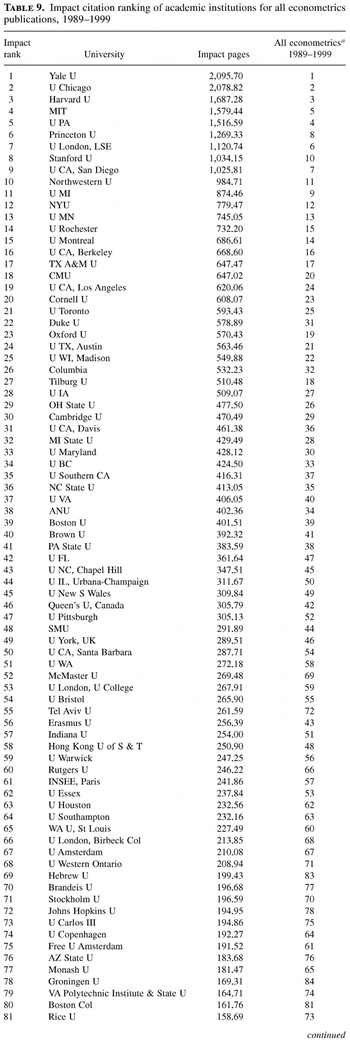
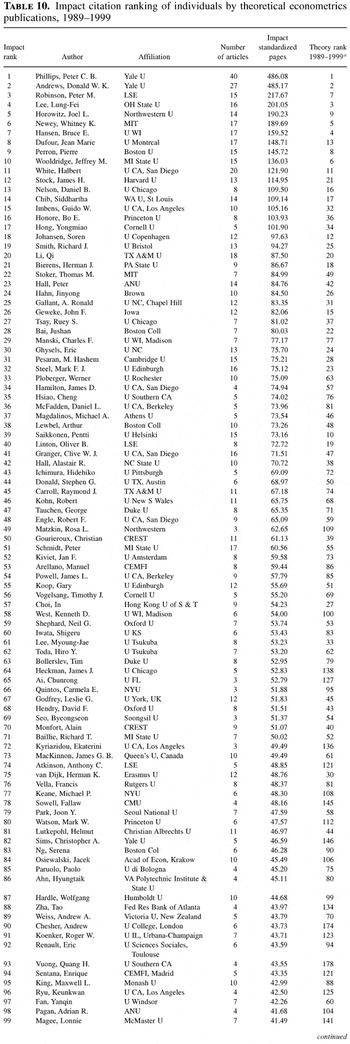
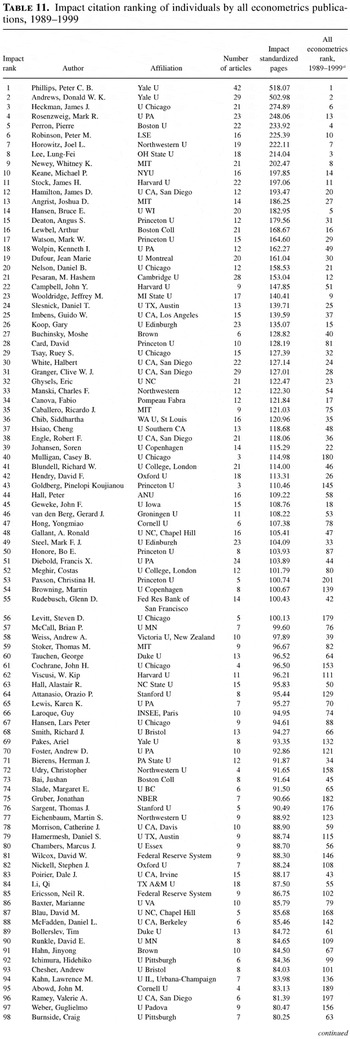
To check the sensitivity of these rankings to quality differences across journals, we used the impact factors based on the number of citations to articles published in these 15 journals. The last column of Table 1 gives the 1998 impact factors obtained from the journal citation reports. Multiplying these impact factors by the standardized page conversion used by Hall (1990) we obtain quality adjusted conversion rates. As is clear from these impact factors Econometrica and JPE are major gainers because they are well cited, whereas all the other journals are discounted due to the lesser numbers of citations attributed to these journals. Tables 8 and 9 show how the academic institutions rankings for theoretical and all econometrics in Tables 2 and 3 are affected using these quality adjusted conversion rates. Tables 10 and 11 show how the individual rankings for theoretical and all econometrics in Tables 4 and 5 are affected using these quality adjusted rankings.
Impact citation ranking of academic institutions by theoretical econometrics publications, 1989–1999

Table 8 continued

Impact citation ranking of academic institutions for all econometrics publications, 1989–1999

Table 9 continued

Impact citation ranking of individuals by theoretical econometrics publications, 1989–1999

Table 10 continued

Impact citation ranking of individuals by all econometrics publications, 1989–1999

Table 11 continued

Comparing the theoretical econometrics rankings in Table 2 based on standardized pages with those in Table 8 based on impact citations, we see that the academic institutions rankings are slightly reshuffled. Yale is still ranked one by both measures, but the University of Chicago climbs to 2nd as compared to 4th in Table 2. LSE drops to 3rd rather than 2nd, and UC-San Diego drops to 5 rather than 3. The rankings become more sensitive beyond the top 50. For example, the University of Groningen climbs from 103 in Table 2 to 74 in Table 8. The University of Auckland climbs from 120 to 84.
Comparing the all econometrics rankings in Table 3 based on standardized pages with those in Table 9 based on impact citations, only a slight change in the rankings between the two tables for the top 50 academic institutions is found. The top three ranked universities are unchanged, but MIT switches places with the University of Pennsylvania for the 4th and 5th rank. There are only a few universities in the top 150 that are drastically affected: University of California–Irvine climbs from 101 to 87 and Dartmouth College from 138 to 92.
Comparing Table 4 with Table 10, we see that Peter Phillips and Don Andrews retain the top two positions in theoretical econometrics. Among the top 10, Peter Robinson moves up from 7th to 3rd, whereas Lung-Fei Lee drops from 3rd to 4th. Joel Horowitz moves up from 9th to 5th, whereas Whitney Newey moves from 5th to 6th place. Overall, the individual rankings are sensitive to this impact factor adjustment. Those individuals publishing more in Econometrica move up, whereas those publishing more in other journals move down. Among the gainers are the following authors: James Stock, moving up from 21 to 12; Guido Imbens, from 32 to 15; Bo Honore, from 36 to 16; Tom Stoker, from 49 to 22; Chuck Manski, from 77 to 29; Werner Ploberger, from 63 to 33; Jim Hamilton, from 57 to 34; and Cheng Hsiao, from 76 to 35, to mention a few.
Comparing Table 5 with Table 11 for all econometrics, we see that the ranking of the top two econometricians, Peter C.B. Phillips and Don Andrews, is not affected by adjusting for the impact citations of the journals. Among the top 10 econometricians, Lung-Fei Lee drops from 3rd to 8th, whereas Jim Heckman moves up from 6th to 3rd. Mark Rosenzweig moves up from 13th to 4th, and Pierre Perron drops from 4th to 5th place. Michael Keane moves up from 14 to 10, whereas Bruce Hansen drops from 5th to 14th. Peter Robinson moves up from 10th to 6th, and Jeff Wooldridge drops from 9th to 23rd and Hashem Pesaran from 12 to 21. Fabio Canova moves down from 17 to 34, and Jean-Marie Dufour moves up from 30 to 19. This impact factor effect is even more dramatic as we go down the list.
Although these impact factors take citations into account this is based only on articles published in the past two years. Hence the articles with more lasting impact, which may have an increasing rate of citations, are not well accounted for by this impact factor. Note that the 1998 impact factor for the Journal of Economic Literature (JEL) is 6.405 and that for Journal of Health Economics (JHE) is 2.133. This is compared to Econometrica's 2.072. This shows that these journals are well cited and in 1998 more so than Econometrica, but this does not necessarily mean that we should give more than three times the weight for JEL as compared to Econometrica and a higher weight for JHE than Econometrica. In fact, these impact factors discount ET by 79%; IER and JAE by 60%, and JoE, ReStat, and JME by approximately 50%. Given the high quality of these journals, it is hard to accept discounts of these magnitudes.
6. RANKINGS OF INDIVIDUALS AND ACADEMIC INSTITUTIONS BY JOURNAL
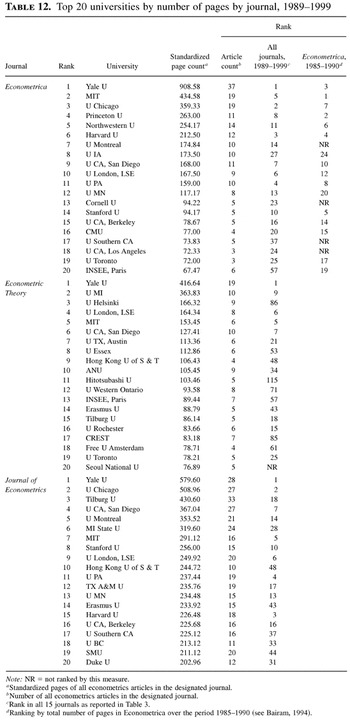
Next we focus on specific journals, namely, Econometrica, JoE, and ET. This controls for quality differences between journals but not among articles within the same journal. Table 12 lists the top 20 academic institutions by standardized pages in all econometrics by journal, over the period 1989–1999. This ranking is compared with the corresponding ranking in Table 3 for all 15 journals. Note that 14 out of the top 20 universities publishing in Econometrica are in the top 20 list ranked by standardized pages in all 15 journals. This is compared with 13 out of 20 for JoE and 7 out of 20 for ET. The last column of Table 12 shows the rankings of academic institutions by all publications in Econometrica over the period 1985–1990. This is obtained from Bairam (1994). Note that almost the same list of top 20 institutions appears in Table 12 when looking at all econometrics publications. The only new entries into the top 20 in 1989–1999 are the University of Montreal, Cornell University, University of Southern California, and UCLA.
Top 20 universities by number of pages by journal, 1989–1999

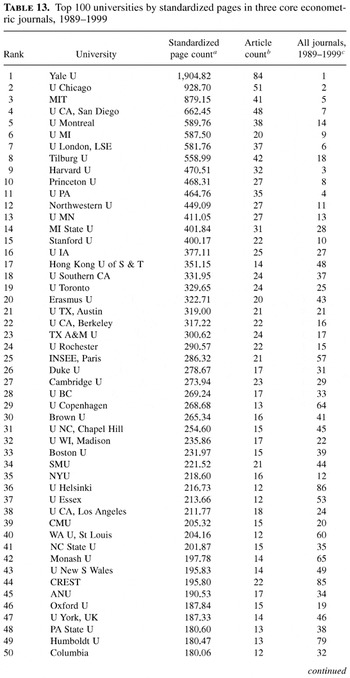
Table 13 gives the top 100 universities by standardized pages in the three core journals—Econometrica, ET, and JoE—over the period 1989–1999. This was suggested by one of the referees. Eighty-two of the top 100 universities by standardized pages in the three core econometric journals are also in the top 100 list by standardized pages in all 15 journals. The University of Montreal climbs to 5 from 14, Tilburg is now 8 rather than 18, and Michigan State is 14 rather than 28. Harvard, on the other hand, drops from 3 to 9 and the University of Pennsylvania from 4 to 11.
Top 100 universities by standardized pages in three core econometric journals, 1989–1999

Table 13 continued

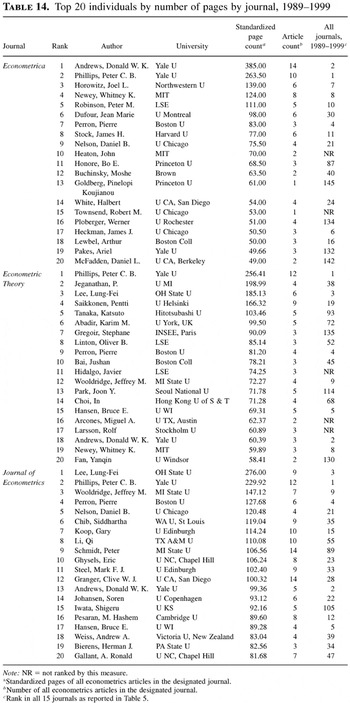
Table 14 shows the top 20 individuals by standardized pages in all econometrics by journal. Top 20 producers tend to be listed also in the top 150 by all 15 journals (see Table 5). There are, however, some exceptions. For example, all of the top 20 producers in JoE made the 150 list. However, two of the top 20 in Econometrica and three of the top 20 producers in ET did not make the top 150 list. Peter C.B. Phillips ranks 1st in ET, 2nd in Econometrica, and 2nd in JoE over the period 1989–1999. Donald Andrews ranks 1st in Econometrica, 18th in ET, and 13th in JoE. Lung-Fei Lee ranks 1st in JoE and 3rd in ET and is not ranked in the top 20 in Econometrica.
Top 20 individuals by number of pages by journal, 1989–1999

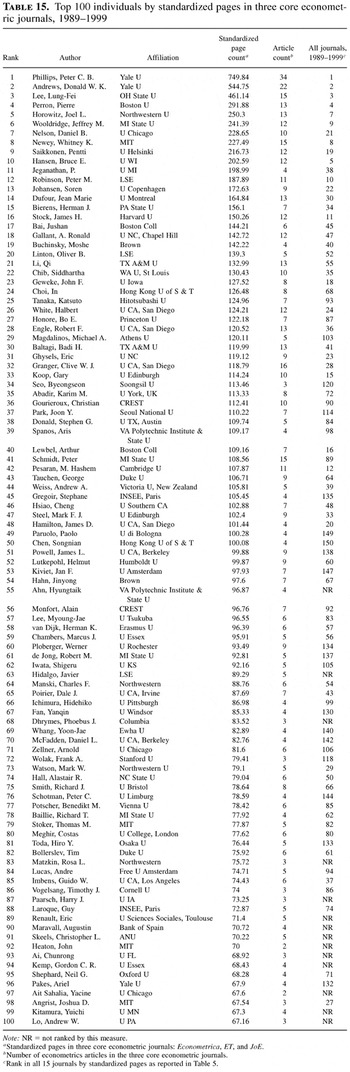
Table 15 gives the top 100 individuals by standardized pages in the three core econometric journals—Econometrica, ET, and JoE—over the period 1989–1999. Note that the top four people, by standardized pages, in the three core econometric journals are the same as in all 15 journals reported in Table 5. Sixty-seven of the top 100 individuals in Table 15 are also in the top 100 list by standardized pages in all 15 journals.
Top 100 individuals by standardized pages in three core econometric journals, 1989–1999

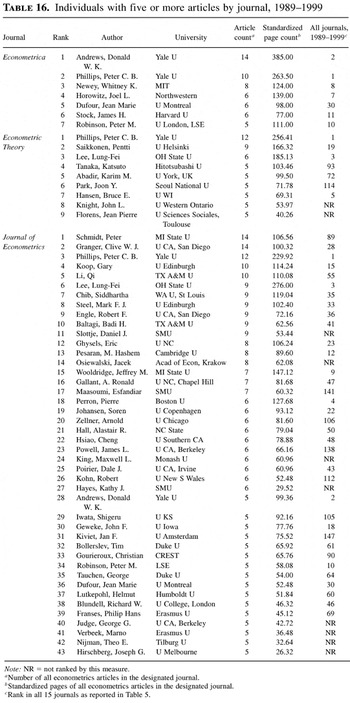
Table 16 lists individuals with five or more articles, by journal, over the period 1989–1999. There were seven individuals publishing five or more econometrics articles in Econometrica during this period. These seven individuals were among the top 30 ranked individuals over the period 1989–1999 (see Table 5). There were 43 individuals publishing five or more articles in JoE. Only eight of these were not ranked among the top 150 individuals in Table 5. Among the nine individuals with five or more articles in ET, only two were not in the top 150 in Table 5.
Individuals with five or more articles by journal, 1989–1999

7. CONCENTRATION RATIOS
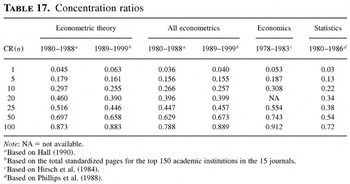
Table 17 gives the concentration ratios for theoretical and all econometrics for the period 1989–1999. These are based on the percentage of standardized pages of the top 1, 5, 10, etc., using all econometrics publications of the top 150 academic institutions in the 15 journals. These are compared to the concentration ratios reported by Hall (1990) for the period 1980–1988. Note that the latter are based on 14 journals. Comparing 1980–1988 to 1989–1999, the share of the top ranked university rises from 4.5% to 6.3% in econometric theory and from 3.6% to 4% in all econometrics. Therefore, econometric theory publications have increased in concentration at the top over the two periods. However, for the top 10, the concentration ratios seem to be decreasing over time, going from 29.7% to 25.5% for econometric theory and from 26.6% to 25.7% for all econometrics. The last two columns show how these concentration ratios compare to the field of economics over the period 1978–1983 and the field of statistics over the period 1980–1986.
Concentration ratios

8. GEOGRAPHICAL FACTORS
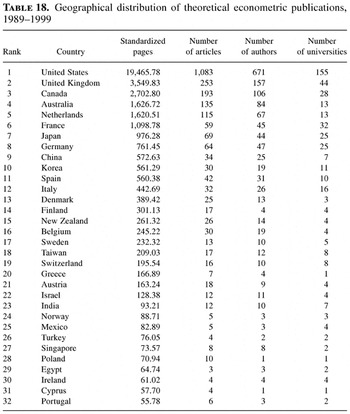
Table 18 shows the distribution of standardized pages, number of articles, authors, and academic institutions in theoretical econometrics by country. Only countries publishing 50 or more Econometrica equivalent standardized pages in theoretical econometrics were included in this comparison. The United States dominates the rankings, with 19,466 standardized pages corresponding to 1,083 articles published by 671 authors at 155 academic institutions over the period 1989–1999. The United Kingdom is 2nd, with 3,550 standardized pages attributed to 253 articles published by 157 authors at 44 academic institutions. Canada is 3rd, Australia is 4th, and the Netherlands is 5th.
Geographical distribution of theoretical econometric publications, 1989–1999

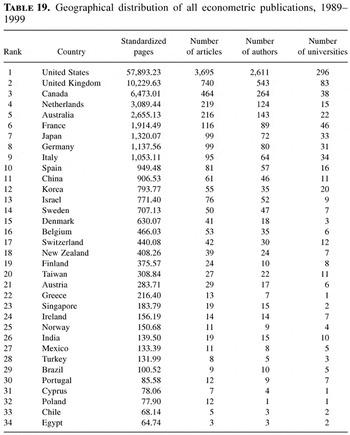
Table 19 is a similar table for all econometrics publications by country over the period 1989–1999. Only countries publishing more than 50 Econometrica equivalent standardized pages in all econometrics were included in this table. The United States ranks 1st in all econometrics, with 57,893 standardized pages attributed to 3,695 articles published by 2,611 authors at 296 academic institutions over the period 1989–1999. The United Kingdom ranks 2nd, with 10,230 standardized pages corresponding to 740 articles published by 543 authors at 83 academic institutions. Canada is 3rd, the Netherlands is 4th, Australia is 5th, and France is 6th.
Geographical distribution of all econometric publications, 1989–1999

9. CONCLUDING COMMENTS
This paper ranks academic institutions and individuals in econometric theory and all econometrics over a span of 11 years, covering the period 1989–1999. These ranking are based upon standardized page counts in 15 journals and also on citation impact factors. The fact that 14 out of the 15 journals were used by Hall (1990) allows a comparison in rankings among academic institutions from the period 1980–1988 to the period 1989–1999. This covers a span of 20 years of econometrics research. The usual caveats apply. One could question the 15 journals used, or the conversion factors applied even after adjusting them by citation impact factors. There is a subjective element in classifying econometric theory articles. There are econometricians who publish in statistics journals that were not included in this study, and there are statisticians that were included in this ranking because their research was published in econometric journals or had econometricians as co-authors. The institutions rankings excluded nonacademic institutions such as Federal Reserve Banks, NBER, World Bank, and IMF. However, the individual rankings include researchers affiliated with both academic and nonacademic institutions. Econometricians move from one university to another, and the rankings of these institutions are affected accordingly. Despite these shortcomings, we believe these rankings to be a helpful guide to graduate students, faculty, and academic administrators.
References
REFERENCES
Bairam, E.I.
(1994)
Institutional affiliation of contributors to top economic journals:
1985–1990.
Journal of Economic Literature
32,
674–679.Google Scholar
Baltagi, B.H.
(1998)
Worldwide institutional rankings in econometrics: 1989–1995.
Econometric Theory
14,
1–43.CrossRefGoogle Scholar
Conroy, M.E.,
R. Dusansky,
D. Drukker, &
A. Kildegaard
(1995)
The productivity of economics departments in the U.S.: Publications
in core journals.
Journal of Economic Literature
33,
1966–1971.Google Scholar
Cribari-Neto, F.,
M.J. Jensen, &
A.A. Novo
(1999)
Research in econometric theory: Quantitative and qualitative
productivity rankings.
Econometric Theory
15,
719–752.CrossRefGoogle Scholar
Dusansky, R. &
C.J. Vernon
(1998)
Rankings of U.S. economics departments.
Journal of Economic Perspectives
12,
157–170.CrossRefGoogle Scholar
Genest, C.
(1997)
Statistics on statistics: Measuring research productivity by
journal publications between 1985 and 1995.
Canadian Journal of Statistics
25,
427–447.CrossRefGoogle Scholar
Hall, A.D.
(1987)
Worldwide rankings of research activity in econometrics:
1980–1985.
Econometric Theory
3,
171–194.CrossRefGoogle Scholar
Hall, A.D.
(1990)
Worldwide rankings of research activity in econometrics: An update:
1980–1988.
Econometric Theory
6,
1–16.CrossRefGoogle Scholar
Hirsch, B.T.,
R. Austin,
J. Brooks, &
J.B. Moore
(1984)
Economics department rankings: Comment.
American Economic Review
74,
822–826.Google Scholar
Phillips, P.C.B.,
I. Choi, &
P.Z. Schochet
(1988)
Worldwide institutional and individual rankings in statistical
theory by journal publications over the period 1980–1986.
Econometric Theory
4,
1–34.Google Scholar
Scott, L.C. &
P.M. Mitias
(1996)
Trends in rankings of economics departments in the U.S.: An update.
Economic Inquiry
34,
378–400.Google Scholar
Data summary, 1989–1999
Ranking of institutions by theoretical econometrics publications, 1989–1999
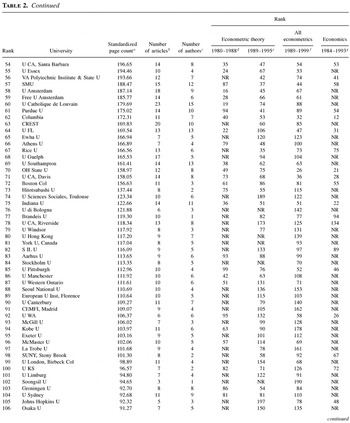
Table 2 continued
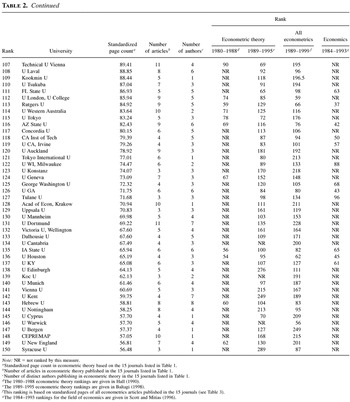
Table 2 continued
Ranking of institutions by all econometrics publications, 1989–1999
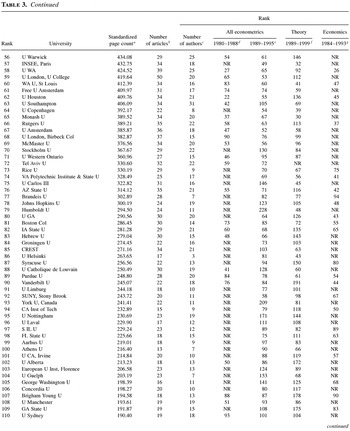
Table 3 continued
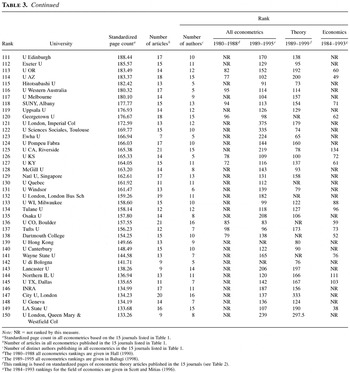
Table 3 continued
Ranking of individuals by theoretical econometrics publications based on standardized page count, 1989–1999
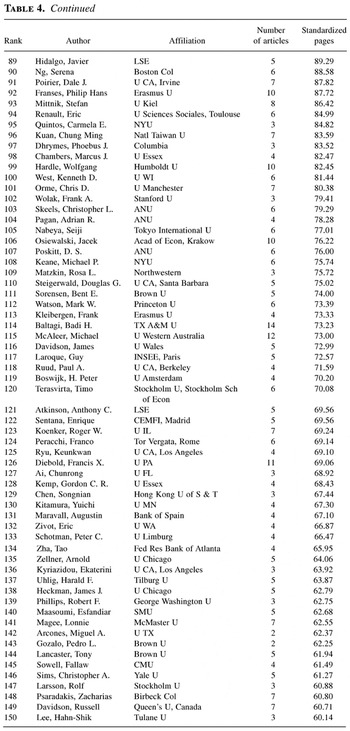
Table 4 continued
Ranking of individuals by all econometrics publications based on standardized page counts, 1989–1999
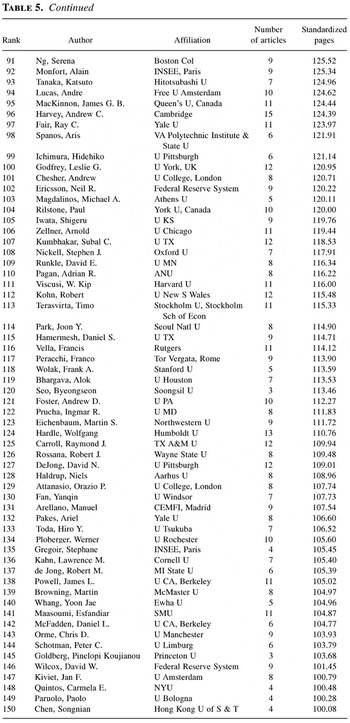
Table 5 continued
Ranking of individuals by the number of theoretical econometrics articles, 1989–1999
Ranking of individuals by the number of all econometrics articles, 1989–1999
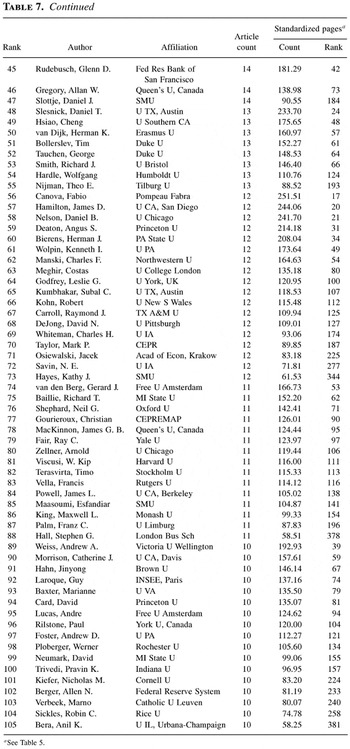
Table 7 continued
Impact citation ranking of academic institutions by theoretical econometrics publications, 1989–1999
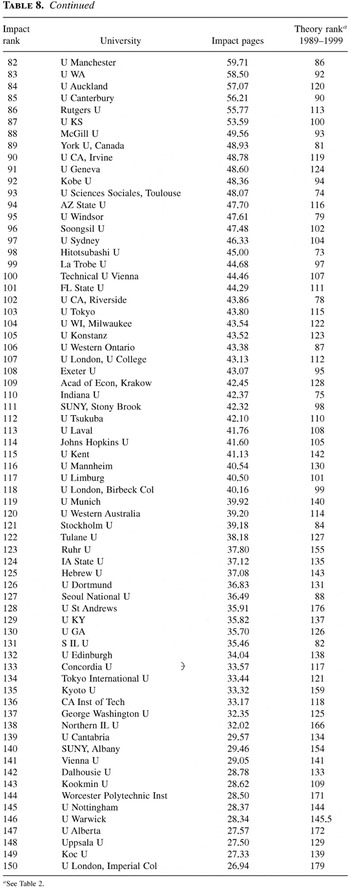
Table 8 continued
Impact citation ranking of academic institutions for all econometrics publications, 1989–1999
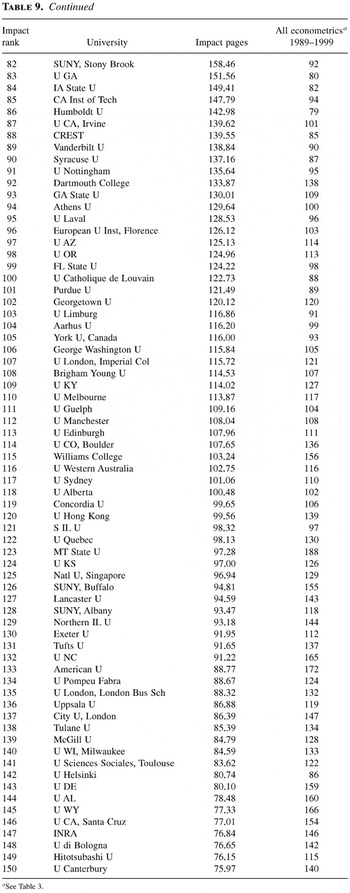
Table 9 continued
Impact citation ranking of individuals by theoretical econometrics publications, 1989–1999
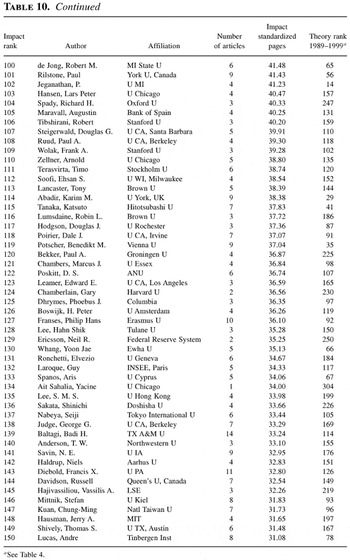
Table 10 continued
Impact citation ranking of individuals by all econometrics publications, 1989–1999
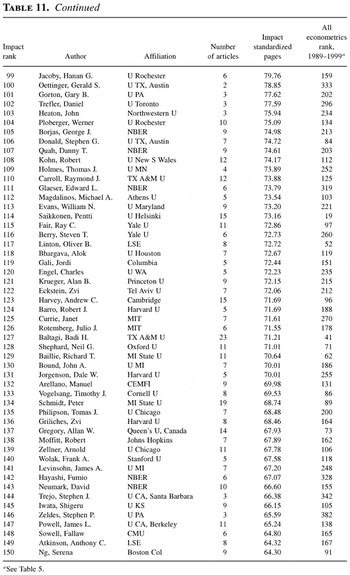
Table 11 continued
Top 20 universities by number of pages by journal, 1989–1999
Top 100 universities by standardized pages in three core econometric journals, 1989–1999
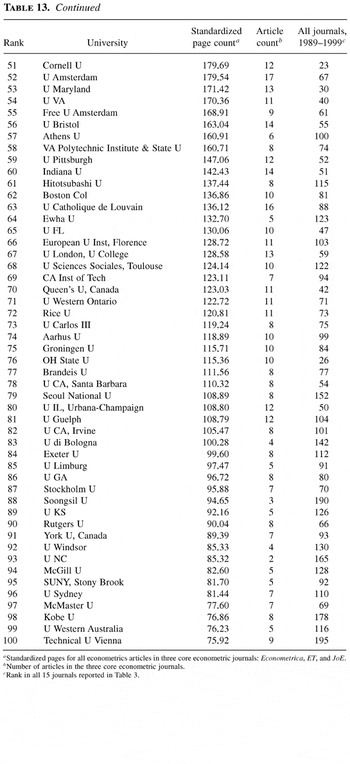
Table 13 continued
Top 20 individuals by number of pages by journal, 1989–1999
Top 100 individuals by standardized pages in three core econometric journals, 1989–1999
Individuals with five or more articles by journal, 1989–1999
Concentration ratios
Geographical distribution of theoretical econometric publications, 1989–1999
Geographical distribution of all econometric publications, 1989–1999
 You have
Access
- 14
- Cited by