Introduction
Graphene is remarkably easy to grow on metals, and for many years, it was considered to form too easily. For example, the early years of metal surface science were plagued by adventitious carbon. Much of this carbon was actually graphene, that is, a single sheet of graphite. Indeed, one of the first observations of graphene over 45 years ago was mistaken for the structure of the clean Pt(100) surface.Reference Hagstrom, Lyon and Somorjai1 (Instrumentation advances quickly corrected this confusion.Reference Morgan and Somorjai2) Procedures to remove this carbon had to be developed before the structure and reactivity of clean metal surfaces could be studied.Reference Grant and Haas3 Thus, it is not surprising that metals such as copper are proving to be popular, low-cost substrates for graphene growth.Reference Novoselov4
Whereas the procedures to grow graphene on metals can be simple, the atomic-scale growth mechanisms are not. Indeed, key features of the growth are not part of the standard lore of heteroepitaxy. In particular, the attachment of carbon atoms to the graphene edge and the nucleation and growth of graphene multilayers involve processes that are strikingly different from those involved in standard heteroepitaxy. For example, a substantial supersaturation of the growth species is required to grow graphene on some transition metals, a reflection of a large activation barrier for carbon attachment. In contrast, there is no barrier to attachment in most heteroeptaxial systems, for example, when one metal is grown on another. Improving graphene quality by increasing its grain size and, in the case of multilayers, controlling thickness uniformity requires an understanding of these processes. Herein, we briefly review the basic concepts of graphene growth on metals; highlight some recent advances in understanding the microscopic growth processes; and discuss growth on copper, which is currently the most promising substrate. Further details can be obtained in earlyReference Hamilton and Blakely5–Reference Gall, Rut’Kov and Tontegode7 and recentReference Wintterlin and Bocquet8–Reference Batzill10 reviews.
A two-dimensional crystal on metals
The structure of graphene on many metals has been characterized using a large number of experimental and theoretical techniques.Reference Wintterlin and Bocquet8–Reference Batzill10 The key to understanding these structures and how they form is recognizing graphene’s two-dimensional nature. Graphene is distinguished by in-plane carbon–carbon bonds of extreme strength, ∼7.4 eV per carbon atom.Reference Kittel11 Because graphene’s out-of-plane bonds are saturated, graphene sheets interact only weakly with each other and with common heterointerfaces, including most metals. In fact, the graphene–metal interaction with the majority of transition metals is on the order of the van der Waals interaction, roughly <100 meV per carbon atom.Reference Vanin, Mortensen, Kelkkanen, Garcia-Lastra, Thygesen and Jacobsen12
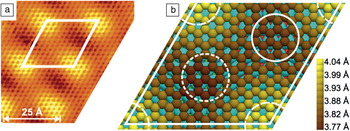
The lattice constants of neither the substrate nor graphene change significantly in response to the weak graphene–substrate interactions. As a result, there is a simple interference between the two lattices, creating a moiré pattern,Reference Land, Michely, Behm, Hemminger and Comsa13 as shown in Figure 1 for graphene on Ir(111). [Graphene–Ni(111) is the exception, but whether its tightly bound structure should be called graphene is debatable.Reference Wintterlin and Bocquet8, Reference Sun, Hannon, Tromp, Johari, Bol, Shenoy and Pohl15] The lateral periodicity of the moiré pattern is highly sensitive to the relative angle between the graphene and the substrate. X-ray diffractionReference Busse, Lazic, Djemour, Coraux, Gerber, Atodiresei, Caciuc, Brako, N’Diaye, Bluegel, Zegenhagen and Michely16 typically puts the average graphene–metal distance between 3 Å and 4 Å, consistent with theoretical calculations and close to the interlayer separation of graphite. The moiré pattern’s lateral, out-of-plane corrugation has been a subject of disputeReference Borca, Barja, Garnica, Minniti, Politano, Rodriguez-Garcia, Hinarejos, Farias, Vazquez de Parga and Miranda17 and varies with the substrate and the relative orientation.
Moiré pattern of graphene on Ir(111). (a) Scanning tunneling microscopy topography, with the rhombic unit cell traced in white. (b) Illustration of the C(10 × 10) = Ir(9 × 9) unit cell optimized by density functional theory. Shading of the carbon atoms corresponds to their calculated heights above the iridium surface. First-, second-, and third-layer iridium atoms are colored cyan, red, and green, respectively. Regions with different alignments of graphene to the underlying layers are highlighted as follows: solid circle, hcp-type; short-dashed circle, fcc-type; dashed circle segments, atop-type. Adapted from Reference Reference N’Diaye, Bleikamp, Feibelman and Michely14.

The exception to weak graphene–metal interactions occurs at the edges of the graphene sheets. There is much evidence that these edges are generally more tightly bound and, thus, closer to the substrate than the sheet interior. Thus, small graphene islands tend to be dome shaped.Reference Lacovig, Pozzo, Alfe, Vilmercati, Baraldi and Lizzit18 As discussed in the later section “Observations of growth,” these edge interactions are believed to play a key role in graphene’s unusual growth mechanisms.
Growth methods
There are three common ways to grow graphene on metals. First, for metals with significant carbon solubility, such as nickel, carbon segregates from the bulk upon cooling from high temperature, leading to graphene growth.Reference Shelton, Patil and Blakely19 Second, decomposition of hydrocarbons such as ethylene or methane is straightforward when the metal, such as platinum,Reference Morgan and Somorjai2 has sufficient catalytic activity. When such chemical vapor deposition (CVD) is performed at pressures greater than about 1 mTorr, hydrogen is frequently co-mixed with the hydrocarbon. The hydrogen helps clean the substrate by removing impurities such as oxides,Reference Mattevi, Kim and Chhowalla9 but whether hydrogen plays a more direct role in graphene growth remains unresolved.Reference Vlassiouk, Regmi, Fulvio, Dai, Datskos, Eres and Smirnov20, Reference Zhang, Li, Kim, Zhang and Zhou21 The third method, used for substrates such as gold that do not decompose hydrocarbons, is direct deposition of elemental carbon.Reference Perdereau and Rhead22 In most cases, temperatures above about 700°C are required to grow graphene;Reference Wofford, Nie, McCarty, Bartelt and Dubon23 lower temperatures tend to give amorphous or poorly crystalline carbon.
We note that carbon-film growth is described by a large, sophisticated literature that includes methods to grow diamond films in environments that selectively etch the more easily formed graphitic carbon.Reference May24 The recent desirability of graphene, however, has created the new challenge of growing just one or two graphitic layers that are large single crystals of uniform thickness.
Observations of growth
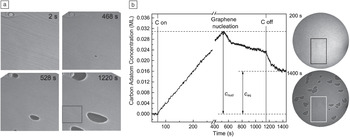
Considerable insight into graphene growth mechanisms has come from low-energy electron microscopy (LEEM). Figure 2a shows an example of growth observed by LEEM for the case of segregation from the substrate. Growth is usually heterogeneous, starting at impurities or defects such as the edges of substrate steps or step bunches,Reference Coraux, N’Diaye, Engler, Busse, Wall, Buckanie, Heringdorf, van Gastei, Poelsema and Michely27 which run from upper left to lower right in Figure 2a. In some cases, a single nucleation site can seed multiple new crystals, leading to polycrystalline two-dimensional islands.Reference Wofford, Nie, McCarty, Bartelt and Dubon23 Nucleation densities can be very low, which favors the creation of large crystals.Reference Sutter, Flege and Sutter28 This very low density suggests that the nucleation sites are associated with rare defects in the step edges. Although their nature is not known in any detail, nucleation sites can sometimes be controllably induced.Reference Yu, Jauregui, Wu, Colby, Tian, Su, Cao, Liu, Pandey, Wei, Chung, Peng, Guisinger, Stach, Bao, Pei and Chen29
(a) Time sequence of low-energy electron microscopy (LEEM) images showing the nucleation and growth of graphene islands (dark shapes) formed from carbon segregating from the ruthenium bulk at 950°C. Field of view = 26 μm. Part (a) reproduced with permission from Reference Reference McCarty, Feibelman, Loginova and Bartelt25. ©2011, Elsevier.

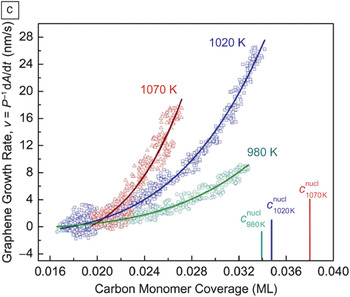
(b) Carbon adatom concentration during growth, measured from electron reflectivity at 670°C, and LEEM images (46-μm field of view) taken at 200 s and 1400 s. Boxes in the LEEM images mark the graphene-free regions where the carbon adatom concentration was determined. c eq and c nucl are the adatom concentrations in equilibrium with graphene and needed to nucleate graphene, respectively. (c) Island growth rate on Ru(0001) as a function of adatom concentration. The solid lines are fits to the nonlinear form expected when the rate-limiting step involves addition of units of five carbon atoms. A and P are the total area and perimeter of a graphene island, respectively. Parts (b) and (c) reproduced with permission from Reference Reference Loginova, Bartelt, Feibelman and McCarty26. ©2008, Institute of Physics.

All evidence supports a growth mechanism that involves adsorbed carbon species diffusing to the edges of graphene sheets, where they become incorporated into the graphene lattice. (No evidence supports direct attachment of a gas-phase species or direct incorporation of interstitial carbon from the substrate.) Thus, nucleation requires a high concentration of carbon atoms on the metal surface. LEEM allows this concentration to be monitored because the reflectivity of low-energy electrons can be very sensitive to even trace amounts of adsorbed carbon.Reference Loginova, Bartelt, Feibelman and McCarty26
Figure 2b shows a plot of the time-dependent concentration of carbon adatoms during carbon deposition on Ru(0001). When the carbon coverage reaches 3% of a monolayer (0.03 ML), graphene islands nucleate at the type of sites mentioned previously. The carbon adatom concentration then decreases. When the growth flux is stopped, the concentration does not drop to zero; instead, it goes to the value in equilibrium with the graphene, about 1.5% of a monolayer.
The establishment of this equilibrium implies that, during growth, adatoms are both attaching to and detaching from the graphene. Growth results from a bias for attachment over detachment caused by the adatom supersaturation, which is the difference between the time-dependent and equilibrium concentrations, as labeled in Figure 2b. Thus, graphene growth is not an example of the irreversible growth models commonly invoked to explain low-temperature heteroepitaxy.
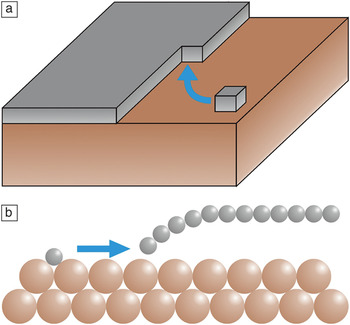
In the standard (“Kossel crystal”) picture of epitaxial growth (Figure 3a), atoms deposited on terraces diffuse until they reach a kink site on a step edge, where they are incorporated.Reference Chernov31 As an adatom attaches to the edge of the growing island, it experiences only a small energy barrier, typically comparable to the barrier for diffusion on the terrace: The coordination of an atom in its transition state during terrace diffusion is not substantially different from that in the transition state during incorporation into a growing two-dimensional crystal.
Schematic illustration of the difference between (a) standard solid-on-solid models of epitaxial growthReference Michely and Krug30 and (b) graphene growth on metals. Carbon (gray) is tightly bound to itself within the graphene sheet and to the metal, either as isolated adatoms or at the edges of the graphene sheet.

The situation is quite different for graphene on a metal, as shown in Figure 3b. A carbon adatom on the metal surface must eventually break all of its bonds with the substrate to become part of the graphene crystal. These bonds are very strong, typically several electronvolts.Reference Wu, Zhang, Li, Yang and Hou32 For example, from the high value and temperature dependence of the equilibrium concentration mentioned in relation to Figure 2b, the adatom–metal bond strength on Ru(0001) can be deduced as only a few tenths of an electronvolt smaller than the roughly 7-eV binding energy of carbon in graphene.Reference Loginova, Bartelt, Feibelman and McCarty26
The question is, how can these bonds be broken using only thermal energy? Loginova et al. cast light on this dilemma by showing that the rate-limiting step of growth on ruthenium and iridium involves attaching carbon to graphene edges in units of five atoms.Reference Loginova, Bartelt, Feibelman and McCarty26, Reference Loginova, Bartelt, Feibelman and McCarty33 Specifically, by monitoring growth rates as a function of supersaturation, they found that growth velocity varied as the fifth power of the adatom concentration (Figure 2c). Because small islands have both carbon–carbon bonds and carbon–metal bonds, small clusters are presumably part of the transition state because they bridge between fully metal-bonded adatoms and fully carbon-bonded graphene.
The location of such clusters on the surface was not immediately clear. One proposal was that the clusters were generated thermally on the terraces,Reference Loginova, Bartelt, Feibelman and McCarty26, Reference Zangwill and Vvedensky34 a plausible scenario given that experiment and simulation revealed the presence of low-energy clusters on metal terraces.Reference Wang, Ma, Caffio, Schaub and Li35 However, subsequent workReference Loginova, Bartelt, Feibelman and McCarty33 showed that these clusters likely form at the graphene edge.
A simple interpretation then follows: Kinks must be nucleated at edges, and this nucleation requires five atoms to be added simultaneously to the graphene edge.Reference Loginova, Bartelt, Feibelman and McCarty33 The rate-limiting step in crystal growth involves a concerted event, whose rate is appreciable only at substantial supersaturations. The attachment barrier depends on the detailed structures of the carbon–metal bonds at the graphene edge, which are determined by the complex details of the moiré periodicity and substrate composition. This explains, for example, why differences in the graphene orientation on the substrate lead to substantial variations in growth velocity.Reference Loginova, Bartelt, Feibelman and McCarty33 However, the source of the carbon (e.g., segregation versus CVD) does not change how growth occurs:Reference Loginova, Bartelt, Feibelman and McCarty33 The growth velocity is the same function of adatom supersaturation, independent of how the supersaturation is created. Whether this cluster-addition mechanism applies to other metals and to CVD at high pressures and temperatures remains to be resolved.
We now summarize the conclusions of the in situ growth studies. Graphene growth is reversible, and it is appreciable only at high supersaturations of surface carbon atoms. Moreover, the binding of the graphene edge to the metal plays a critical role. This is in marked contrast to typical heteroepitaxial growth (e.g., metal-on-metal epitaxy), where growth is irreversible, the supersaturation is small, and the details of the crystal edge are often not important.
To determine the origin of these differences, one must consider the relative binding strengths of the film and the growth species to the substrate. As already mentioned, graphene interacts weakly with most transition metals. In typical epitaxy, however, the bonding between the film and the substrate is comparable to the bonding within the film. In addition, carbon adatoms and graphene edge atoms typically have carbon–metal bonds that are comparable in strength to the carbon–carbon bonds within graphene. This again contrasts with typical epitaxy, where adatoms and edge atoms are considerably more weakly bound than bulk atoms.
Influence of substrate morphology
The surfaces of solid metals invariably contain atomic-height steps. Often, impurities cause the surfaces to form facets, especially on vicinal surfaces.Reference Williams and Bartelt36 Graphene grows over descending substrate steps from higher terraces without interrupting the graphene lattice, a reflection of its polymeric nature.Reference Coraux, N’Diaye, Busse and Michely37 This remarkable behavior enables defect-free graphene to be grown over areas much larger than any defect-free (step-free) region of a surface. This key attribute makes graphene growth on metals technologically attractive. (If crossing metal steps were found to interrupt the graphene lattice, then growth on liquid metals might be advantageous.Reference Geng, Wu, Guo, Huang, Xue, Chen, Yu, Jiang, Hu and Liu38)
However, substrate morphology can strongly affect growth. Growth over ascending steps does not exhibit a universal behavior on different surfaces. For example, on Ru(0001), graphene does not grow over ascending substrate step edges, leading to lenticular islands as graphene grows along and away from the step edges where it nucleated,Reference Sutter, Flege and Sutter28 as observed in Figure 2a. (However, graphene can grow into the ascending steps, displacing ruthenium atoms.Reference Starodub, Maier, Stass, Bartelt, Feibelman, Salmeron and McCarty39, Reference Günther, Dänhardt, Wang, Bocquet, Schmitt and Wintterlin40) In some systems (e.g., on copper and iridium), graphene can cross ascending and descending steps, bend over facet junctions, and even bridge across metal grain boundaries.Reference Wofford, Nie, McCarty, Bartelt and Dubon23, Reference Coraux, N’Diaye, Engler, Busse, Wall, Buckanie, Heringdorf, van Gastei, Poelsema and Michely27, Reference Loginova, Bartelt, Feibelman and McCarty33, Reference Sutter, Albrecht and Sutter41, Reference Murata, Petrova, Kappes, Ebnonnasir, Petrov, Xie, Ciobanu and Kodambaka42 In yet other cases, the graphene orientation can change when crossing steps, creating a mosaic structure correlated with the surface morphology.Reference Nie, Wofford, Bartelt, Dubon and McCarty43 Simply sputtering a surface before growth can dramatically change the shape of graphene islands.Reference Jin, Fu, Zhang, Mu, Zhang, Tan and Bao44 None of these effects of surface morphology are understood in any detail at an atomic level. However, such an understanding will be crucial in the optimization of growth processes, given the importance of surface morphology in nucleation and growth.
Another important aspect is that the growth process itself can change the morphology of the substrate. In fact, one of the first studies of this phenomenon showed that graphene growth induced copper surfaces to form facets.Reference Perdereau and Rhead22 Also, at the high temperatures used for growth, metals such as copper can undergo considerable sublimation, which leads to copper step retraction.Reference Wofford, Nie, McCarty, Bartelt and Dubon23 This sublimation is slowed in regions covered by graphene, causing copper steps to be trapped under graphene, thereby creating mounds and roughening the surface topography. Inhibiting sublimation by performing growth at high pressures presumably mitigates this effect.
Island shapes on metals
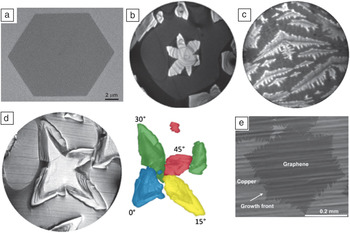
Another sign of the complexity of the factors controlling growth is the variety of island shapes observed on even a single metal (see Figure 4). Sometimes, islands are compact, as in the faceted hexagonal island shown in Figure 4a. Sometimes they are lobed (Figure 4b) or even highly dendritic (Figure 4c). These shapes are all presumably determined by kinetics.
Examples of island shapes on copper. (a) Scanning electron microscopy (SEM) image of a graphene grain on a copper foil grown by chemical vapor deposition (CVD). Part (a) reproduced with permission from Reference Reference Wu, Jauregui, Su, Liu, Bao, Chen and Yu45. ©2011, Wiley-VCH. (b) Low-energy electron microscopy (LEEM) image of a graphene island with six lobes on a screw dislocation in the Cu(111) substrate (14.5-μm field of view). (c) LEEM image of dendritic graphene grown on Cu(111) at 690°C, suggesting a diffusion-limited process (7-μm field of view). Parts (b) and (c) reproduced with permission from Reference Reference Nie, Wofford, Bartelt, Dubon and McCarty43. ©2011, American Physical Society. (d) LEEM image of a polycrystalline island on a (100)-oriented grain in a copper foil (20-μm field of view). In the right-hand image, the island lobes are colored according to their different in-plane rotations. Part (d) reproduced with permission from Reference Reference Wofford, Nie, McCarty, Bartelt and Dubon23. ©2011, American Chemical Society. (e) SEM image of graphene on a copper foil grown by CVD at 1035°C. Part (e) reproduced with permission from Reference Reference Li, Magnuson, Venugopal, Tromp, Hannon, Vogel, Colombo and Ruoff46. ©2011, American Chemical Society.

In the case of compact shapes, the rate-limiting step for growth is the attachment process at the step edge. The edge velocity then depends on the edge orientation, and the island shape in steady state is determined by a traditional kinematic Wulff construction;Reference Frank, Doremus, Roberts and Turnbull47 that is, facets appear in slow-growth directions.Reference Wofford, Nie, McCarty, Bartelt and Dubon23, Reference Luo, Kim, Kawamoto, Rappe and Johnson48
Dendritic shapes, on the other hand, are often a signature of diffusion-limited growth. Such dendritic islands are found for Cu(111)Reference Nie, Wofford, Bartelt, Dubon and McCarty43 and Au(111),Reference Wofford, Starodub, Walter, Nie, Bostwick, Bartelt, Thürmer, Rotenberg, McCarty and Dubon49 for example. Diffusion-limited growth is quite surprising given the large attachment barrier discussed for Ru(0001) in the earlier section “Observations of growth.” Evidently, in systems where dendritic growth occurs, there are easier routes to attachment, with barriers comparable to the ∼0.1-eV barriers that govern diffusion on close-packed metal surfaces.Reference Kellogg50
Bilayer graphene
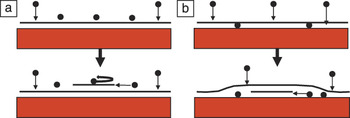
Large-area bilayer crystals are desired for some applications such as digital electronics. To obtain such crystals, perfect layer-by-layer growth is necessary. In normal heteroepitaxy (Figure 5a), the occurrence of layer-by-layer growth depends on the size of the Ehrlich–Schwoebel barrier, which is the barrier for atoms deposited on top of the film to diffuse over descending edges of the growing crystal.Reference Michely and Krug30 Large barriers cause the nucleation of new layers before the existing layers are completed, leading to rough crystal morphologies.
(a) Typical growth mechanism of films other than graphene. The black horizontal line represents the growing film. The growth species, the black balls, are unable to traverse a descending step (self-reversing arrow) due to the Ehrlich–Schwoebel barrier. Accumulation on the uppermost film surface leads to the on-top nucleation of new layers. (b) Underlayer mechanism of graphene growth on metals, illustrated for the case of carbon deposition. The deposited carbon diffuses to the graphene–metal interface, where new graphene layers nucleate and grow.

There is abundant evidence that multilayer graphene growth is entirely different: New graphene layers grow from below, next to the substrate, not on top of the prior layers, as shown schematically in Figure 5b. This “underlayer” mechanism was proposed by Tontegode and coworkers in the 1980s.Reference Gall, Rut’Kov and Tontegode7
Like the unusual features of monolayer growth, this growth mode is a consequence of the relative strengths of the different atomic bonds. The key bond to consider is that of carbon adatoms bonded to graphene. These adatoms are only weakly bound compared to those on the metal substrate. Thus, even carbon atoms deposited on top of graphene will migrate to the metal interface if there is a pathway. Experiments have shown that new graphene layers nucleate under even a complete graphene layer.Reference Gall, Rut’Kov and Tontegode7, Reference Nie, Walter, Bartelt, Starodub, Bostwick, Rotenberg and McCarty51 Thus, a pathway exists from the surface to the substrate, although its precise nature has not been identified. The carbon concentration then builds up at the graphene–metal interface until sufficient supersaturation is reached to nucleate a new layer. This underlayer mechanism operates during graphene formation by all three common routes: segregation,Reference Gall, Rut’Kov and Tontegode7, Reference Nie, Walter, Bartelt, Starodub, Bostwick, Rotenberg and McCarty51–Reference Odahara, Otani, Oshima, Suzuki, Yasue and Koshikawa54 CVD (see the next section), and carbon deposition.Reference Gall, Rut’Kov and Tontegode7, Reference Nie, Walter, Bartelt, Starodub, Bostwick, Rotenberg and McCarty51
Some of the factors that control this second-layer nucleation are the same as those controlling growth of the first layer. LEEM observations again show that nucleation is inhomogeneous.Reference Nie, Walter, Bartelt, Starodub, Bostwick, Rotenberg and McCarty51 Layer-by-layer growth requires that nucleation at the buried nucleation sites be slow. That is, the first and second layers have to cover the substrate completely before a third layer starts. Nucleating a new layer next to the substrate requires debonding of the overlying layer from the substrate. If the graphene–substrate bond is particularly strong, then nucleation will be slower. Thus, growing graphene layer-by-layer is easier on ruthenium,Reference Cui, Fu and Bao53 a relatively strongly bound system, than on iridium, a more weakly bound system.Reference Nie, Walter, Bartelt, Starodub, Bostwick, Rotenberg and McCarty51
We note that the underlayer nucleation and growth mechanism occurs in part because of the low carbon concentrations needed to grow controllably one or a few layers of graphene. At higher carbon concentrations and increasing numbers of layers,Reference Gall, Rut’Kov and Tontegode7 growth can occur by the “on-top” mechanism common to almost all other systems.
Another factor that determines whether layer-by-layer growth is attainable is the solubility of carbon in the bulk metal. If there is significant solubility at the growth temperature, deposited carbon will diffuse into the bulk. Upon cooling after growth, carbon will diffuse to the surface and nucleate new layers.Reference Shelton, Patil and Blakely19 The number of new layers is difficult to control, depending on both the amount of carbon dissolved in the metal and the coupled rates at which this carbon diffuses to the surface and is incorporated into graphene.Reference McCarty, Feibelman, Loginova and Bartelt25 One way of mitigating this problem is to limit the amount of carbon dissolved in the metal by using thin metal films.Reference Sutter, Albrecht and Sutter55 Another approach is to choose metals whose bulk carbon solubility is very low. This is the motivation for choosing copper as a substrate, a promising approach that is also currently the most popular.
Growth on copper
In 2009, the Ruoff group demonstrated the growth of single-layer graphene on copper foils through a simple CVD process.Reference Li, Cai, An, Kim, Nah, Yang, Piner, Velamakanni, Jung, Tutuc, Banerjee, Colombo and Ruoff56 This method has significant advantages: Copper foils are inexpensive and available in large sizes, and they can easily be dissolved using simple chemical or electrochemical processes that have no effect on graphene, allowing the graphene to be transferred easily to other supports. However, the greatest advantage comes from the low solubility of carbon in copper. This prevents additional growth by segregation during cooling from CVD temperatures, which, on nickel substrates, leads to nonuniform multilayer films.Reference Sun, Hannon, Tromp, Johari, Bol, Shenoy and Pohl15 (However, carbon can diffuse through polycrystalline copper foils.Reference Su, Lu, Wu, Li, Liu, Zhang, Lin, Juang, Zhong, Chen and Li57) Optimized processes produce uniform single-layer graphene films. Large-area films on copper produced by continuous “roll-to-roll” processes have been demonstrated.Reference Bae, Kim, Lee, Xu, Park, Zheng, Balakrishnan, Lei, Kim, Song, Kim, Kim, Ozyilmaz, Ahn, Hong and Iijima58
In the typical CVD process, the copper foil is first heat-treated in an argon/hydrogen flow, which serves to remove impurities, smooth the surface, and increase the copper grain size.Reference Mattevi, Kim and Chhowalla9 Introducing the hydrocarbon into the gas flow leads to graphene growth. Atmospheric-pressure processes, which avoid vacuum pumps, use methane diluted to the tens of parts-per-million level by argon/hydrogen,Reference Yu, Jauregui, Wu, Colby, Tian, Su, Cao, Liu, Pandey, Wei, Chung, Peng, Guisinger, Stach, Bao, Pei and Chen29 a reflection of the dilute concentrations needed to make an atomically thick film. Thus, a simple tube furnace and some ability to meter gas flows provide sufficient control to make high-quality graphene rapidly at low cost.
This simplicity has encouraged a large worldwide effort to understand how graphene grows by CVD on copper and what controls the film quality. One key factor is the quality of the copper surface, with clean and smooth surfaces producing better graphene. The most-studied foils have a marked (100) texture, a consequence of recrystallization during annealing after mechanical rolling.Reference Barrett and Massalski59 Graphene on Cu(100) grows aligned around two crystallographically equivalent in-plane orientations of the substrate, resulting in an inherent source of rotational disorder.Reference Wofford, Nie, McCarty, Bartelt and Dubon23 Also, vicinal (slightly misoriented) Cu(100) surfaces can become heavily faceted after exposure to carbon,Reference Rhead60 an effect that is readily seen in many of the scanning electron microscopy images in the literature. How the faceting affects growth and even whether it is present during growth or only during cooling are open questions.
The largest graphene islands are grown with substrate temperatures only a few tens of degrees below the copper melting point.Reference Li, Magnuson, Venugopal, Tromp, Hannon, Vogel, Colombo and Ruoff46 At these temperatures, the copper is subliming at high rates and has a vapor pressure of about 10–4 Torr. Thus, growth is occurring on an incredibly dynamic surface that is close to being a liquid. Some of the largest graphene islands are produced on the inside of copper foils formed into pouches.Reference Li, Magnuson, Venugopal, Tromp, Hannon, Vogel, Colombo and Ruoff46 This closed geometry leads to redeposition of the evaporated copper. How this dynamic situation of copper evaporation/condensation and carbon deposition (and likely carbon evaporation) affects growth is not currently known.
There is also considerable interest in growing uniform bilayer and multilayer films on copper foils. As discussed earlier and in the next section, graphene islands on copper foils usually do not have a single rotational alignment relative to the substrate plane, even within a single-crystal copper grain. (Graphene islands can maintain their crystallographic integrity as they grow across copper grain boundaries, though.) There are numerous examples in the literature where the two layers of a bilayer are not rotationally aligned.Reference Vlassiouk, Regmi, Fulvio, Dai, Datskos, Eres and Smirnov20 In this case, they cannot have Bernal stacking (as in graphite), a property that enables a bandgap to be opened by a perpendicular electric field.Reference Ohta, Bostwick, Seyller, Horn and Rotenberg61
Achieving spatially uniform bilayers by CVD on copper also appears to be problematic. Specifically, analysis of bilayer graphene grown by CVD has provided compelling evidence that the second graphene layer grows under, not on top of, the first-formed layer.Reference Nie, Wu, Xing, Yu, Bao, Pei and McCarty62 That is, the underlayer growth depicted in Figure 5b also occurs on copper and during CVD, which relies on the bare copper surface to catalyze hydrocarbon decomposition.Reference Li, Cai, An, Kim, Nah, Yang, Piner, Velamakanni, Jung, Tutuc, Banerjee, Colombo and Ruoff56 When the overlying graphene layer is complete, growth stops because there is no pathway for the hydrocarbon through the film. Thus, the two layers have to be completed at the same time. This is a challenge in simple CVD because the buried layer almost certainly grows more slowly than the overlying layer.
Optimizing film quality
Graphene films can contain many types of crystallographic defects,Reference Coraux, N’Diaye, Busse and Michely37 whose density generally decreases with increasing growth temperature. Particularly vexing, however, are rotational boundaries that form irreversibly where graphene islands with different in-plane orientations impinge.Reference Huang, Ruiz-Vargas, van der Zande, Whitney, Levendorf, Kevek, Garg, Alden, Hustedt, Zhu, Park, McEuen and Muller63 A dilemma exists in graphene synthesis on metals, in that the metals with the lowest carbon solubility (copper and gold), which prevents growth by segregation, also bind weakly to graphene.Reference Vanin, Mortensen, Kelkkanen, Garcia-Lastra, Thygesen and Jacobsen12 This weak interaction also leads to little preference for a single rotational orientation on the substrate surface. Thus, graphene islands on copper foils commonly have poor rotational alignment even within a single copper grain, as shown in Figure 4d.Reference Wofford, Nie, McCarty, Bartelt and Dubon23
Two approaches are being pursued to improve film quality by minimizing rotational misalignment. The first is to grow the largest-possible graphene islands, such as in Figure 4e. Then, even if the islands are not all rotationally aligned (either within a given copper grain or across copper grain boundaries), the density of rotational boundaries that occur where the islands impinge will be small. A variation of this approach is to produce large graphene islands (monolayers or bilayers) at controlled locations using seeding techniques,Reference Yu, Jauregui, Wu, Colby, Tian, Su, Cao, Liu, Pandey, Wei, Chung, Peng, Guisinger, Stach, Bao, Pei and Chen29 in which case an entire device can be fabricated in the known vicinity of the seed so that it lies completely within the resulting single-crystal island.
The second approach is to achieve a single in-plane alignment for all graphene islands, in which case there will be no rotational boundaries in the completed film even if the nucleation density is high. In fact, optimized growth on Cu(111)Reference Nie, Wofford, Bartelt, Dubon and McCarty43 and Au(111),Reference Wofford, Starodub, Walter, Nie, Bostwick, Bartelt, Thürmer, Rotenberg, McCarty and Dubon49 the lowest-energy surfaces of these metals, can yield graphene with nearly all islands closely aligned to a single in-plane orientation. The weak van der Waals bonding of graphene to these substrates suggests a coupling that would be too weak to impose an alignment. Thus, the physical origin of their alignment is an open question.
Summary
Research over the past few years has greatly increased knowledge of the properties of graphene on many metals, including how to grow and transfer it to other substrates. This recent work builds on a rich history that extends back to the emergence of modern, ultrahigh-vacuum-based surface science over 45 years ago. The intense worldwide focus on this one material has accelerated both the rate of knowledge generation and the development of techniques that can address the atomic-scale properties of a one-atom-thick film on a substrate. For applications such as transparent conducting displays for which thickness uniformity is not critical, manufacturable processes might already be available. However, there are still challenges to synthesizing “device-grade” graphene on an industrial scale. Filling in the gaps in our understanding of the growth mechanisms should enable progress. A key problem is the lack of understanding of what determines the mosaicity of the growth, for example, how particular in-plane orientations are selected. With this knowledge, the growth process could be tuned by engineering both the substrates themselves (e.g., by alloying) and the growth conditions to achieve uniform single-layer and bilayer graphene films with low densities of rotational boundaries and other defects.
Acknowledgments
This work was supported by the Office of Basic Energy Sciences, Division of Materials Sciences and Engineering, of the US Department of Energy under Contract DE-AC04–94AL85000. The authors thank Shu Nie and Elena Starodub for helpful comments on the manuscript and our many collaborators for stimulating discussions.