

Archaeologists have proposed various hypotheses to explain the adoption of pottery technology by hunter-gatherer groups. These explanations include the efficiency of pottery vessels over other container technology, increased sedentism, population pressure, storage, and/or a change in food processing needs related to diet change. In addition, several examples point to an association between pottery and increased use of aquatic resources. For example, recent residue analysis of lipids extracted from Incipient Jomon pottery (circa. 16,000 cal B.P.) suggests that the predominant use for these vessels was in the processing of aquatic resources (Craig et al. Reference Craig, Saul, Lucquin, Nishida, Taché, Clarke, Thompson, Altoft, Uchiyama, Ajimoto, Gibbs, Isaksson, Heron and Jordan2013; Lucquin et al. Reference Lucquin, Gibbs, Uchiyama, Saul, Ajimoto, Eley, Radini, Heron, Shoda, Nishida, Lundy, Jordan, Isaksson and Craig2016). Early pottery in northern Colombia (Oyuela-Caycedo Reference Oyuela-Caycedo and Hoopes1995) and interior Amazonia (Roosevelt Reference Roosevelt, William and Hoopes1995) is also associated with the use of estuarine resources such as fish and shellfish. Early pottery from the southeastern United States is found in coastal and riverine areas where shellfishing occurred, although the link between the two is not clear (Sassaman Reference Sassaman and Hoopes1995).
The late adoption of pottery technology in the North American Arctic, occurring sometime between 2,800 and 2,500 years ago, coincides with the development and spread of an increasingly specialized maritime economy. The moist and cold Arctic environment, short season for pottery production, and a lack of fuel do not favor pottery production (Frink and Harry Reference Frink and Harry2008; Harry and Frink Reference Harry and Frink2009). Nevertheless, the abundance of pottery in post-1500 B.P. sites of the western Arctic indicates that pottery was an important part of the hunter-gatherer tool kit in this region (Farrell et al. Reference Farrell, Jordan, Taché, Lucquin, Gibbs, Jorge, Britton, Craig and Knecht2014; Solazzo and Erhardt Reference Solazzo, Erhardt, Barnard and Eerkens2007; Solazzo et al. Reference Solazzo, Fitzhugh, Rolando and Tokarski2008). The age, distribution, and use of pre-1500 B.P. pottery technology in Alaska is, however, not well understood and presents an excellent case study for examining possible correlations between hunter-gatherer adoption of pottery technology and aquatic resource use.
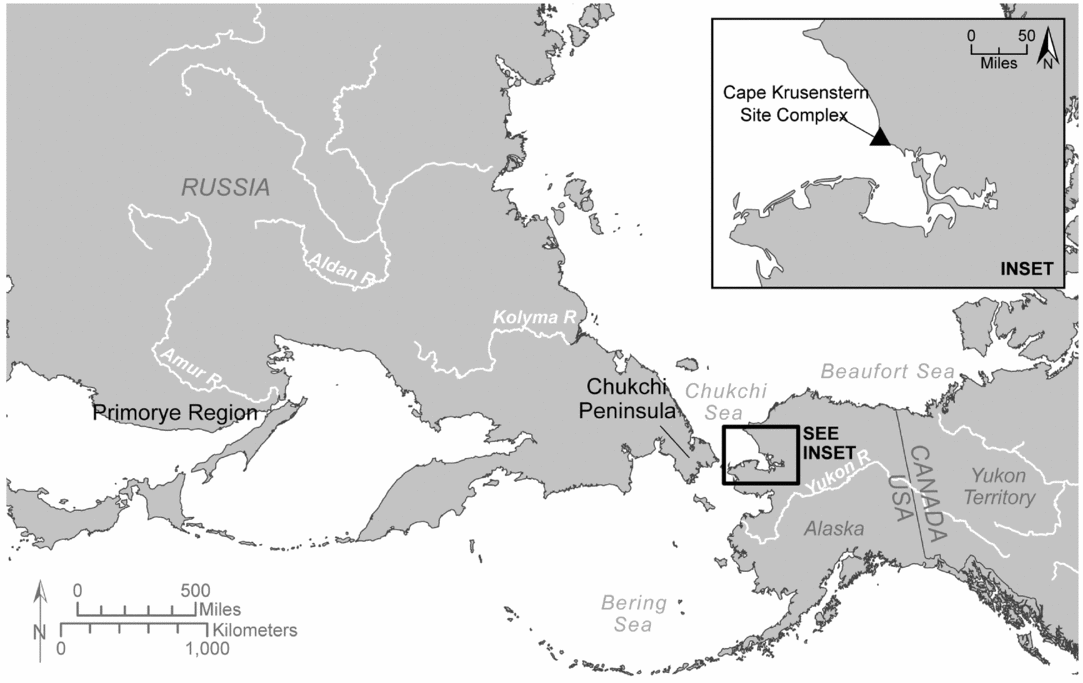
In this paper, we review the timing and distribution of early pottery in Alaska and explore the link between pottery adoption and aquatic resource use through lipid and compound-specific stable isotope analysis (CSIA) of 20 pottery vessel fragments from the Cape Krusenstern site complex in northwest Alaska (Figure 1). This is the first North American Arctic pottery residue study to include samples that predate 1500 cal B.P. Although this early pottery sample size is small (n = 2), our analysis lays the groundwork for a better understanding of why pottery was adopted.
Regions mentioned in text where early Arctic pottery technologies are found in relationship to the northwest Alaskan study area and site (see inset).

The Adoption of Pottery Technology in the North American Arctic
Why Do Hunter-Gatherers Make Pottery?
The specifics of how, when, and why hunter-gatherers adopted pottery around the world vary depending on regionally specific cultural and environmental contexts (see Jordan and Zvelebil Reference Jordan, Zvelebil, Jordan and Zvelebil2009 for recent overview). There are technological and economic advantages of pottery over other container technology, such as improved time management in production and cooking (Crown and Wills Reference Crown, Wills, Barnett and Hoopes1995; Schiffer and Skibo Reference Schiffer and Skibo1987) that could have led to the invention and spread of early pottery in hunter-gatherer groups. Unlike fiber, wood, or skin containers, potters can produce multiple ceramic vessels consecutively with little additional effort (Brown Reference Brown, van der Leeuw and Torrence1989; Eerkens et al. Reference Eerkens, Neff and Glascock2002). Ceramic vessels can more efficiently process foods requiring prolonged soaking or cooking (e.g., seeds; Arnold Reference Arnold1985). Most other container types cannot be directly heated (Rice Reference Rice1999). Ceramic vessels can also hold liquids, withstand abrupt temperature changes (Brown Reference Brown, van der Leeuw and Torrence1989), and provide better long-term storage for foods in most environmental contexts. The technological properties of ceramics increase the range of available food and save production and cooking time for other pursuits (Hoopes and Barnett Reference Hoopes, Barnett and Hoopes1995:5). It is possible that, in some cases, increased diet breadth leads to innovation or adoption of new ceramic technologies (Rice Reference Rice1999). Furthermore, return rates from incorporation of lower-ranked resources such as small fish and shellfish into the diet could be improved by prolonged cooking made possible by ceramic technology.
Alternatively, the relationship between aquatic resource use and pottery could be coincidental. Pottery production and use is more feasible as hunter-gatherers become sedentary, which can occur when people focus on predictable and abundant foods such as aquatic resources. Early pottery use also could have emerged for ritual purposes or in social contexts that included feasting and other forms of increased social interaction or exchange that may have included aquatic resources (Hayden Reference Hayden, William and Hoopes1995). Pottery use in ritual or feasting activities would explain relatively small early pottery sample sizes observed in most contexts and the appearance in some cases of non-vessel ceramic forms prior to pottery production.
The Origins and Timing of Pottery Adoption in Alaska
Along the coasts of the Bering Strait and northwest Alaska, the adoption of pottery coincides with increased sedentism and increased reliance on marine resources. Pottery appears for the first time in the Alaskan record sometime between 2,750 and 2,450 years ago, during the Choris phase (Ackerman Reference Ackerman1982). The origins of North American Arctic pottery are generally accepted to lie across the Bering Strait, in the Chukchi Peninsula and surrounding regions of Chukotka (Figure 1), where pottery appears earlier, perhaps around 5,000 years ago (Ackerman Reference Ackerman1982; Dumond and Bland Reference Dumond and Bland1995). Thin-walled, linear stamp, cord-marked, and textile-impressed pottery types are found at sites associated with the Ust’ Bel'skaia culture, 3,450 to 2,450 B.P. (Ackerman Reference Ackerman1982; Ponkratova Reference Ponkratova, Dumond and Bland2006), while check-stamped types are known from Northern Chukotkan Late Neolithic culture beginning ~3,000 B.P. (Ackerman Reference Ackerman1982:20). The roots of these Chukotkan ceramics are thought to lie further afield, perhaps in ceramic traditions that spread from the Yakutia region. The Alaskan Arctic Small Tool tradition (ASTt) could be an aceramic variant of Bel'kachinsk culture (Powers and Jordan Reference Powers and Jordan1990:268), while Ymyyakhtakh (~4,200 to 2,500 B.P.) ceramics are thought to be the antecedent of Norton pottery that appears in Alaska ~2,500 years ago (Dumond and Bland Reference Dumond and Bland1995).1
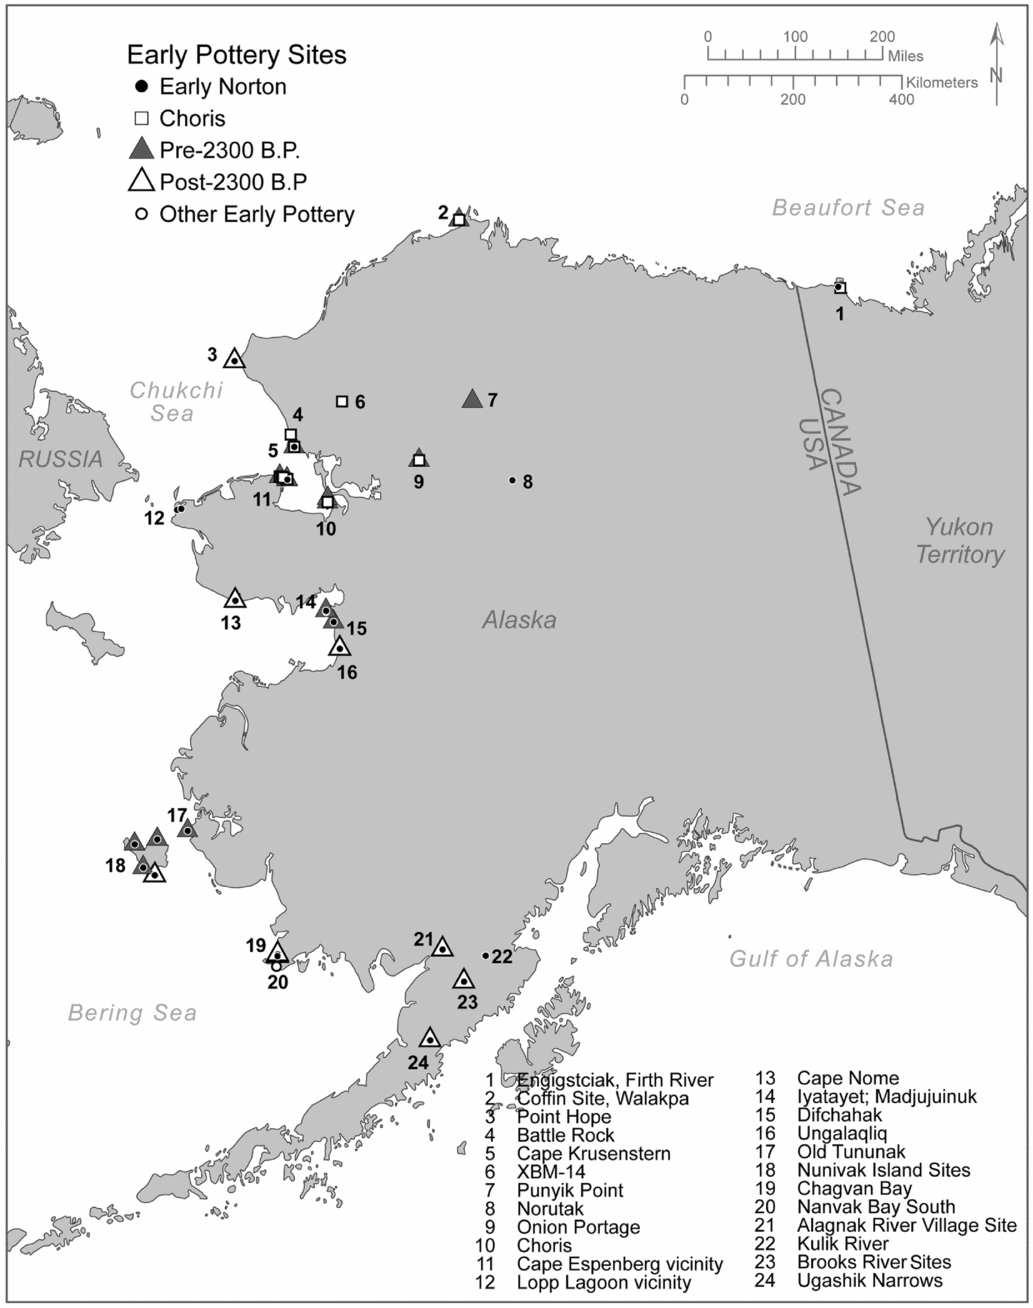
Although there are a few pottery fragments possibly associated with earlier Denbigh or ASTt (4500–2800 B.P.) components at the Engigstciak, Punyik Point, and Coffin sites in northern Alaska (Figure 2; Ackerman Reference Ackerman1982:14), the Choris phase is widely accepted as the first adoption of ceramic technology in Alaska. After 2,300 years ago, Norton phase (known as Near-Ipiutak in northern Alaska) pottery types occur at a small number of sites across a wider area of western Alaska (Figure 2). Beginning around 1,500 years ago and increasingly after 1,000 years ago, a significantly different pottery tradition associated with Birnirk and Thule cultures replaced early pottery types across the North American Arctic (Oswalt Reference Oswalt1955). This tradition spread with the ancestors of modern Iñupiat people across northern Alaska into the central Canadian Arctic and south into ancestral Yup'ik, Cup'ik, and Alutiiq (Sugpiaq) regions of southwest Alaska.
Early pottery sites (pre-1500 B.P.) in Alaska.

Alaskan Pottery Traditions
There are two major pottery traditions in northern Alaska: pre-1500 B.P. pottery associated with Choris and Norton Phases, and post-1500 B.P. pottery associated with Birnirk, Thule, and late precontact cultures. In northern Alaska, pre-1500 B.P. pottery was typically thin-walled and decorated with cord marking or with linear or check stamping (Oswalt Reference Oswalt1955). Northern Alaska vessels were globular in shape (Giddings and Anderson Reference Giddings and Anderson1986), while vessels from southwest Alaska had a cylindrical or barrel shape (Dumond Reference Dumond1981). Size estimates are not possible for the earliest pottery vessels due to the small sample. Post-1500 B.P. pottery was thicker and frequently undecorated or decorated in a variety of regional styles (Oswalt Reference Oswalt1955). Vessels were flat bottomed and cylindrical or flowerpot-like in shape. Vessel size was typically on the smaller side, between 25 and 50 cm in diameter (Anderson Reference Anderson2011:92), but some regional variation in size is likely, given that no size estimates exist for many assemblages. Temper type varied from region to region throughout time.
The shift from thin-walled, globular vessels to thick-walled, flat-bottomed vessels after 1500 B.P. suggests a change in food processing techniques. In general, thick-walled, flat-bottomed vessels are more commonly used for indirect heating than thin-walled, round-bottomed vessels (Reid Reference Reid and Bronitsky1989; Sassaman Reference Sassaman and Hoopes1995:226); perhaps pottery was used to process different foods, or to process foods differently after 1500 B.P. There is a significant increase in pottery abundance after 1500 B.P. in northern coastal Alaska (Ackerman Reference Ackerman1982). This increase in pottery is partly a function of preservation and an overall increase in known sites that postdate 1500 B.P., but it may also reflect a change in pottery use. For reasons yet unknown, at least some coastal peoples in northern Alaska abandoned pottery technology between about 1,750 and 1,150 years ago, during the Ipiutak Phase (Mason Reference Mason1998, Reference Mason, Arneborg and Grønnow2006).
The Role of Pottery in Precontact Northern Alaskan Cultures
The timing and distribution of early pottery technology in Alaska suggests a link with the expansion of maritime adaptations around 2,700 B.P. Was the adoption of pottery in northern Alaska associated with an expanding diet breadth and/or related to an increasingly marine focused diet? The relationship between expanding diet breadth and pottery, however, is most common in the use of r-selected (e.g., fruits, seeds, shellfish) rather than k-selected species (e.g., seals, walrus; Hoopes Reference Hoopes and Hoopes1995; Rice Reference Rice1999). Given the critical nutritional role of fats in plant and carbohydrate-poor northern environments, pottery may have played a crucial role in fish and marine mammal fat rendering (Fitzhugh Reference Fitzhugh, Habu, Savelle, Koyama and Hongo2003:68–70). These oils were both foods and important components of the food storage process, since dried and otherwise processed meat and plant products were often preserved in oil (e.g., Burch Reference Burch1998:147, 189). Oil was also a crucial source of fuel for light and heat, particularly where wood was sparse (Burch Reference Burch1998:244).
Pottery vessels may have been particularly suited to processing fish and mammal bone to extract nutrients and fats since prolonged boiling is possible in ceramic vessels but not in other types of containers used in the Arctic, such as baskets or skin bags. Harry and Frink (Reference Harry and Frink2009:334) argue that while some northern peoples did boil fat to render oil, in western Alaska it was more common to put blubber in seal pokes and bury it underground, where the fat would render itself (see also Spray Reference Spray2002). Instead, Harry and Frink (Reference Harry and Frink2009:335) hypothesize that cooking vessels were adopted in this region because of culinary preferences for parboiled foods. Because fish do not have thick deposits of subcutaneous blubber, it seems unlikely that fish oil would have self-rendered in seal pokes in the same way as marine mammal fat. Beluga fat also required cooking to transform it into oil; self-rendering did not work (Burch Reference Burch2006:165). On the Selawik and Kobuk Rivers of northwest Alaska, there are nineteenth- and twentieth-century accounts of people processing fish for oil by boiling indirectly in a large wooden pot; after boiling, the water was left to cool and the fat rose to the top (Burch Reference Burch2006:146). Similar processing in ceramic vessels could have taken place. Russian reports of Kodiak Island people melting whale fat in clay vessels (de Laguna Reference de Laguna1939) further support the idea that post-1500 B.P. ceramic cooking vessels were used for oil rendering at least occasionally.
Alternatively, perhaps Arctic foragers adopted pottery for social reasons. In a study of early northeastern North American pottery use, Taché and Craig (Reference Taché and Craig2015) find that pottery was used for storing or processing exchange commodities, such as fish oil. They argue that the development of pottery technology was related to social developments in hunter-gatherer society, such as feasting and social relationships. This could have been the case in Alaska: in the late precontact and contact era, oil was an important exchange item that could have been processed and/or transported in pottery containers (Burch Reference Burch2005). The small number, all decorated, of early ceramic vessels in Alaska (Ackerman Reference Ackerman1982) provides tentative support for this hypothesis.
A Revised Synthesis of Early Alaskan Pottery
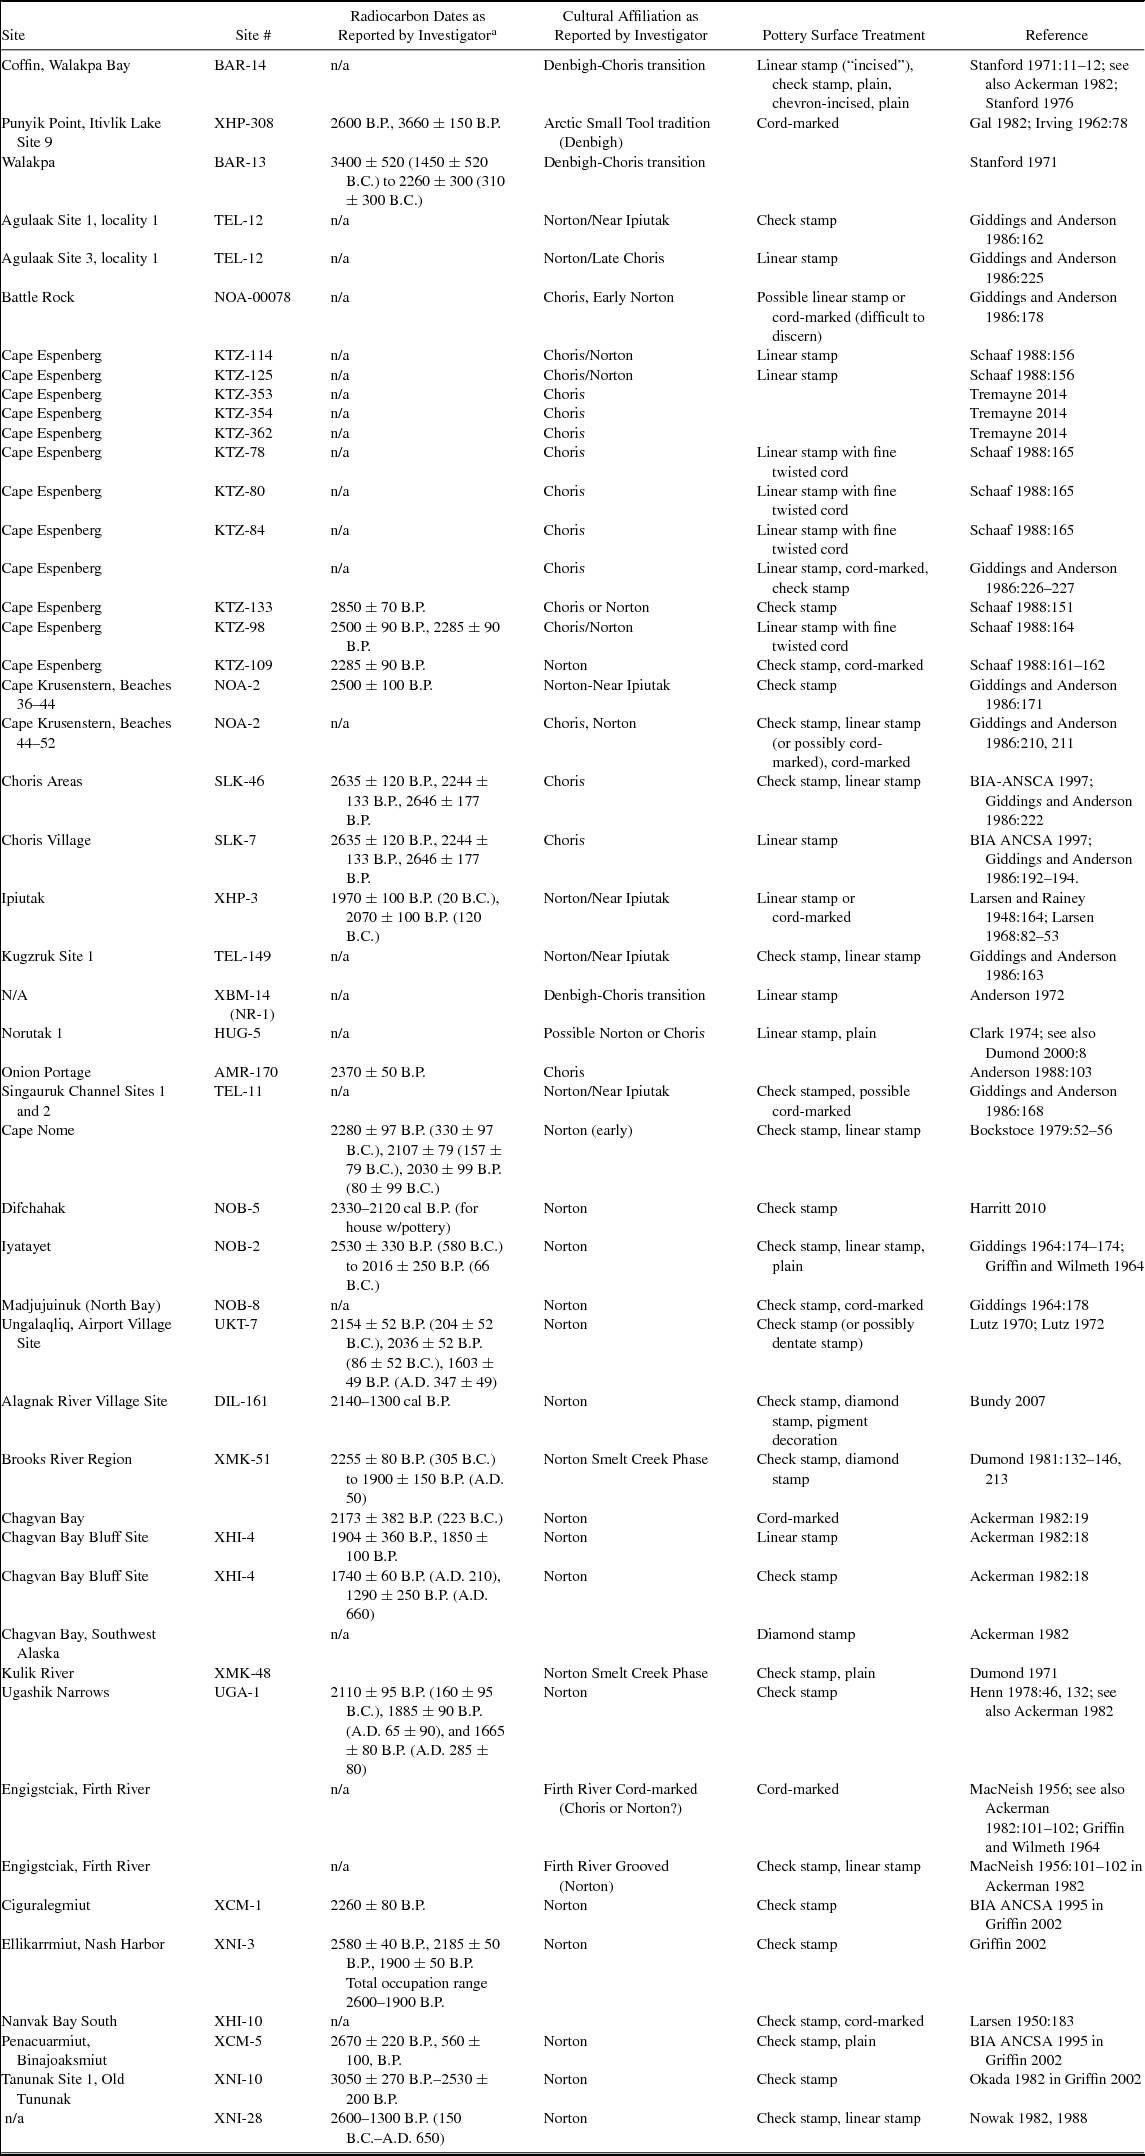
While the general pattern of pottery adoption in Alaska is fairly well understood, data on early pottery is limited and largely based on a review of the evidence for early pottery in Alaska and the Russian Far East completed in the early 1980s (Ackerman Reference Ackerman1982 but see Stimmell Reference Stimmell, Taylor, Morrison and Pilon1994). To better understand the timing and distribution of pre-1500 B.P. pottery in Alaska, we reviewed post-1980 literature and site data. The review involved examining Alaska state site records and associated documents that contained information about early pottery sites and any sites reported to contain precontact ceramic material. Out of more than 45,000 site records and 15,000 reports in the Alaska state site database (AHRS 2014), we identified 41 sites associated with the Choris Phase and 100 records associated with the Norton Phase, as well as 103 site records that mentioned precontact ceramics, and 179 site records reporting precontact pottery. We reviewed site forms, associated reports, and other regional gray literature published since 1980 (e.g., Anderson Reference Anderson1988; BIA ANCSA 1997; Bundy Reference Bundy2007; Giddings and Anderson Reference Giddings and Anderson1986; Schaaf Reference Schaaf1988; Tremayne Reference Tremayne2014; see Table 1) and compiled information about site age, cultural affiliation, and ceramics. The resulting database has 47 early pottery sites (Table 1) and includes sites meeting one or more of the following criteria:
-
• Pottery-bearing sites dating to before 2000 B.P.
-
• Pottery-bearing sites identified as dating to the Denbigh (or ASTt), Choris, or early Norton (e.g., Smelt Creek) phases
-
• Presence of early pottery types or decorations (cord-marked, check stamp, linear stamp, textile-impressed, diamond stamp)
Early Pottery Sites in Alaska.

a It is often not clear, particularly in older publications, whether or not the dates were calibrated. They are presented here as they were by the original investigator. If dates were originally provided in B.C./A.D. format, those dates are provided in parentheses.
Early Pottery Distributional Patterns
Our findings revealed patterns in the distribution of early Alaskan pottery that are consistent with those observed by Ackerman over 30 years ago. Although much archaeological research has taken place over the past three decades, very little early Alaskan pottery was recovered (Table 1). Early pottery is relatively rare, occurring in small numbers at a few sites. For example, in a recent regional analysis of 8,393 pottery sherds from northwest Alaska, only nine early pottery samples were identified (Anderson Reference Anderson2016; Anderson, Boulanger et al. Reference Anderson, Boulanger, Glascock and Benjamin Perkins2016).
Our synthesis revealed interesting distributional patterning of early pottery sites. First, early pottery sites are primarily located in coastal areas (Figure 2). While it is true that research is biased toward coastal areas in northern and western Alaska, several significant projects have taken place in interior northwest Alaska since 1980, and the interior sample of early pottery is still very small. Second, while we identified a few sites dating to as early as about 2800–2500 B.P. (e.g., Cape Espenberg, Choris, Iyatayet), the majority of early pottery sites date after 2300 B.P. (Table 1). Third, the earliest sites (2500 to 2300 B.P.) are distributed from northern Alaska to as far south as Nunivak Island, with slightly later (after 2300 B.P. to 2000 B.P.) sites found over a wider area of the Yukon-Kuskokwim delta and southwest Alaska. Finally, Norton pottery is widespread in southwest Alaska after 2000 B.P.
Unfortunately, the earliest pottery sites remain poorly dated; 24 out of 47 early pottery sites lack absolute dates (Table 1), and some of these result from outdated radiocarbon methods (e.g., solid carbon dating). In numerous cases, the earliest pottery comes from uncertain contexts; for example, at Choris (Giddings and Anderson Reference Giddings and Anderson1986) and Iyatayet (Giddings Reference Giddings1964). Dating of Choris and early Norton phase sites is often based on relative dates from pottery types rather than on absolute dates. It remains unclear when pottery technology first appeared in Alaska.
Nonetheless, our review reinforces a link between early pottery use and coastal occupation in Alaska. Residue studies (Farrell et al. Reference Farrell, Jordan, Taché, Lucquin, Gibbs, Jorge, Britton, Craig and Knecht2014; Solazzo and Erhardt Reference Solazzo, Erhardt, Barnard and Eerkens2007; Solazzo et al. Reference Solazzo, Fitzhugh, Rolando and Tokarski2008) of both pots and lamps from Alaska indicate a link between post-1500 B.P. northern Alaskan pottery and marine resource use. However, until now, there was no residue data on pre-1500 B.P. pottery to address the question of changing use over time. Prior studies also did not incorporate CSIA of fatty acids, which can distinguish freshwater and marine signals. We undertook residue analysis to explore pottery use further in the Arctic, with a focus on possible links between pottery and aquatic resource use. Questions we seek to address here are (1) what types of resources were people processing in pottery vessels over the last 2,500 years? and (2) did resource use change over time? Our overall sample size is relatively small, particularly the pre-1500 cal B.P. pottery sample (n = 2), and we consider this analysis exploratory.
Residue Analysis Sample Selection and Methods
Pottery samples for residue analysis come from several different sites at the Cape Krusenstern site complex (Figure 1). The site complex encompasses a 4,200-year record of past human coastal occupation (Anderson and Freeburg Reference Anderson and Freeburg2013, Reference Anderson and Freeburg2014). The majority of sites that date before 2000 B.P. come from short-term occupations that typically consist of scatters of surface artifacts and occasional hearth features. After 2000 B.P., the prevalence of semi-subterranean occupation sites and settlements points to an increasingly settled lifeway and growth in local population over time. Beginning around 500 years ago, there is a shift in regional and local settlement patterns, with a decrease in settlement size and a relocation of settlements to previously unoccupied areas of the site complex (Anderson and Freeburg Reference Anderson and Freeburg2013, Reference Anderson and Freeburg2014).
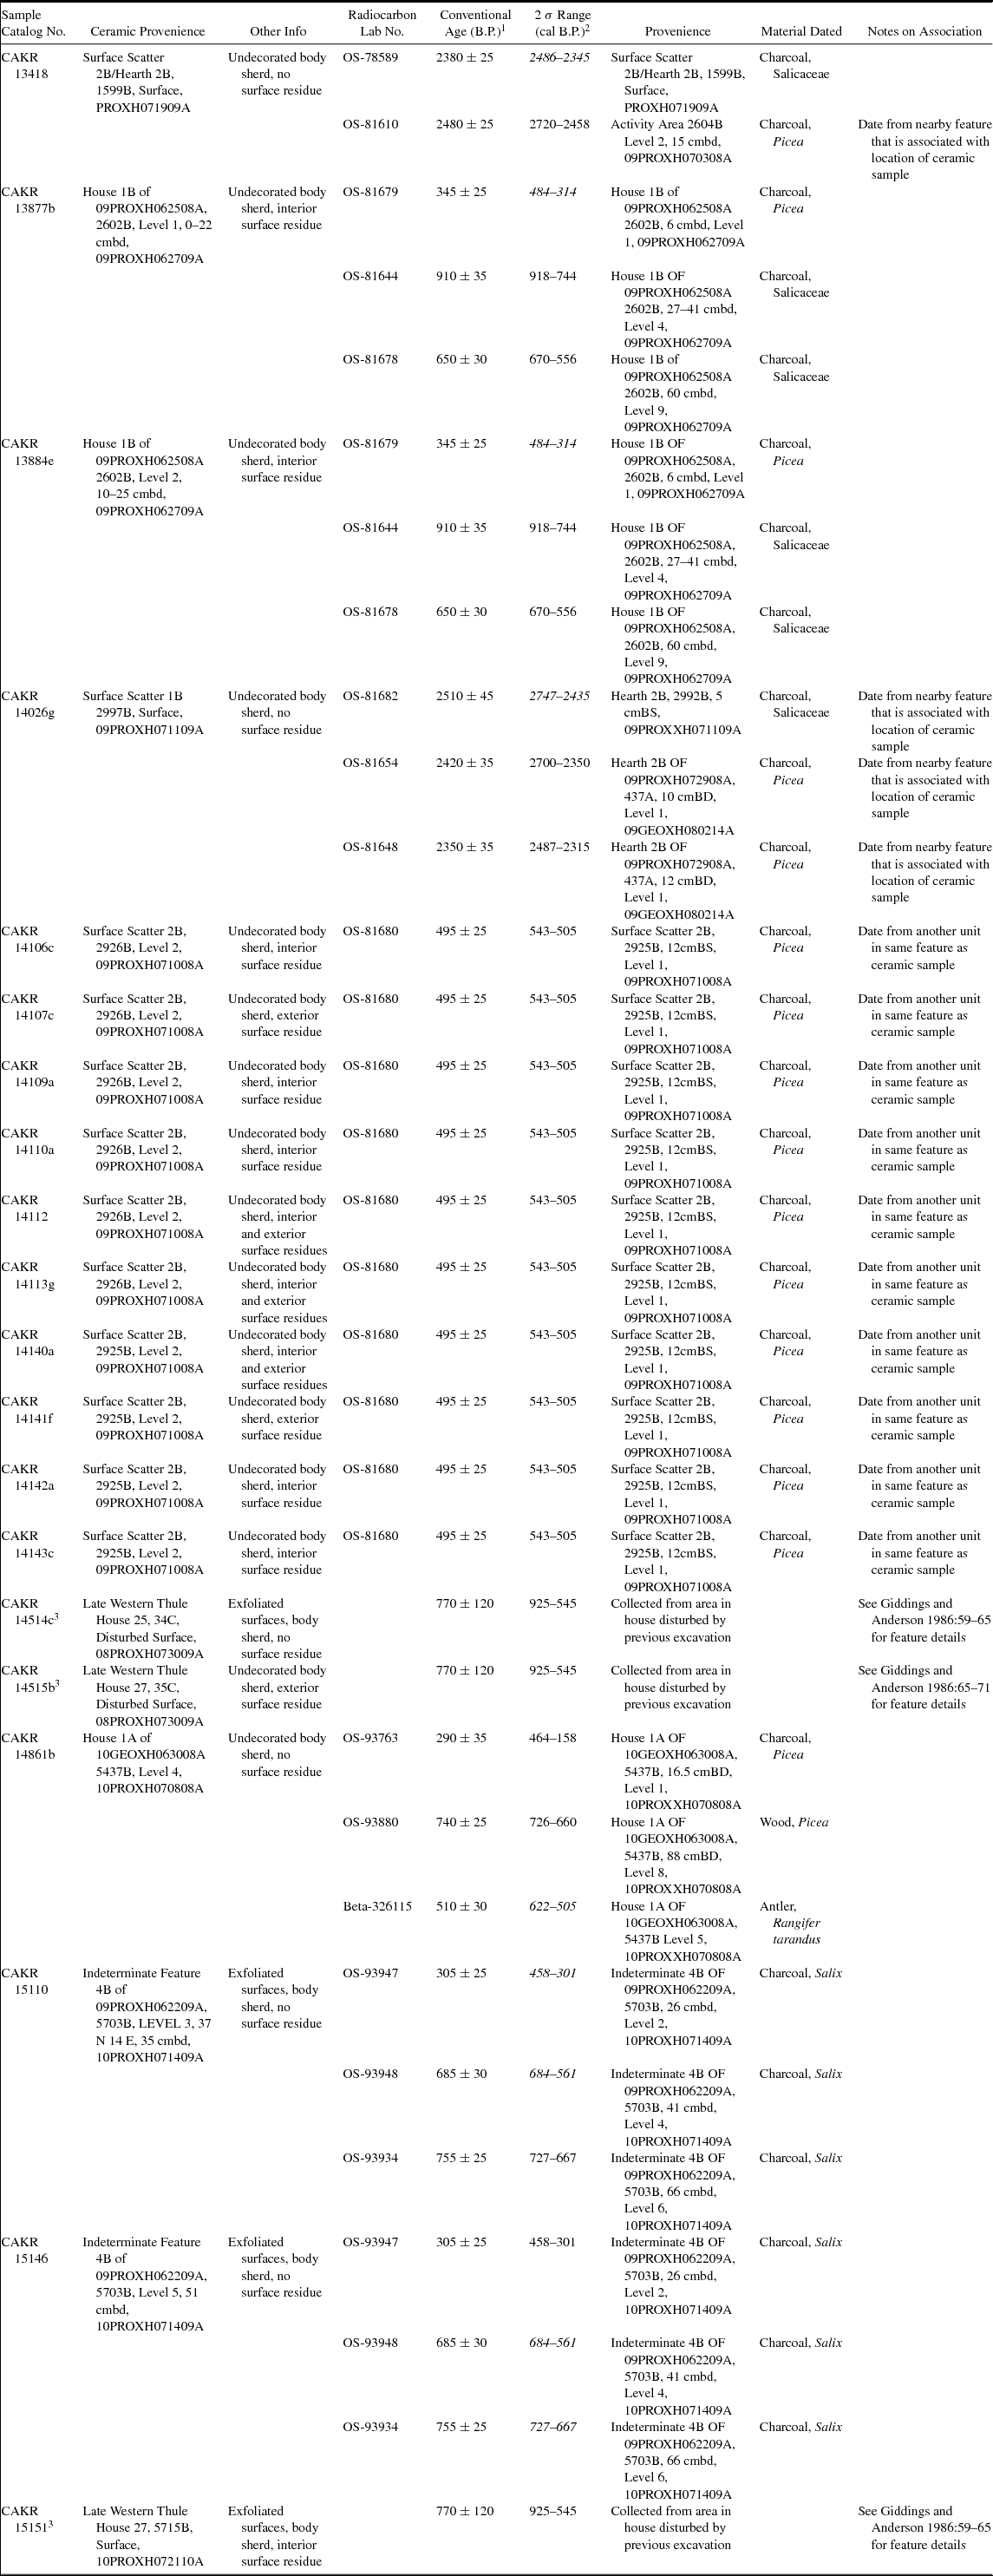
We selected 20 pottery samples from several types of sites, including surface scatters, semi-subterranean occupation features, and indeterminate features that could be occupation locations or storage features. Sample ages range from approximately 2700 to 200 cal B.P., with the majority of the samples dating to after 1000 cal B.P. (Table 2). Dates come from associated materials (Table 2); we chose not to date pottery food crusts because of the possibility of marine, or mixed marine and terrestrial, materials for which we do not have a regional reservoir correction.
Ceramic Specimens and Associated Dates from the Cape Krusenstern Site Complex.

1 Dates calibrated using OxCal v.4.2 (Bronk Ramsey Reference Bronk Ramsey2009), IntCal 13 (Reimer et al. Reference Reimer, Bard, Bayliss, Beck, Blackwell, Ramsey, Buck, Cheng, Edwards, Friedrich, Grootes, Guilderson, Haflidason, Hajdas, Hatté, Heaton, Hoffmann, Hogg, Hughen, Kaiser, Kromer, Manning, Niu, Reimer, Richards, Scott, Southon, Staff, Turney and van derPlicht2013).
2 Most closely associated date italicized.
3 Date ranges for these samples based on published dates for Late Western Thule House 25 (Giddings and Anderson Reference Giddings and Anderson1986:30).
Samples are from distinct vessels and were fragmentary when recovered. All the available samples were undecorated vessel body sherds; rim sherds and decorated sherds were not available from dated contexts. We considered thickness, temper, and other technological characteristics when selecting samples to avoid sampling the same vessel twice. Several sherds had interior and/or exterior surface residues that were apparent without magnification (Table 2).
We extracted lipids from powdered sherds with solvents (chloroform and methanol) and sonication, derivatized to methyl esters, and then analyzed for overall composition as well as the δ13C values of individual fatty acids, using only absorbed residues. We performed the compositional analysis of sherd lipids at the Gang Laboratory (Laboratory for Cellular Metabolism and Engineering) at Washington State University using GC/TOF-MS, and conducted the compound-specific δ13C analysis (CSIA) of individual fatty acids, using GC combustion isotope ratio mass spectrometry (GC-C-IRMS), at the University of California, Davis, Stable Isotope Facility. Additional details of laboratory methods are in Supplemental Text 1.
Criteria Used to Interpret Lipid Sources
Recent experimental and archaeological work makes it possible to identify aquatic lipids in archaeological contexts (Copley et al. Reference Copley, Hansel, Sadr and Evershed2004; Craig et al. Reference Craig, Steele, Fischer, Hartz, Andersen, Donohoe, Glykou, Saul, Martin Jones and Koch2011; Evershed et al. Reference Evershed, Copley, Dickson and Hansel2008; Hansel et al. Reference Hansel, Copley, Madureira and Evershed2004; Heron et al. Reference Heron, Nilsen, Stern, Craig and Nordby2010, Reference Heron, Søren Andersen, Fischer, Hartz, Saul, Steele and Craig2013). Widely accepted biomarker criteria for heating aquatic lipids in pottery vessels currently include a combination of at least one of three isoprenoid fatty acids—4,8,12-trimethyltridecanoic acid (4,8,12-TMTD), 2,6,10,14-tetramethylpentade- canoic acid (pristanic acid), and 3,7,11,15-tetramethylhexadecanoic acid (phytanic acid)—together with, ω-(o-alkylyphenyl) alkanoic acids of at least 18 and 20 (and preferably, also 22) carbons (Evershed et al. Reference Evershed, Copley, Dickson and Hansel2008). Combining aquatic biomarkers with CSIA can provide strong evidence for the processing of marine fauna (Buonasera et al. Reference Buonasera, Tremayne, Darwent, Eerkens and Mason2015; Copley et al. Reference Copley, Hansel, Sadr and Evershed2004); alternatively, it can suggest freshwater aquatic contributions, or a mixture of terrestrial and aquatic resources (Craig et al. Reference Craig, Forster, Andersen, Koch, Milner, Stern, Bailey and Heron2007, Reference Craig, Steele, Fischer, Hartz, Andersen, Donohoe, Glykou, Saul, Martin Jones and Koch2011; Lucquin et al. Reference Lucquin, Gibbs, Uchiyama, Saul, Ajimoto, Eley, Radini, Heron, Shoda, Nishida, Lundy, Jordan, Isaksson and Craig2016; Taché and Craig Reference Taché and Craig2015).
Biomarker Compounds Used to Identify Aquatic Resources
Isoprenoid fatty acids 4,8,12-trimethyltri- decanoic acid (4,8,12-TMTD) 2,6,10,14- tetra- methylpentadecanoic acid (pristanic acid), and 3,7,11,15-tetramethylhexadecanoic acid (phytanic acid) are present in aquatic animal fats; they are rarely encountered, and then only in very low amounts, in terrestrial mammals and are not present in plant oils (Ackman Reference Ackman1989; Ackman and Hooper Reference Ackman and Hooper1968; Copley et al. Reference Copley, Hansel, Sadr and Evershed2004; Evershed et al. Reference Evershed, Copley, Dickson and Hansel2008). Phytol, present in the chlorophyll of photosynthesizing organisms, is biologically modified to 4,8,12,-TMTD, phytanic acid, and pristanic acid as it moves through aquatic food webs (Ackman Reference Ackman1989:23). The presence of one or more of these isoprenoid fatty acids is used to detect processing of aquatic products in archaeological pottery and features (Copley et al. Reference Copley, Hansel, Sadr and Evershed2004; Craig et al. Reference Craig, Forster, Andersen, Koch, Milner, Stern, Bailey and Heron2007; Cramp et al. Reference Cramp, Evershed, Lavento, Halinen, Mannermaa, Oinonen, Kettunen, Perola, Onkamo and Heyd2014; Farrell et al. Reference Farrell, Jordan, Taché, Lucquin, Gibbs, Jorge, Britton, Craig and Knecht2014; Hansel et al. Reference Hansel, Copley, Madureira and Evershed2004; Heron et al. Reference Heron, Nilsen, Stern, Craig and Nordby2010).
In addition to isoprenoid fatty acids, the presence of ω-(o-alkylyphenyl)alkanoic acids with 18, 20, and 22 carbons provides evidence that aquatic products were processed in the presence of heat. Experiments indicate that these compounds form when tri-unsaturated fatty acids like 18:3, 20:3, and 22:3 are exposed to temperatures above 270°C in an anoxic environment (Evershed et al. Reference Evershed, Copley, Dickson and Hansel2008:105). Unlike terrestrial mammal fats, aquatic fats/oils have high amounts of polyunsaturated fatty acids that are 20 and 22 carbons long. Heating these fats in pottery vessels produces ω-(o-alkylphenyl) alkanoic acids 20 and 22 carbons long (Evershed et al. Reference Evershed, Copley, Dickson and Hansel2008).
Detection of α,ω-dicarboxylic acids (sometimes referred to as diacids) can provide further evidence that substantial amounts of unsaturated fatty acids were once present in a residue (Buonasera Reference Buonasera2013; Passi et al. Reference Passi, Picardo, De Luca, Nazzaro-Porro, Rossi and Rotilio1993; Regert et al. Reference Regert, Bland, Dudd, van Bergen and Evershed1998). These compounds form from oxidation of C-C double bonds, and their length may be representative of double bond positions in the original unsaturated fatty acids (Evershed et al. Reference Evershed, Copley, Dickson and Hansel2008; Passi et al. Reference Passi, Picardo, De Luca, Nazzaro-Porro, Rossi and Rotilio1993). Evershed et al. (Reference Evershed, Copley, Dickson and Hansel2008:106) found that α,ω-dicarboxylic acids between C8 and C11 long were formed “in appreciable amounts” during experimental heating of marine oils.
Compound-Specific δ13C Analysis (CSIA)
Application of CSIA to ancient lipids compares δ13C16:0 and δ13C18:0 values to those from modern reference fats that have been adjusted to account for contributions of industrial carbon (Craig et al. Reference Craig, Steele, Fischer, Hartz, Andersen, Donohoe, Glykou, Saul, Martin Jones and Koch2011:17914; Regert Reference Regert2011:196). Palmitic (C16:0) and stearic (C18:0) acids are used in these comparisons because they are typically the most abundant lipids encountered in ancient organic residues. Marine animal fats are significantly more enriched in 13C than terrestrial animal fats, allowing for discrimination between these resources (Choy et al. Reference Choy, Potter, McKinney, Reuther, Wang and Wooller2016; Copley et al. Reference Copley, Hansel, Sadr and Evershed2004; Craig et al. Reference Craig, Forster, Andersen, Koch, Milner, Stern, Bailey and Heron2007, Reference Craig, Steele, Fischer, Hartz, Andersen, Donohoe, Glykou, Saul, Martin Jones and Koch2011; Cramp et al. Reference Cramp, Evershed, Lavento, Halinen, Mannermaa, Oinonen, Kettunen, Perola, Onkamo and Heyd2014). Freshwater fish and salmonids (including freshwater and anadromous species) overlap with non-ruminant animal fats, but not with wild ruminant animal fats (Craig et al. Reference Craig, Forster, Andersen, Koch, Milner, Stern, Bailey and Heron2007, Reference Craig, Steele, Fischer, Hartz, Andersen, Donohoe, Glykou, Saul, Martin Jones and Koch2011; Taché and Craig Reference Taché and Craig2015;). Even though anadromous salmon do not eat once they enter freshwater systems, 13C values for reference fats from these species are less enriched than fats for many marine organisms and at the upper (more enriched) end of freshwater fish (Choy et al. Reference Choy, Potter, McKinney, Reuther, Wang and Wooller2016; Taché and Craig Reference Taché and Craig2015).
Other compounds that supported aquatic resource designations included long-chain saturated and unsaturated fatty acids with 20 and 22 carbons and ratios of palmitic (C16:0) to stearic acids (C18:0) greater than 1 (Heron et al. Reference Heron, Nilsen, Stern, Craig and Nordby2010; Taché and Craig Reference Taché and Craig2015). Fatty acids longer than 18 carbons, especially unsaturated fatty acids longer than 18 carbons, are rare in terrestrial animal fats, but abundant in aquatic resources (Evershed et al. Reference Evershed, Copley, Dickson and Hansel2008). They also occur in some plant seed oils and are components of the cuticular waxes of terrestrial plant leaves (Gunstone Reference Gunstone1999). Given the local environment, however, large systematic contributions from terrestrial plant sources seem less likely than contributions from aquatic organisms. We also noted the presence of α,ω-dicarboxylic acids ranging from carbon chain lengths of C7-C12. Finally, we identified heating of aquatic resources in pottery vessels by the presence of one or more isoprenoid fatty acids (4,8,12-TMTD, phytanic acid, or pristanic acid), as well as ω-(o-alkylyphenyl)alkanoic acids 18 and 20 carbons long. Further information on the sources of sherd lipids was provided by δ13C values for C16:0 and C18:0.
Residue Analysis Results
Aquatic Biomarkers
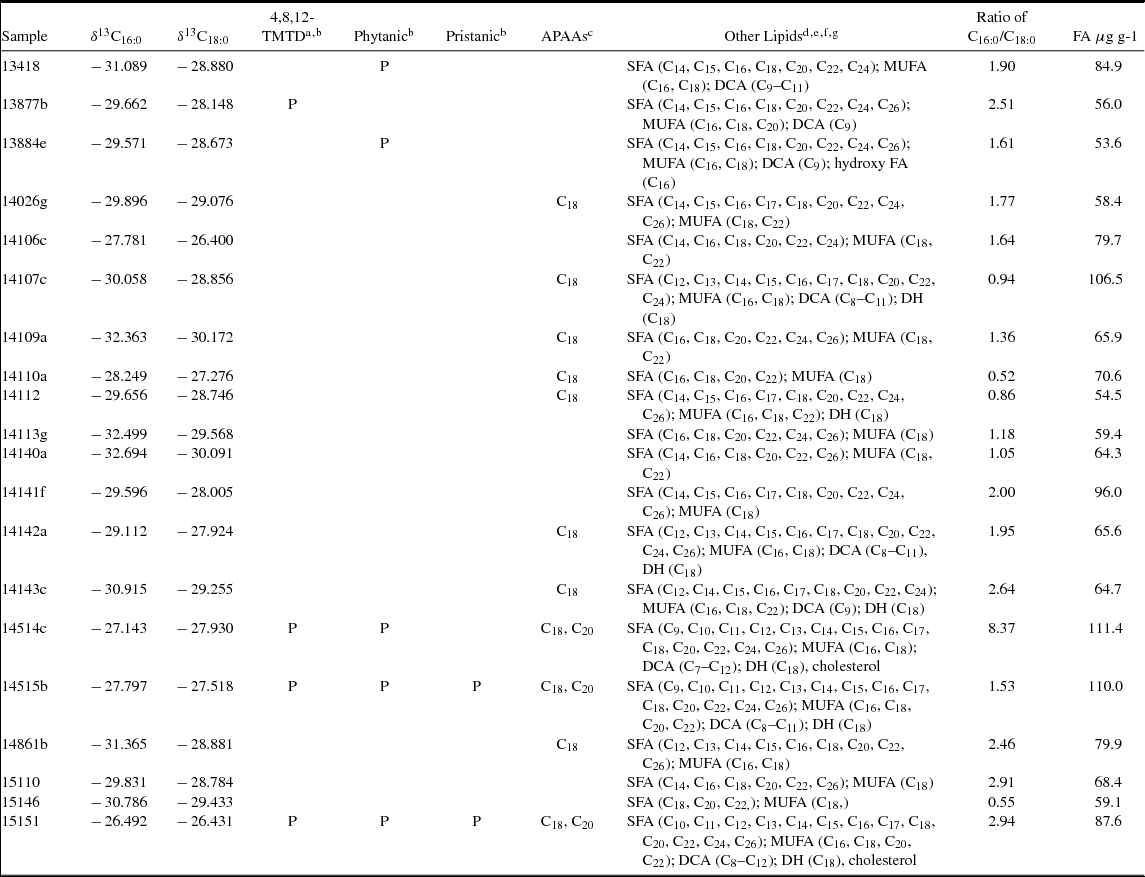
Most sherds have combinations of markers that are highly suggestive of aquatic resources—though not all are definitive, according to accepted criteria. Six samples contained one or more isoprenoid fatty acids, 11 samples contained APAAs, most samples had saturated and monounsaturated fatty acids 20 and 22 carbons long, and most also had ratios of palmitic acid to stearic acid greater than one (Table 3). Additionally, δ13C values for C16:0 and C18:0 are consistent with aquatic organisms.
Summary of Residue Results.

a trimethyltridecanoic acid
b P = present
c APAAs = ω-(o-alkylyphenyl)alkanoic acids
d SFA = saturated fatty acids
e MUFA = monounsaturated fatty acids
f DCA = α,ω-dicarboxylic acids
g DH = dihydroxy fatty acids
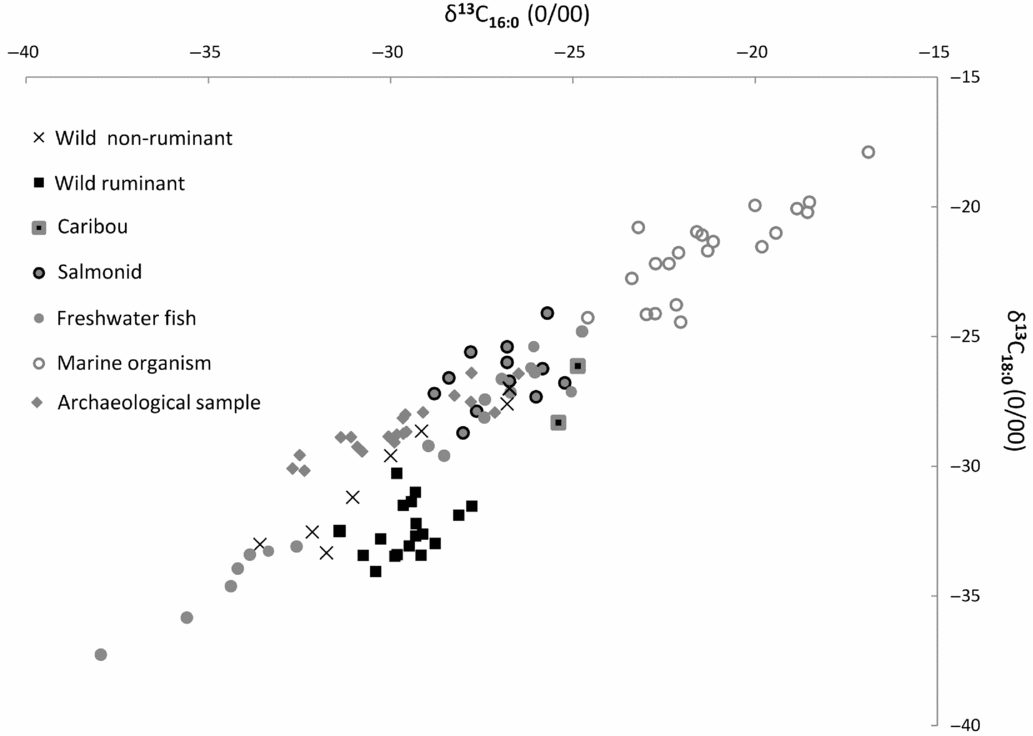
Two samples (14110 and 15146) have ratios of palmitic to stearic acid that are much lower than one, which could suggest a substantial terrestrial animal (especially ruminant) contribution. On the other hand, 14110 had some of the more enriched δ13C values in this study, more consistent with aquatic contributions, and especially salmonids, than with ruminants (caribou could be an exception, but more data are needed; see Figure 4). Both sherds (14110 and 15146) also have less abundant and less complex lipid contents than many other sherds, which could indicate differences in use or less favorable preservation conditions.
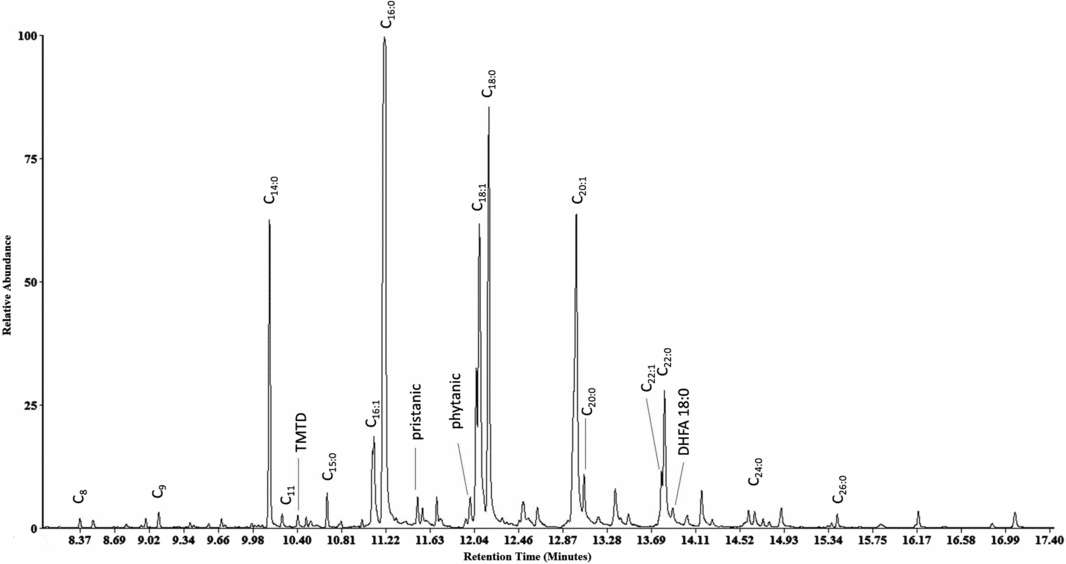
The strongest candidates for processing of aquatic resources were samples 15151, 14514c, and 14515b. These three sherds each exceeded the minimum acceptable criteria for aquatic resources and retained two or three isoprenoid fatty acids, APAAs 20 carbons long, and saturated and monounsaturated fatty acids 20 and 22 carbons long. These sherds also contained abundant degradation products of unsaturated fatty acids (dicarboxylic fatty acids and dihydroxy fatty acids) and high palmitic to steric acid ratios. Figure 3 shows a total ion count chromatogram (TIC) for 14515b. All three samples came from houses at the Late Western Thule site (Giddings and Anderson Reference Giddings and Anderson1986). Unfortunately, no contextual information is available for these samples, which were collected from disturbed contexts at these previously excavated features.
Total ion count chromatogram (TIC) for sample 14515b.

Compound-Specific δ13C Values
Stable carbon isotope values of sherd lipids are consistent with an aquatic origin, but do not indicate a primarily marine origin. More specifically, δ13C values for C16:0 and C18:0 place sherd lipids most convincingly in the range of freshwater or anadromous fish (Figure 4, Table 3, Supplemental Figure 1, Supplemental Table 1). These values partially overlap reference fats for wild non-ruminant terrestrial mammals, though they do not overlap wild ruminant reference fats (see discussion below). It is also possible that the sherd δ13C values could result from mixtures of marine and freshwater resources, or aquatic and terrestrial resources.
Compound-specific δ13C values from the current project plotted with reference data from Choy et al. (Reference Choy, Potter, McKinney, Reuther, Wang and Wooller2016:Table S2) and Taché and Craig (Reference Taché and Craig2015:Table S2) (see Supplemental Figure 1 for color).

As noted above, comparison of δ13 values for C16:0 and C18:0 in sherd lipids provides evidence against a predominantly ruminant origin. Among ruminants, differences in the biosynthetic origins of C16:0 and C18:0 produce a pattern where C18:0 is 1–6 ppm more depleted in 13C than C16:0 (Evershed et al. Reference Evershed, Dudd, Copley and Mutherjee2002:81; Taché and Craig Reference Taché and Craig2015:184). In contrast to the pattern observed in ruminant fats, the δ13C values in our samples show an opposite relationship, with 13C more depleted in C16:0 than in C18:0 (Figure 4, Supplemental Table 1).
To summarize, the δ13 values for C16:0 and C18:0 do not indicate that sherd lipids were derived from primarily marine or primarily ruminant sources. Based on our CSIA results, sherd lipids could arise from processing (1) primarily freshwater fish, (2) primarily non-ruminant terrestrial mammals, or (3) mixtures of various resources. When combined with data from lipid compositional analysis, however, the isotopic information supports an aquatic contribution rather than one dominated by non-ruminant terrestrial animals. Lipid compositional analysis shows widespread presence of numerous aquatic biomarkers, including APAAs 18 to 20 carbons long, isoprenoid fatty acids, and abundant monounsaturated and saturated fatty acids 20 and 22 carbons in length. Although not all of these compounds are always present in the same sherd, most sherds contain one or more aquatic biomarkers (Table 3). Further, if either marine resources or ruminants were routinely processed in pottery vessels, we might expect a larger sample to include many sherds with remnant fats that plot closer to, or within, the marine or wild ruminant zones.
Discussion
The Origin of Lipids in Pottery: Potential Confounding Factors
It is important to consider factors that may confound our results, in particular the possibility that identified residues are not associated with cooking and preparation of certain foods per se, but rather to pottery production and maintenance. Postcontact Native Alaskans incorporated dog hair, dog excrement, seal blood, and seal oil into the clay itself during clay preparation (e.g., Arnold and Stimmell Reference Arnold and Stimmell1983; Fienup-Riordan Reference Fienup-Riordan2005). During the late nineteenth/early twentieth centuries there are various reports of treating unfired vessels with seal oil (Fienup-Riordan Reference Fienup-Riordan1975:14; Oswalt Reference Oswalt1952:20), burnt fish eggs (VanStone Reference VanStone1989:28), and potentially other animal oils or blood. In some cases, pottery vessels were treated or seasoned after firing by placing a “broth” of water and fish backbones into the vessel and cooking it all day to impart a permanent fishy flavor to the vessel (Oswalt Reference Oswalt1952). Vessels were sometimes smeared with blood or oil after firing, and were re-oiled after a period of use (Reid Reference Reid and Bronitsky1989:171). Vessels were also reportedly lined with skins or membrane material once finished, likely to reduce vessel permeability (Arnold and Stimmell Reference Arnold and Stimmell1983; Reid Reference Reid and Bronitsky1989:171).
While materials added to the vessel prior to firing likely broke down during the firing process, the effect of post-firing treatment with oils and fats on the residue results is unclear. Sample pre-treatment removes surface residues, but absorbed residues from pottery maintenance could be included in analytical results. Mixing of residues related to maintenance versus residues associated with use could result in signals like those encountered in this study. Future experimental studies elucidate such processes. This issue could also be addressed by comparing bulk δ15N and compound-specific δ13C values between charred surface encrustations from burned food or other materials processed in the pots and residues absorbed in the ceramic matrix. Charred surface crusts can be complex mixtures of various biomolecular compounds, potentially from different tissues and different organisms, in addition to environmentally absorbed compounds. Two studies, however, suggest that combining bulk δ15N values of charred surface crusts with δ13C values of specific fatty acids (C16:0 and C18:0) extracted from the crusts can help to distinguish between freshwater, marine, and terrestrial sources (Craig et al. Reference Craig, Forster, Andersen, Koch, Milner, Stern, Bailey and Heron2007; Heron and Craig Reference Heron and Craig2015). Such data could prove especially useful for detecting systematic differences between absorbed versus surface residues in large samples of sherds.
Northern Alaskan Vessel Use
The residue results are somewhat surprising in that the evidence does not indicate heavy or exclusive marine resource processing in ceramic vessels. These results differ from previous regional residue studies that identified marine residues and proteins in northern pottery samples (Solazzo and Erhardt Reference Solazzo, Erhardt, Barnard and Eerkens2007; Solazzo et al. Reference Solazzo, Fitzhugh, Rolando and Tokarski2008) or aquatic residues but not specifically marine versus freshwater residues (Farrell et al. Reference Farrell, Jordan, Taché, Lucquin, Gibbs, Jorge, Britton, Craig and Knecht2014). This may be due to methodological differences. For example, Farrell et al. (Reference Farrell, Jordan, Taché, Lucquin, Gibbs, Jorge, Britton, Craig and Knecht2014) used GC and GC/MS but not CSIA. Their analysis, therefore, relied only on biomarkers, as no isotope data were available. At present, the only way to separate freshwater and marine resources is through isotopic analysis, since both resource types have the same suite of biomarkers. Our residue results also differ from our expectations for local diet and dietary change based on the results of ongoing faunal analysis from Cape Krusenstern. Faunal research indicates a reliance on a variety of seal species. Caribou (the predominant local ruminant resource) are found in small proportions in faunal assemblages from across the site complex, and fish remains were recovered in abundance from only a few sites, primarily dating to the late precontact period, ca. 500–250 cal B.P. (Adam Freeburg, personal communication 2016). Artifacts recovered from the site complex further indicate reliance on marine resources, with fish-associated artifacts (small net weights, smaller barbed hooks and gaff parts) more abundant in late precontact assemblages (Freeburg and Anderson Reference Freeburg and Anderson2012; Giddings and Anderson Reference Giddings and Anderson1986). Preservation conditions at older sites and lack of small screen size during excavation may partially impact the recovery of fish bone.
Ethnographic evidence indicates that, in addition to spring sealing activities at Cape Krusenstern, people fished for several species of whitefish and other locally abundant fishes (e.g., char, grayling) in local lagoons and rivers (Burch Reference Burch1998; Uhl and Uhl Reference Uhl and Uhl1977). Interestingly, fishing was primarily a women's activity during the ethnographic period (Burch Reference Burch1998), as was pottery making and use (Harry and Frink Reference Harry and Frink2009). The predominant method of catching whitefish reported at Cape Krusenstern and in the surrounding area was through the construction of gravel and wood catchments at shallow lagoon mouths (Burch Reference Burch1998:145; Uhl and Uhl Reference Uhl and Uhl1977:11). After minimal construction, these structures would trap fish as water levels dropped with the outgoing tide. Such structures would not leave a trace in the archaeological record. Our residue results, therefore, provide a unique line of evidence about local diet in the absence of fish bone preservation and preservation of fishing-related artifacts and structures.
Conclusions
Our results indicate a more complex and interesting pattern of resource processing in ceramic vessels than anticipated at the outset of our study. The potential link between aquatic resource use and pottery use remains, although the evidence is strongest for post-1500 B.P. samples rather than for early, pre-1500 B.P. samples, which are small in number. Our synthesis of published and unpublished Alaskan ceramic data shows that few early Alaskan pottery sites date to before 2,300 years ago; there are no dated pottery sites earlier than 2800 cal B.P. Early sites are rare and are known primarily from coastal contexts. This research adds a sample and associated radiocarbon dates to the early pottery data set, but the known sample size for pre-1500 B.P. pottery is small, and residue data from early pottery is minimal. The residue evidence for both early and late pottery suggests either the use of primarily freshwater fish, or mixtures of various resources that could include marine resources. Our results do not suggest exclusive or predominantly marine resource use, contrary to our expectations at the outset of the study. Residue data also provides information about pre-1700 cal B.P. resource use that was not previously available as faunal and artifactual data from the site complex dating to before 1700 cal B.P. are very limited; the pre-1700 cal B.P. sample size, however, must be expanded to further explore pre-1700 cal B.P. diet.
Possible links between northern pottery use and expanding diet breadth or intensification remain. Our data do suggest that this was more likely after 1500 B.P. when shifts in pottery technology and abundance coincide with other evidence of growing population, sedentism, and reliance on marine and aquatic resources around western Alaska and the Bering Strait region (Anderson, Brown et al. Reference Anderson, Brown, Junge and Duelks2016). Our pre-1500 cal B.P. sample size is too small to assess whether or not this was the case during the period of pottery adoption in Alaska. Perhaps pottery use met a need for resource intensification to support a growing and increasingly sedentary population at this time. The small amount of early pottery in Alaska could be a function of preservation or the small number of known sites from this time. Earlier use of pottery was possibly associated with other activities, such as social exchange or interaction during a period of rapid change in Alaska beginning around 2700 B.P., as previously suggested by Ackerman (Reference Ackerman1982:32). While oils were often rendered and stored in seal pokes and other animal organs, it is possible that storage and transport of the same commodities in small, curated pottery containers increased their social impact and prestige value in exchange and social interactions. Geochemical sourcing of a small number of early pottery shows overlap in source use between early and later ceramics in northwest Alaska, indicating that early pottery was made locally rather than imported from elsewhere (Anderson Reference Anderson2016; Anderson et al. Reference Anderson, Boulanger and Glascock2011; Anderson, Boulanger et al. Reference Anderson, Boulanger, Glascock and Benjamin Perkins2016). However, perhaps pottery was used to process or transport oils or other exchange items as part of crucial social networks well documented during the late precontact and contact eras in Alaska (Burch Reference Burch2005).
So why was pottery technology adopted in the North American Arctic around 2500 B.P.? We need additional residue analysis, particularly of pre-1500 B.P. pottery, before answering this question. With additional samples, we may be able to use statistical methods to detect increased or decreased processing of aquatic resources over time. For example, Taché and Craig (Reference Taché and Craig2015:180) compared the relative use of marine resources between inland and coastal locations by applying a non-parametric statistical test to bulk C and N stable isotope results. Future study should include a large reference sample of local native species to better characterize the range of variability in compound-specific δ13C values; this is particularly important for northern Alaskan resources, as many of the current CSIA reference data come from Europe or Asia. Comparison of pottery data to analysis of extractions from identified zooarchaeological specimens would also be informative. Comparison of early and late coastal pottery residue data with residue analysis of samples from interior northwest Alaskan sites would further inform on the question of pottery use, as would experimental work to explore the relationship between animal products used in pottery production versus pottery use and the resulting residue signals.
Our study provides provocative results suggesting a long-standing association of pottery with aquatic resources over an interval spanning the initial adoption of pottery around 2500 B.P.—an interval when pottery was a novel technology and possibly a marker of social status—followed by an expansion in the use of pottery throughout Alaska around 1500 B.P. Our data on early, pre-1500 B.P. pottery use is quite limited (n = 2), and these results need additional investigation. Later use of pottery may have provided a technological solution to changes in adaptive strategies occurring at this time, namely decreased group mobility, an expansion of maritime adaptations, and resource intensification. Our results suggest stability in association with aquatic resources and contribute new data to the larger discussion about hunter-gatherer pottery and aquatic resource use in northern contexts.
Acknowledgments
This research was funded by the National Park Service through cooperative agreement J8W07070032, managed by the Pacific Northwest Cooperative Ecosystem Study Unit. Many thanks to Eileen Devinney (NPS) for supporting residue analysis of Cape Krusenstern pottery samples and to Justin Junge for his assistance with Figure 2. Patrick Doyle assisted with Figure 4. Johonna Shea provided further assistance with preparation of graphics. Mary Soots provided the Spanish abstract. The National Park Service gave permission for destructive analysis. We also thank Jelmer Eerkens (UC Davis Anthropology), David Gang and Anna Berem (Laboratory for Cellular Metabolism and Engineering at WSU), and Chris Yarnes (UC Davis Stable Isotope Facility).
Data Availability Statement
Electronic data associated with residue and isotopic analysis are stored at the University of Arizona School of Anthropology. Remnant ceramic specimens are stored at Portland State University Department of Anthropology.
Supplementary Material
Supplemental materials are linked to the online version of this paper, which is accessible via the SAA member login at https://doi.org/10.1017/aaq.2017.8.
Supplemental Text 1. Residue methods.
Supplemental Table 1. Figure 4 compound-specific δ13C values for palmitic acid (C16:0) and stearic acid (C18:0)
Supplemental Figure 1. Color version of Figure 4.
Supplemental Captions.
Supplemental References.