


The recent growth of empirical scholarship on the politics of redistribution in advanced capitalist societies is impressive. Taking the canonical median voter model associated with Romer (Reference Romer1975) and Meltzer and Richard (Reference Meltzer and Richard1981) as the point of departure, much of this research asks, “Does more inequality lead to more redistribution?” Although Kenworthy and Pontusson (Reference Kenworthy and Pontusson2005) and Milanovic (Reference Milanovic2000) show that patterns of within-country variation broadly conform to the core prediction of the Romer-Meltzer-Richard (RMR) model, others point out that the cross-national association between income inequality and redistribution among Organisation of Economic Co-operation and Development (OECD) countries is in fact the opposite of what the canonical model seems to predict: Governments in less egalitarian countries tend to engage in less redistribution (e.g., Alesina and Glaeser Reference Alesina and Glaeser2004, 57–60). Perhaps because of the difficulty of reconciling within- and cross-country evidence, the current consensus seems to be that inequality does not matter for the politics of redistribution, at least not in any direct and particularly significant way. Instead, recent studies emphasize the causal role of a range of other factors: electoral rules (Persson, Roland, and Tabellini Reference Persson, Roland and Tabellini2007; Persson and Tabellini Reference Persson and Tabellini2003), government partisanship (Bradley et al. Reference Bradley, Huber, Moller, Nielsen and Stephens2003; Iversen and Soskice Reference Iversen and Soskice2006), national skill profiles (Iversen Reference Iversen2005; Iversen and Soskice Reference Iversen and Soskice2001), racial and ethnic diversity (Alesina and Glaeser Reference Alesina and Glaeser2004), and religiosity (Scheve and Stasavage Reference Scheve and Stasavage2006).
We build on recent studies that treat racial and ethnic diversity as an obstacle to redistributive politics. The core idea of this literature is that social affinity is a critical determinant of preferences for redistribution; when racial or ethnic minorities comprise a significant proportion of the poor, members of the majority group are less likely to support redistributive policies. We argue that social affinity should be conceived more broadly and that the common circumstances and social networks associated with income are important constitutive elements of social affinity, in addition to racial or ethnic group membership. Inspired by Kristov, Lindert, and McClelland (Reference Kristov, Lindert and McClelland1992), this perspective suggests that what matters to the politics of redistribution is not the level of inequality, but rather the structure of inequality.Footnote 1 Assuming that the support of middle-income voters is critical to the implementation of redistributive policies, our theoretical framework boils down to the following proposition: In the absence of cross-cutting ethnic cleavages, middle-income voters will empathize with the poor and support redistributive policies when the income distance between the middle and the poor is small relative to the income distance between the middle and the affluent—a condition we refer to as skew.Footnote 2
Our empirical analysis provides an initial test of the social affinity hypothesis by estimating several models of redistribution and social spending with data from 15 to 18 OECD countries over the period 1969 to 2005. Controlling for factors that previous studies identify as determinants of redistribution, and using measures of inequality based on gross earnings, we show that redistribution increases with dispersion of the upper half of the earnings distribution and with compression of the lower half of the earnings distribution. We go on to probe the causal mechanisms behind these results in two steps. We first present descriptive survey evidence in support of our claims that (1) redistributive policy outcomes correspond to the policy preferences of middle-income voters, and (2) the structure of inequality helps explain why the preferences of middle-income voters vary across countries and over time. The second step explores the role of government partisanship as an intervening variable, connecting demand for redistribution to redistributive policy outcomes. Our evidence on this score is far from definitive, but it suggests that left-leaning governments are more likely to redistribute income than right-leaning governments and that governments are more likely to be left-leaning when the structure of inequality is skewed.
We agree with Brooks and Manza (Reference Brooks and Manza2007) that public opinion matters more than the comparative welfare state literature has generally recognized (cf. also Kenworthy and McCall Reference Kenworthy and McCall2008). However, our approach differs from theirs in two important respects. First, we focus on the preferences of a particular and, arguably, pivotal segment of the public—middle-income voters. Second, we aspire not only to show that the preferences of middle-income voters matter to policy outcomes, but also to explain why the preferences of middle-income voters vary across countries and over time. Our account of why these preferences vary stands in sharp contrast to the social rivalry hypothesis articulated by Corneo and Grüner (Reference Corneo and Grüner2002) and implicitly embraced by Shayo (Reference Shayo2009).
SOCIAL AFFINITY AND POLITICAL COALITIONS
The model of redistributive politics proposed by Romer (Reference Romer1975) and developed by Meltzer and Richard (Reference Meltzer and Richard1981) does not provide an adequate explanation of variation in the extent of government redistribution across OECD countries. As commonly noted (e.g., McCarty and Pontusson Reference McCarty, Pontusson, Salverda, Nolan and Smeeding2009, 669–72), the limitations of the RMR model may be attributed to its assumptions about either the demand for or supply of redistribution (or both). We focus on the demand for redistribution and propose an alternative way to think about the preferences of the median voter or, less stringently, the preferences of middle-income voters. In so doing, we assume that the preferences of middle-income voters are critical to the politics of redistribution and set aside, for the time being, the question of how these preferences are translated into policy. Our empirical analysis explores the role of partisanship as an intervening variable. However, our core argument, about middle-income preferences, does not depend on staking a strong position in debates about whether parties cater to core constituencies or the median voter.
Like a number of recent political-economy models, most notably Iversen and Soskice (Reference Iversen and Soskice2006), our theoretical framework posits a society consisting of three classes or social groups defined by income: the poor, the middle, and the affluent. As long as no one class constitutes a majority of the electorate, redistributive policy will be set by a coalition of two groups, and such coalitions will almost certainly include the middle-income group. These propositions are, of course, stylized simplifications, but they capture core features of advanced industrial societies and serve the useful purpose of focusing our attention on the question of whether middle-income voters will ally with the poor or the affluent.
In the theoretical model proposed by Iversen and Soskice (Reference Iversen and Soskice2006), the answer to this question depends on the ability of parties to make credible commitments under different electoral rules. Under majoritarian rules, middle-income voters will be inclined to support center-right parties because they fear that center-left parties will revert to the preferences of the left's poor constituency once in government. The interests of middle-income voters are more closely aligned with the first-order preferences of the affluent (no redistribution) than with those of the poor (redistribution from the nonpoor to the poor). However, proportional representation provides for parties that represent the middle-income group alone, making possible the formation of center-left coalition governments committed to redistributing income from the affluent to the benefit of the middle and the poor alike. A crucial feature of the Iversen-Soskice model is that the middle-income group never imposes (redistributive) taxes on itself. In contrast, the model of redistribution that underlies our approach allows for this possibility or, alternatively, for the possibility that the middle-income group will claim a less-than-equal share of the redistributive benefits that the poor and the middle jointly derive from taxing the affluent.
The RMR model's conception of short-term income maximization as the foundation for preferences over redistributive policy is surely too narrow. We can distinguish two broad alternatives to the RMR approach to preferences. One alternative shares the RMR model's emphasis on material self-interest, but posits that individuals calculate the costs and benefits of redistribution with a more extended time horizon, or in a more “enlightened” manner. Insurance against future income losses (Iversen and Soskice Reference Iversen and Soskice2001; Moene and Wallerstein Reference Moene and Wallerstein2001, Reference Moene and Wallerstein2003) or the recognition of negative externalities associated with inequality (Alesina and Giuliano Reference Alesina and Giuliano2009) might motivate affluent individuals to support redistributive policies that do not benefit them immediately. The other alternative holds that other-regarding motivations of an altruistic nature also matter; in other words, individuals are (sometimes) willing to forego some income for the benefit of others. Our core argument builds on this latter approach, which emphasizes that individuals should be viewed not as atomized maximizers of self-interest, however enlightened, but as members of social groups or networks.
The notion of social affinity features prominently in recent studies of how racial and ethnic fractionalization affects demand for redistribution. Luttmer's (Reference Luttmer2001) influential analysis of individual-level support for welfare spending in the U.S. provides strong evidence of what he refers to as racial group loyalty. According to Luttmer's analysis, individuals living in neighborhoods with many welfare recipients are, on average, less supportive of welfare spending. However, proximity to white welfare recipients increases support for welfare spending among white respondents, whereas proximity to black welfare recipients increases support for welfare spending among black respondents. Crucially, Luttmer shows that racial group loyalty is just as strong among high-income respondents as it is among low-income respondents (see also Gilens Reference Gilens2000).
Building on Luttmer's work, Alesina and Glaeser (Reference Alesina and Glaeser2004) demonstrate that social spending correlates with various measures of ethnic, linguistic, and religious fractionalization on a cross-national basis. Although their measures of fractionalization fail to capture this, Alesina and Glaeser's theoretical discussion clearly recognizes that the crucial issue is not fractionalization per se, but rather how racial or ethnic cleavages map onto the income distribution (cf. Selway Reference Selway2011). “Significant numbers of minorities among the poor,” they argue, means that “the majority population can be roused against transferring money to people who are different from themselves” (Alesina and Glaeser Reference Alesina and Glaeser2004, 134).
More recently, Shayo's (Reference Shayo2009) important contribution suggests that the concept of social affinity might be usefully extended to social classes defined by income. Positing that social identities are defined by self-categorization into groups and that there are multiple groups with which any given individual might identify (see Turner et al. Reference Turner, Hogg, Oakes, Reicher and Wetherell1987), Shayo (Reference Shayo2009) argues that individuals choose to identify with one or another group—say, their class or their nation—based on (1) perceived social distance to the prototypical member of each group, and (2) the relative status of the group in question. In our theoretical framework, individuals are enmeshed in social networks that are typically class based, regardless of whether they identify with their class. Members of the middle-income group must decide whether they prefer an alliance with the poor or with the affluent. Like Shayo, we posit that social distance constitutes an important consideration in the choice of alternative coalitions and suppose that income differentials are a reasonably good proxy for social distance, at least in the absence of cross-cutting ethnic or racial cleavages.Footnote 3 It follows from these premises that we should expect middle-income voters to be more inclined to empathize with the poor—and to support parties that advocate pro-poor redistributive policies—when the income distance to the poor is small relative to the income distance to the affluent.
In our conceptualization, social affinity involves altruistic behavior, but it is quite different from generalized altruism. If middle-income voters were motivated by generalized altruism, then their sympathy for the poor would increase with the distance between their income and that of the poor. In contrast, proximity is the source of affinity in our theoretical framework. Social affinity involves what Fowler and Kam (Reference Fowler and Kam2007) refer to as parochial altruism: altruism bounded by perceptions of common group membership or shared experience (see also Goette, Huffman, and Meier Reference Goette, Huffman and Meier2006). Middle-income voters empathize with the poor (or affluent) when they perceive the poor (or affluent) as living lives similar to their own. In particular, we expect middle-income voters to empathize with the poor (or affluent) to the extent that they live in the same neighborhoods, send their children to the same schools, and circulate within the same social networks (McPherson, Smith-Lovin, and Cook Reference McPherson, Smith-Lovin and Cook2001). Having relatives who are poor is also likely to be a source of social affinity with the poor.
Arguably, mobility between income groups is an important component of (or condition for) affinity between income groups. A number of recent cross-national studies indicate that relative income mobility tends to decline with aggregate inequality (Aaberge et al. Reference Aaberge, Björklund, Jänti, Palme, Pedersen, Smith and Wennemo2002; Andrews and Leigh Reference Andrews and Leigh2009; Blanden Reference Blanden2009). The obvious reason is that income gains or losses of a given size translate into larger movements across the income distribution, up or down, when the income distribution is more compressed. The probability of moving between any two positions in the income distribution (say, between the 20th and the 50th percentile) is in part a function of the distance between the two positions. When the distance between the poor and the middle-income group is small, members of the middle-income group face a greater probability of becoming poor (or having children with low incomes), and this will, we hypothesize, reinforce their affinity with the poor. Conversely, prospects of upward mobility will reinforce middle-income affinity with the affluent when the distance between the middle and the affluent is small.
In future work, analyzing individual preferences for redistribution, we hope to disentangle the effects of social affinity and self-interest informed by mobility prospects. However, we do not view social affinity and self-interest as competing explanations of individual preferences for redistribution. Rather, we want to emphasize the potential complementarities of other-regarding and self-interested motivations. Social solidarity may become an operative behavioral norm when individuals have some rational reason to suppose it might serve their own interests over the long run (cf. Converse Reference Converse and Apter1964).
Our argument focuses on middle-income voters, but the underlying logic ought to apply to the poor and the affluent as well. When the distance to the middle is small, the poor should feel more affinity with the middle-income group and demand less redistribution. Similarly, the affluent should feel affinity with the middle-income group, and perhaps be less resistant to redistribution, when the distance between the middle and the affluent is small.
Our social affinity hypothesis stands in sharp contrast to the social rivalry hypothesis articulated by Corneo and Grüner (Reference Corneo and Grüner2002). These authors posit that middle-income voters oppose redistribution because they fear it will enable the poor to gain access to middle-class neighborhoods and social networks, thereby undermining their own relative position in the status hierarchy. By this logic, proximity to the poor should undermine—rather than promote—support for redistribution among middle-income voters.Footnote 4 The status dimension of Shayo's (Reference Shayo2009) theoretical model also points in the direction of social rivalry as an important factor behind individual preferences for redistribution. There is no middle class in the model that Shayo presents, but he briefly discusses such an extension (fn. 17). With respect to the poor, Shayo argues that redistribution improves their status, increasing their propensity to identify with their social class rather than their nation. Adding a middle class to his model, the implication would seem to be that greater proximity to the poor should reduce the value of being middle class, rendering middle-class individuals more likely to identify with the nation and less likely to support redistribution.
In this article, we test the social affinity hypothesis against macro data and relate our core argument to previous macrocomparative studies of the relationship between inequality and redistribution. From a macrocomparative perspective, our key claim is that the combination of relatively small income differences in the lower half of the distribution and relatively large income differences in the upper half provides the most favorable conditions for redistributive politics. Conversely, the combination of relatively large income differences in the lower half of the distribution and relatively small differences in the upper half undermines support for redistribution among pivotal middle-income voters.
Like Kristov, Lindert, and McClelland (Reference Kristov, Lindert and McClelland1992), we estimate models of redistribution with separate measures of income differentials in the two halves of the income distribution. We hypothesize that the 90–50 earnings ratio (i.e., the ratio of earnings in the 90th percentile to earnings in the 50th percentile) will be associated with more redistribution and that the 50–10 earnings ratio (i.e., the ratio of earnings in the 50th percentile to earnings in the 10th percentile) will be associated with less redistribution. Our argument implies that these measures of upper- and lower-half inequality matter jointly to middle-income support for redistribution. Conceiving social affinity with the poor as the inverse of social affinity with the affluent, we imagine that middle-income voters compare income distances in the two halves of the distribution in the process of choosing coalition partners. An increase of the 90–50 ratio will only have the predicted effect of moving middle-income voters toward greater support for redistribution insofar as it is not offset by a corresponding increase of the 50–10 ratio. At the same time, however, 90–50 and 50–10 ratios are closely correlated across countries and over time. To address this problem, we estimate models with a measure of how the two ratios are related to each other: the 90–50 ratio divided by the 50–10 ratio. This measure, which we refer to as skew, rises as dispersion in the upper half of the earnings distribution increases relative to dispersion in the lower half and takes on a value of 1 whenever the 90–50 and 50–10 ratios are the same. We expect skew to be positively associated with redistribution.Footnote 5
Our approach draws on insights from recent research on racial and ethnic group solidarity, and posits that social affinities are also based on income. We do not argue that income is a more important basis of social affinity than ethnicity. In our view, the relative importance of different sources of social affinity is an open empirical question. Relying on the stock of immigrants as the best available proxy for the ethnic concentration of minorities among the poor, our empirical analysis begins to address this question, but our primary objective here is to establish that income-based social affinity matters to the politics of redistribution.
EMPIRICAL SETUP
Our main empirical analysis consists of a series of models of redistribution (measured as the percentage change in Gini coefficients brought about by taxes and government transfers) and social spending (measured in percent of gross domestic product [GDP]). Redistribution is the theoretically relevant variable, but our data on redistribution is limited and entails potential complications. Estimating similar models with social spending as the dependent variable provides an important test of the robustness of our findings. In this section, we introduce the variables included in our models of redistribution and social spending, describe the data used to estimate these models, and specify the models themselves.
Main Variables of Interest
With data from the Luxembourg Income Study (LIS), we measure redistribution as the percentage change in Gini coefficients that we observe as we move from household income before taxes and transfers (gross market income) to household income after taxes and transfers (disposable income).Footnote 6 In keeping with existing studies that use LIS data (e.g., Bradley et al. Reference Bradley, Huber, Moller, Nielsen and Stephens2003; Iversen and Soskice Reference Iversen and Soskice2006), our analysis is restricted to working-age households or, more precisely, households headed by someone between the ages of 25 and 59 years. This is because generous public pension systems reduce the incentive for individuals to accumulate savings. Because many retirees have no market income at all, studies of redistribution that include the retired population yield very high levels of market inequality, in a sense exaggerating the redistributive effects of public spending in countries with generous public pension systems.Footnote 7
Our LIS-based observations of redistribution were generated by Lane Kenworthy, initially for Kenworthy and Pontusson (Reference Kenworthy and Pontusson2005). Kenworthy's updated data set includes at least two observations of inequality measured in terms of both gross market income and disposable income for 16 OECD countries from 1969 to 2005, for a total of 90 country-year observations. For lack of data on earnings inequality, the data set we use to estimate our redistribution models consists of 83 country-year observations drawn from 15 countries (with N = 68 in models that include the lagged dependent variable).Footnote 8
Apart from its small size, two features of this data set are potentially problematic. First, some countries are far better represented than others. With an average of 5.5 observations per country, the data set includes 2 observations each for Belgium and Spain, but 9 observations for the United Kingdom and 10 for Canada. Second, the interval between observations of redistribution for a given country varies considerably. For most observations, the time since the previous observation ranges between 3 and 6 years (the average being 4.5); however, we have nine instances of 1 or 2 years, and, at other end of the spectrum, one instance of 10 years between observations. This feature of the data set raises concerns about our ability to capture true lag effects, as opposed to very noisy average effects.
We address the data limitations of our analysis of redistribution in two ways. Mindful of the potential influence of outliers, we report results based on our full data set, along with results obtained when we drop country-year observations that constitute outliers, with these identified as observations with standardized residuals greater than 1.5 standard deviations away from the mean. We also test the robustness of our redistribution results by analyzing the determinants of social spending. To align the two analyses as closely as possible, the dependent variable in our second set of regression models is public social spending that is not targeted specifically to the elderly (i.e., total public social spending minus spending on pensions and services for the elderly), measured in percent of GDP. The OECD Social Expenditures Database provides the data necessary to compute nonelderly social spending on an annual basis from 1980 onward. For lack of data on earnings inequality, we end up with a data set consisting of 329 country-year observations drawn from 18 countries (with N = 311 in models that include the lagged dependent variable). Across country-years for which we have observations of both redistribution among working-age households and nonelderly social spending, the correlation between the two is 0.86 (N = 73). For the nonelderly population, then, social spending would appear to be a reasonable proxy for redistribution. Corroborating our redistribution results concerning the effects of the structure of inequality, our analysis of social spending should allay concerns about variable lag periods as well as the small size of the redistribution data set.
Our measures of the structure of inequality are based on OECD data on gross earnings of full-time employees. Although there are some concerns about cross-national comparability, many studies have employed these data (e.g., Beramendi and Cusack Reference Beramendi and Cusack2009; Bradley et al. Reference Bradley, Huber, Moller, Nielsen and Stephens2003; Iversen and Soskice Reference Iversen and Soskice2006; Moene and Wallerstein Reference Moene and Wallerstein2003), and the OECD has significantly improved data quality over multiple iterations. We use only the most recent version of the gross earnings data available (OECD 2007).Footnote 9 The advantage of the OECD data, relative to other sources of data on market inequality, is that it provides separate measures of the upper and lower halves of the earnings distribution, while also providing reasonably long time series of annual observations for the countries included in our analysis. Missing data still represent a constraint. Between available observations of earnings inequality, we have linearly interpolated missing observations. We have also extrapolated observations up to 5 years back when doing so allows us to include additional observations of redistribution.Footnote 10
With countries listed from highest to lowest values on nonelderly spending in percent of GDP, Table 1 provides descriptive statistics regarding our dependent variables and our measures of earnings inequality. The second column reports the extent of redistribution in 2000 (or in years as close to 2000 as possible), and the third column provides social spending figures for 2000. In the fourth and fifth columns, we report 90–50 and 50–10 earnings ratios for the same year as the observation of redistribution, and, in the sixth column, we present our measure of skew. It is noteworthy that 5 of the 6 countries with the highest skew in the earnings distribution (Sweden, Denmark, France, Finland, and Germany) are also among the top 6 countries ranked by levels of social spending and that 3 of these countries (Sweden, Denmark, and Finland) stand out, along with Belgium, as the countries with the most redistributive systems of taxes and transfers. At the other end of the spectrum, Switzerland and Canada stand out in Table 1 as the countries in which the lower half of the earnings distribution is more dispersed than the upper half. Along with the United States and Spain, these countries also figure at the bottom rung of the ranking based on the extent of redistribution.
Redistribution, Social Spending, and Structure of Inequality

Note: Values in parentheses are country rankings.
The right-hand panel of Table 1 reports the over-time variation in redistribution, social spending, and skew within the countries in our data set. In 10 of 15 countries, the difference between the minimum and maximum levels of redistribution exceeds 5 percentage points and in four countries the difference exceeds 10 percentage points. The over-time variation in nonelderly social spending is notably less pronounced, but the difference between minimum and maximum levels exceeds 5 percentage points for 9 of 18 countries. Combining temporal variation with cross-sectional variation, Figure 1 indicates that skew and redistribution are quite closely correlated in our data.Footnote 11 Three out of 4 Swiss observations stand out on account of Switzerland's exceptionally low level of redistribution, which does not correspond to a particularly low level of skew.Footnote 12
Redistribution and Skew

To ensure that the estimated effects of skew are not actually effects of overall inequality, we include the 90–10 ratio in all regression models that include skew.Footnote 13 Thus, our analysis also provides a rough test of the core prediction of the RMR model, that demand for redistribution rises with overall inequality. Of course, the RMR model actually pertains to a different measure of inequality—the distance between the mean income and that of the median voter—and it is certainly possible to imagine scenarios in which the 90–10 ratio increases (or declines), whereas median and mean incomes remain constant. Still, studies typically treat the 90–10 ratio as a proxy for the median-mean ratio, and the two ratios are indeed correlated.Footnote 14
Control Variables
In estimating the effects of earnings inequality on redistributive policy outcomes, we seek to control for other variables that have been identified as important determinants of redistribution. Our argument builds on studies that emphasize ethnic fragmentation as an obstacle to redistributive politics and posits that income is an important basis of social affinity in the absence of cross-cutting racial or ethnic cleavages. More specifically, our expectation that narrowing the gap between two income groups will generate greater affinity between them assumes that differences in the racial, ethnic, religious, and linguistic composition of the two groups remain constant.
From a theoretical point of view, it is important for us to control for the distribution of ethnic minorities across the income distribution, but here we run into serious problems of data and measurement. Most available indices of ethnolinguistic and religious fractionalization (e.g., Alesina et al. Reference Alesina, Devleeschauwer, Easterly, Kurlat and Wacziarg2003) are not only time invariant, but also fail to capture the extent to which minorities are concentrated among the poor (or perhaps, in a postcolonial setting, concentrated among the affluent). Recent articles by Baldwin and Huber (Reference Baldwin and Huber2010) and Selway (Reference Selway2011) represent important advances in this domain. Yet, both Baldwin and Huber's measure of between-group inequality and Selway's index of the “cross-cuttingness” of income and ethnic group membership remain time invariant, and several of the countries in our analysis are missing from their data.
In the absence of a better measure, we include a time-varying measure of the stock of immigrants in some of our empirical models of redistribution and social spending. Based on data collected by Rafaela Dancygier, this variable refers to the percentage of the population that is foreign-born for Australia, Canada, and the United States, and the percentage of the population who are noncitizens for the other countries in our data set. Following Alesina and Glaeser's (Reference Alesina and Glaeser2004, 175–77) discussion of immigration as a threat to European welfare states, the assumption here is that immigrants are overrepresented at the lower end of the income distribution. Data from the European Social Surveys (ESSs) provide some support for this assumption. Averaging across the four surveys conducted between 2002 and 2008, we observe that the percentage of foreign-born among the poor, defined as the bottom third of the income distribution of respondents, exceeds the percentage of foreign-born among the nonpoor in all but 2 of the 13 European countries in our data (Italy and the United Kingdom). However, the extent to which immigrants are overrepresented among the poor varies a great deal across these countries, and this variation does not appear to be correlated with levels of immigration.
It is undoubtedly the case that some immigrants are high-income earners and that others manage to move up the income distribution over time. Quite plausibly, the immigrant populations of Australia, Canada, and the United States are particularly heterogeneous from a socioeconomic point of view. Moreover, as a proxy for the concentration of ethnic minorities among the poor, this variable completely misses the presence of native minorities among the poor, a prominent feature of American exceptionalism in the domain of social policy and redistributive politics (Alesina and Glaeser Reference Alesina and Glaeser2004; Gilens Reference Gilens2000). At best, then, immigration represents a rough proxy for the concentration of minorities among the poor. In addition, the availability of data on immigration significantly reduces the number of country-year observations we can use to estimate our models. For both reasons, we begin by presenting our results without immigration, and then add this variable.
An important recent focus in research on the political economy of redistribution is why countries with proportional representation (PR) tend to have more redistributive governments than countries with majoritarian electoral rules. Although Persson and Tabellini (Reference Persson and Tabellini2000, Reference Persson and Tabellini2003) argue that electoral rules affect the type of spending incumbent politicians choose, Persson, Roland, and Tabellini (Reference Persson, Roland and Tabellini2007) propose a model in which the effect of PR on government spending hinges on the greater probability of a coalition government under PR rules. Iversen and Soskice's (Reference Iversen and Rosenbluth2006) alternative theory proceeds from the observation that since 1945 government participation by left parties has been much more common in PR countries than in majoritarian countries. For Iversen and Soskice, the redistributive effects of electoral rules operate through government partisanship, and the effect of electoral rules should be mediated entirely by government partisanship. In due course, we will introduce government partisanship into our analysis, but we leave this variable out for the time being on account of endogeneity concerns. To control for the electoral systems effect, we include Gallagher's (Reference Gallagher1991) measure of proportionality. This index ranges from 0 (pure proportionality between vote and seat shares) to infinity as disproportionality increases.Footnote 15 For ease of interpretation, we standardize the Gallagher index to vary between 0 and 1, and invert it so that larger values represent greater proportionality.
The varieties-of-capitalism literature implies that we need to control for national skill profiles. Iversen and Soskice (Reference Iversen and Soskice2001) argue that individuals with more specific skills are more likely to support social spending and show that vocational training share (VTS), measured by the share of an age cohort engaged in secondary and tertiary vocational training, is correlated with government spending on income transfers on a cross-national basis. In addition, Estevez-Abe, Iversen, and Soskice (Reference Estevez-Abe, Iversen, Soskice, Hall and Soskice2001, 169–78) show that VTS is associated with compression of earnings differentials on a cross-national basis, and Iversen (Reference Iversen2005, 148–54) reports a strong positive effect of VTS on redistribution among working-age households. In short, skill specificity could be the source of any positive association between compression of the lower half of the earnings distribution and redistribution that we observe.
Iversen and his collaborators use VTS data from 1980 to 1995. One of the two components of Iversen's VTS index—graduates of tertiary vocational programs as a percent of the tertiary age cohort—cannot be updated because the United Nations Educational, Scientific and Cultural Organization (UNESCO) no longer publishes the requisite data. However, it is possible to construct continuous and consistent time series on the percentage of secondary school students enrolled in vocational programs for the 15 countries in our analysis from 1980 to 2005.Footnote 16 This will serve as our measure of vocational training intensity in the analysis that follows. Aside from data availability, it is arguably a better measure than Iversen's in that it sidesteps the complicated question of the kinds of skills acquired through tertiary vocational training programs (see Culpepper Reference Culpepper2007). It is certainly an appropriate control variable for our purposes, given that our primary concern here is to ensure that national skill profiles do not confound the relationship between 50–10 earnings ratios and redistribution.
Unionization represents another potential source of spurious associations between bottom-end earnings compression and redistribution. Unions do not typically organize workers at the very bottom of the earnings distribution, but they do have a strong interest in setting a floor for competition in the labor market, and unionization tends to be associated with more compressed 50–10 ratios (see, e.g., Pontusson, Rueda, and Way Reference Pontusson, Rueda and Way2002). Controlling for income and other relevant demographics, moreover, union members are more likely to vote and to support redistribution than nonunion members (Pontusson and Kwon Reference Pontusson and Kwon2006). Thus, we need to control for the effects of union density in order to test our hypothesis that bottom-end compression alters the preferences of middle-income voters.
Like many previous studies, we conceive voter turnout as an inverse proxy for income bias in voting (see Mahler Reference Mahler2008 for supporting evidence). With higher turnout, poor citizens are more politically active relative to affluent citizens and, presumably, better represented by elected politicians. Hence, we expect turnout to be associated with more redistribution.
More readily than any other variable, the unemployment rate serves to control for changes in the share of the working-age population that is eligible for redistributive social transfers. As long as unemployment insurance coverage and generosity remain unchanged, an increase in unemployment translates more or less automatically into greater redistribution (cf. Kenworthy and Pontusson Reference Kenworthy and Pontusson2005). We also control for female participation in the labor force because women are more likely to be part-time workers than men and therefore tend to have lower hourly wages. As the OECD data on relative earnings pertain to full-time employees, female labor force participation may pick up effects of inequality—particularly low-end inequality—that are not captured by our measures of earnings inequality. Following Iversen and Rosenbluth (Reference Iversen and Rosenbluth2006), among others, we expect female labor force participation to be associated with more political support for redistributive social policies.
Working with a significantly larger data set, we include three additional control variables in our models of social spending. First, these models take account of the fact that the dependent variable (nonelderly social spending) is expressed in percent of GDP by including GDP growth on the right-hand side of the regression equation. When the GDP denominator contracts, social spending automatically expands, but this does not mean that social policy has become more generous or redistributive.Footnote 17 Our spending models also include the percentage of the population older than 64. As a result of budget constraints, governments are likely to face a trade-off between spending on the elderly and nonelderly. All else equal, we expect population aging to constrict the available room for nonelderly social spending to grow. Finally, the social spending models include a composite measure of (economic) globalization developed by Dreher (Reference Dreher2006). Based on principal component analysis, Dreher's index includes capital mobility and trade, measuring both legal barriers and actual financial and trade flows. The effect of globalization has featured prominently in studies of social spending (e.g., Garrett Reference Garrett1998; Swank Reference Swank2002), with some scholars arguing that greater economic openness decreases spending by disciplining governments and others that openness increases government demands for compensatory social spending. Although we have no particular theoretical priors with regard to this debate, it seems clear that our models of social spending should control for the effects of globalization.
Model Specifications
For each country i and year t, our statistical models of redistribution treat the level of redistribution (Ri,t) as a function of previous levels (Ri,t − 1) and a set of policies and structural factors (Pi,t) that cause redistribution to deviate from the status quo. Because data on redistribution are unequally spaced, whereas values for the independent variables are annual, we follow Persson, Roland, and Tabellini (Reference Persson, Roland and Tabellini2007) in using a time-series, cross-section model in which independent variables are averaged across the period since the previous observation of redistribution.Footnote 18 Thus, if two observations of redistribution are 5 years apart (t and t − 5), then each independent variable is the average value for the 5 intervening years (t − 5 through t − 1). Our models also include the lagged dependent variable to account for the status quo level of redistribution and address potential problems raised by serial correlation (Beck and Katz Reference Beck and Katz1996, Reference Beck and Katz2004).Footnote 19 Using this notation, our basic model specification can be written as

where S is the number of years between each observation of redistribution. The models we estimate thus use the complete time series of annual data, even though observations of the dependent variable are not available annually. Following Beck and Katz (Reference Beck and Katz1995), we estimate these models with panel-corrected standard errors.Footnote 20
Ideally, our analysis should include country fixed effects to account for unit heterogeneity and its potential correlation with our variables of interest. Given the number of observations per country in our data set, however, we cannot simultaneously include both the lagged dependent variable and country fixed effects (Nickell Reference Nickell1981). We are also hampered by the fact that some of the control variables in our model are slow moving. Following Milanovic (Reference Milanovic2000), we therefore specify a set of fixed effects models in which we include only measures of earnings inequality. These restricted models provide the most reasonable test of the effect of the structure of inequality on within-country variation in levels of redistribution.Footnote 21
We turn to models of nonelderly social spending in an effort to corroborate our redistribution results. Because we have a complete, annual series of social spending, variable lag periods no longer present a problem. We could simply employ 1-year lags of our independent variables, but it seems unreasonable to suppose that the effects of earnings inequality and other independent variables would be so immediate. To capture more slow-moving causal processes and to approximate the specification of our redistribution models, our models instead measure all independent variables as 5-year moving averages (the observation for each year being the average for the preceding 5). Again, we report the results of estimating fixed-effects and random-effects specifications of the social spending models.Footnote 22 Despite having a larger data set for social spending, the limitations of our earnings inequality data mean that we end up including fewer than 10 observations for a handful of countries (Ireland, Italy, New Zealand, Norway, Spain, and Switzerland). As with redistribution, this renders the estimation of fully specified fixed-effects models problematic. Thus, our fixed-effects models are again restricted to measures of earnings inequality, although in this case we continue to include GDP growth to address the denominator problem.
MAIN EMPIRICAL RESULTS
Table 2 presents our first set of results, with redistribution as the dependent variable. In models 1 to 4, we estimate the effects of 90–50 and 50–10 earnings ratios separately. Models 1 and 2 are random-effects models with control variables, whereas models 3 and 4 are fixed-effects models that include the two earnings ratios in addition to a full set of country dummies.Footnote 23 Model 2 replicates model 1 but drops outliers—country-year observations with standardized residuals greater than 1.5 standard deviations away from the mean. Similarly, model 4 replicates model 3 without outliers.
Determinants of Redistribution

***p < 0.01; **p < 0.05; *p < 0.1.
As predicted by our theory, models 1 to 4 show that greater dispersion in the lower half of the earnings distribution is consistently associated with less redistribution. In model 1, the sign of the coefficient for the 90–50 ratio is positive, as expected, but the size of the coefficient is not much bigger than the standard error. However, the estimated coefficient increases, and the precision of the estimate improves notably when we exclude 10 outliers. In the fixed-effects specifications, the positive effect of upper-half dispersion on redistribution is estimated more precisely than the negative effect of lower-half dispersion.
As noted previously, 90–50 and 50–10 ratios are closely correlated in our data (r = 0.71). Combining the 90–50 and 50–10 ratio into a single measure of skew eliminates the problem of multicollinearity and also allows us to control for the level of overall earnings inequality by including the 90–10 ratio in the analysis. Table 2 also reports the results of estimating 4 models with this specification. Consistent with our expectations, models 5 to 8 indicate that skew is significantly associated with more redistribution. The fixed-effects models strongly suggest that our theory of how the structure of inequality matters to the politics of redistribution is relevant for explaining not only cross-national variation, but also within-country temporal variation in redistribution.
At the same time, overall earnings inequality, as measured by the 90–10 ratio, is not associated with redistribution in any of the models in Table 2. It deserves to be noted that when we estimate models with the 90–10 ratio as the only measure of earnings inequality, this variable remains insignificant. Although skew is correlated with the 90–10 ratio, it does not appear to proxy for the 90–10 ratio in our analysis. Regarding the 90–10 ratio, our results are consistent with previous studies, calling into question the RMR model's prediction of a positive association between the level of inequality and redistribution.Footnote 24
Turning to the control variables in these models, our results support the proposition that higher voter turnout is associated with more redistribution. Consistent with prior expectations, we also find that union density and, to a lesser extent, female labor force participation are associated with redistribution. However, the results presented in Table 2 provide no support for the commonly held view that more proportional electoral rules promote more redistributive politics. (In all but one of these models, the sign of the coefficient for proportionality is actually negative.) Although the coefficients have the expected signs, the percentage of secondary school students engaged in vocational training and the rate of unemployment also turn out to be insignificant.
Table 3 presents our results with nonelderly social spending as the dependent variable. Paralleling models 1 to 4, models 9 to 12 estimate the effects of the 90–50 and the 50–10 ratios separately with random and fixed effects, with and without outliers. Akin to models 4 to 8, models 13 to 16 instead estimate the effect of skew while controlling for overall earnings inequality.
Determinants of Social Spending

GDP, gross domestic product.
***p < 0.01; **p < 0.05; *p < 0.1.
The results in Table 3 strongly corroborate our argument and previous findings concerning the political effects of the structure of inequality. The negative coefficient for the 50–10 ratio falls short of statistical significance in model 9, but becomes significant once we drop 33 outliers (slightly more than 10% of the total sample), as well as in the fixed-effects specifications. The sign of the coefficient for the 90–50 ratio is the opposite and always statistically significant. Similarly, skew is strongly associated with higher levels of nonelderly social spending across these models.
In contrast to Table 2, the results in Table 3 offer some indication that higher levels of earnings inequality may be associated with higher levels of nonelderly social spending. Regarding the other control variables, GDP growth has a strong negative effect on social spending, just as we would expect, as does the percentage of the population that is elderly. The latter finding corroborates the idea that governments face a trade-off between spending on the elderly and the nonelderly. In contrast to Table 2, we do not observe an association between either voter turnout or female labor force participation and nonelderly spending, but unionization retains a consistently significant, positive coefficient. Consistent with Iversen's (Reference Iversen2005) argument about specific skills and demand for social insurance, vocational training also turns out to be a significant variable in these models. Our assessment of the effects of globalization depends crucially on whether we look at models with or without outliers: Without outliers, globalization appears to be associated with higher levels of nonelderly social spending.
Two results in Table 3 appear counterintuitive: Unemployment and proportionality of electoral rules both turn out to be consistently associated with less nonelderly social spending. Although increased unemployment is bound to be associated with increased social spending (and redistribution) in the short run, Huber and Stephens (Reference Huber and Stephens2001) argue convincingly that persistently high unemployment gives rise to political conditions favorable to spending cuts: On one hand, unemployment generates budgetary pressure, and, on the other hand, it undermines political participation by those who benefit most from nonelderly social spending. Regarding the negative association between proportionality and nonelderly social spending, it is important to keep in mind that models 9, 10, 13, and 14 include the lagged dependent variable and thus control for initial levels of nonelderly social spending. Dropping the lagged dependent variable, the negative coefficient for proportionality is no longer significant. On average, countries with more proportional electoral systems may well engage in more social spending: What our results indicate is that they have experienced larger spending cuts or less rapid spending growth than countries with less proportional systems from 1980 to 2004. Even more so than the null findings presented in Table 2, these results call into question Iversen and Soskice's (Reference Iversen and Rosenbluth2006) emphasis on credible commitments made possible by PR as the key to the politics of redistribution.
Table 4 shows our results when we add immigration to models 5 and 13, again with and without outliers. As indicated previously, immigration is at best a rough proxy for racial/ethnic differences—and hence social distance—between the poor and the middle, yet we want to make sure that our findings concerning the political effects of the structure of earnings inequality hold up when we control for immigration. After all, it could be that immigration has generated dispersion of the bottom half of the earnings distribution by increasing the supply of unskilled labor and that the positive association between skew and redistribution is entirely attributable to the fact that ethnic differences between the poor and the middle have grown. The results presented in Table 4 suggest that this is not the case. With redistribution as the dependent variable, the coefficient for immigration is negative and borderline significant with the full data set (now reduced to 60 observations). Dropping outliers, the negative association between immigration and redistribution becomes statistically significant. Contrary to our expectations, we do not observe any association between immigration and nonelderly social spending. For our purposes, the important thing is that the effects of skew are robust to the inclusion of the immigration variable. The coefficients for skew are only marginally smaller in models 17 and 18 than in models 5 and 6 and, as predicted by our theory, are substantially larger in models 19 and 20 than in models 13 and 14.
Determinants of Redistribution and Social Spending, with Immigration

Note: Models include full set of control variables.
***p < 0.01; **p < 0.05; *p < 0.1.
Based on model 5 (the random-effects specification with the maximum number of observations of redistribution), the following simulations illustrate the substantive significance of our findings concerning the effects of the structure of inequality. While holding the 90–50 ratio constant, reducing the 50–10 ratio by 1 standard deviation (i.e., compressing the lower half of the earnings distribution) increases skew by 0.18. Holding all other variables constant, this in turn increases redistribution by 1.80 according to our results. Conversely, holding the 50–10 ratio constant and reducing the 90–50 ratio by 1 standard deviation (i.e., compressing the upper half) decreases skew by 0.12. Holding all other variables constant, this translates into a reduction of redistribution by 1.20. Keeping in mind that the mean level of redistribution in our data set is 25.27, the effects identified by our analysis must surely be considered substantively significant.
In sum, we find robust evidence, with different dependent variables and a host of model specifications, that the structure of inequality is significantly associated with redistribution in both statistical and substantive terms. Redistribution increases with dispersion of the upper half of the earnings distribution and with compression of the lower half of the earnings distribution.
CAUSAL MECHANISMS
The results presented in Tables 2 to 4 are consistent with our theory of how the structure of inequality influences the politics of redistribution, but they do not demonstrate that the preferences of middle-income voters are the crucial intervening variable in the relationship between inequality and redistribution. These results also do not address the question of how the preferences of middle-income voters translate into policy outcomes. In the remainder of the article, we begin to address these questions.
Middle-income Preferences
From 1985 to 2004, eight International Social Survey Programme (ISSP) surveys and two rounds of the ESS asked respondents whether they agreed with the statement that “it is the responsibility of the government to reduce the differences in income between people with high incomes and those with low incomes” and provided respondents with the following five response options: “strongly agree,” “agree,” “neither agree nor disagree,” “disagree,” and “strongly disagree.” With the frequency of surveys varying considerably by country, we have assembled a data set with 90 country-year observations of responses to this survey item drawn from the 18 OECD countries included in our analyses of nonelderly social spending.
In keeping with our theoretical framework, the data presented in Figures 2 and 3 are restricted to survey respondents in the middle third of the distribution of household income (based on self-reported income).Footnote 25 We measure support for redistribution as the percentage of middle-income respondents who either “strongly agree” or “agree” with the statement that it is the responsibility of the government to reduce income differences.Footnote 26 From the point of view of our theory, there are two separate questions to be asked of the survey data. First, do the preferences of middle-income voters matter to the redistributive policies pursued by governments? Second, does the structure of inequality shape the policy preferences of middle-income voters? Figure 2 addresses the first question. To generate Figure 2, we linearly interpolated our LIS-based observations of redistribution to match 64 survey-based observations of middle-income preferences for redistribution.
Public Opinion and Redistribution

Public Opinion and Skew

Overall, the relationship between middle-income preferences and redistributive policy outputs is reasonably strong (r = 0.43) and consistent with our expectations.Footnote 27 The 3 Swiss observations and 1 Spanish observation in this data set stand out on account of the exceptionally low level of redistribution in these countries. Setting the Swiss observation for 1987 aside, these cases are distinguished less by the lack of public support for redistribution than by a distinctive disconnect between public opinion and policy outputs. To the extent that it considers the Swiss case, the comparative welfare state literature identifies multiple veto points associated with decentralized federalism and popular referenda as the reason Switzerland has a less redistributive welfare state than other continental European countries (cf. Immergut Reference Immergut, Steinmo, Thelen and Longstreth1992; see also fn. 12 herein). Arguably, decentralization helps explain Spanish exceptionalism as well, although it does not appear to be the case that policy outcomes are disconnected from middle-income preferences in all federal states.
Figure 3 addresses the consequences of the structure of inequality for the preferences of middle-income voters. Previously on the horizontal axis, support for redistribution among middle-income survey respondents appears on the vertical axis of Figure 3, plotted against our measure of earnings skew. Although the fit is far from perfect, there is clearly a positive association between skew and middle-income support for redistribution in Figure 3 (r = 0.45). It is noteworthy that all but 1 of the U.S. observations in this data set are clustered at the bottom of the vertical axis and the middle of the horizontal axis. While Switzerland and Spain are characterized by a disconnect between middle-income preferences and policy outcomes, the U.S. is characterized by a disconnect between earnings skew and middle-income preferences. American middle-income voters are less supportive of redistribution than the structure of inequality would lead us to expect. Thus conceived, American exceptionalism poses less of a challenge to our theoretical framework than Swiss or Spanish exceptionalism because it is clearly attributable to the high concentration of racial-ethnic minorities in the bottom of the income distribution (cf. Alesina and Glaeser Reference Alesina and Glaeser2004; Gilens Reference Gilens2000). Our theoretical framework explicitly recognizes ethnic differences as an obstacle to affinity with the poor among members of the middle-income group.
We would ideally add middle-income support for redistribution into the regression models presented in the preceding section. Our theory predicts that this variable should be strongly associated with redistribution and that its inclusion should eliminate the effects of skewed earnings inequality (and perhaps the effects of immigration as well). Unfortunately, our survey-based data set on preferences for redistribution and our LIS-based data set on redistributive outcomes do not match up well. Although more than one third of our observations of redistribution predate 1990, the vast majority of survey observations postdate 1990. By interpolating missing observations of redistribution, we can match the survey data, as in Figure 2, but generating matching survey data for our observations of redistribution would require us to engage in very extensive backward extrapolation.Footnote 28 Given that support for redistribution in many countries varies a good deal from one survey to the next, this is a very dubious proposition. For the time being, Figures 2 and 3 must suffice as suggestive evidence that the preferences of middle-income voters represent an important link in the causal chain from the structure of inequality to redistributive policy outcomes.
Government Partisanship
How do the preferences of middle-income voters translate into policy outcomes? Median voter theory and partisan theory provide two different answers to this question. Median voter models such as the RMR model posit that all major parties are fundamentally office seeking and therefore converge on the preferences of the median voter. In contrast, partisan theory holds that parties have core constituencies with distinctive distributive interests and that government partisanship matters to policy choice. Building on comparative political-economy research informed by partisan theory (e.g., Bradley et al. Reference Bradley, Huber, Moller, Nielsen and Stephens2003; Garrett Reference Garrett1998), we might hypothesize that the preferences of middle-income voters influence policy choice by determining the outcome of electoral contests between parties with different policy platforms. Akin to Iversen and Soskice's (Reference Iversen and Rosenbluth2006) argument about the effects of electoral rules, this hypothesis implies that we should observe more left-leaning government where and when the structure of inequality is skewed (i.e., when the income distance between the middle and the affluent is greater than the income distance between the middle and the poor).
Table 5 presents the results of estimating a series of models with government partisanship as the dependent variable, using data from 1980 to 2004 for the 18 countries included in our previous analyses. The measure of government partisanship used here is Cusack's “cabinet center of gravity” index. Standardized to vary between 0 and 1, with higher values representing more right-leaning governments, this index relies on the average of three expert surveys to classify parties on the left–right scale and weights party scores by the share of cabinet portfolios held by different parties (Cusack and Engelhardt 2003). Models 21 to 23 pool country-year observations. As in our previous analyses of redistribution and social spending, the independent variables are measured as the average for the 5 years preceding each observation of government partisanship. Concerned about serial correlation, we also report the results of estimating cross-section versions of these models, with variables averaged by country from 1980 to 2004 (models 24–26).
Determinants of Government Partisanship

***p < 0.01; **p < 0.05; *p < 0.1.
The baseline model for the results presented in Table 5 includes 3 independent variables: skew, proportionality of the electoral system, and voter turnout. We include proportionality to take account of Iversen and Soskice's (Reference Iversen and Rosenbluth2006) claim that PR favors left parties and voter turnout to capture the potential role of electoral mobilization of low-income citizens in boosting electoral support for left parties and, by the extension, their participation in government. In models 22 and 25, we add the Dreher measure of globalization because globalization should favor left parties to the extent that it is a source of economic insecurity. Finally, we add immigration in models 23 and 26 on the grounds that “immigration backlash” might lead some traditional left voters to shift their support to populist antiimmigrant parties.
The exploratory nature of the exercise reported in Table 5 should be underscored. As indicated by rather low R 2 values, these models of government partisanship are clearly preliminary. With that in mind, it is noteworthy that skew is consistently associated with left participation in government. Globalization turns out to be the only other variable consistently associated with left government. Controlling for skew, and using Gallagher's continuous measure of proportionality, we do not observe the association between proportionality and left government that we expected based on Iversen and Soskice's (Reference Iversen and Rosenbluth2006) analysis.Footnote 29
In turn, Table 6 reports the results of rerunning some of our models of redistribution and nonelderly social spending with the addition of government partisanship. Redistribution is the dependent variable in models 27 and 28, whereas social spending is the dependent variable in models 29 and 30. All four models include the full battery of control variables, including immigration. Models 28 and 30 replicate models 27 and 29, respectively, excluding outliers.
Determinants of Redistribution and Social Spending, with Government Partisanship

Note: Models include full set of control variables.
***p < 0.01; **p < 0.05; *p < 0.1.
With redistribution as the dependent variable, we do not observe any significant partisan effects. In models 27 and 28, the coefficient for government partisanship is less than half the standard error. However, we do observe the expected partisan effect with nonelderly social spending as the dependent variable. The negative coefficient for government partisanship fails to clear statistical significance with the full sample, but does so once we drop some 24 outliers (roughly 10% of the full sample). With redistribution as the dependent variable, introducing government partisanship into our models does not noticeably alter the estimated effects of skew. In the social spending models, adding government partisanship serves to attenuate the effects of skew somewhat, but the coefficients for skew remain sizeable and statistically significant. The results for overall earnings inequality remain consistent with our previous models.
In sum, there is some evidence that skewed earnings inequality promotes left participation in government. We also have some evidence that left participation in government is associated with the pursuit of redistributive policies; however, this evidence is quite tenuous. Further theoretical and empirical work is necessary to clarify the role of partisan politics in the relationship between the structure of inequality and redistributive policy outcomes. Still, the preliminary results presented in Table 6 strongly indicate that the structure of inequality does not affect redistributive politics simply by increasing electoral support for and enhancing the government role of left parties. It appears that all governments, irrespective of left participation, tend to pursue more redistributive policies when the structure of inequality favors a coalition between middle-income voters and the poor.
CONCLUSION
Comparative studies of the political economy of redistribution have largely overlooked the effects of the structure of inequality. We posit that compression of income differentials increases social affinities between individuals occupying different positions in the income distribution. Our macrocomparative analysis provides robust evidence in support of the core hypotheses generated by this theory. Government policy tends to become more redistributive as earnings in the upper half of the distribution are more dispersed and less redistributive as earnings in the lower half are more dispersed.Footnote 30
In addition, our analysis suggests that left parties are more likely to participate in government when the structure of earnings inequality is more skewed. Government partisanship is arguably an important mechanism through which the structure of inequality affects redistributive policy outcomes, but the effects of the structure of inequality persist when we control for partisanship. One hypothesis to be explored in future work is that center-right parties adjust strategically to the advantages that center-left parties enjoy when the structure of inequality is skewed, pursuing more redistributive policies.
Some of our results indicate that immigration is associated with less redistribution, but our evidence on this score is less robust than previous studies lead us to expect (e.g., Alesina and Glaeser Reference Alesina and Glaeser2004, 175–77). It is important to keep in mind that our measure of immigration does not directly capture the concentration of minorities among the poor. We do not want to contest the emphasis on racial and ethnic divisions in recent studies of the politics of redistribution, but we do want to amend the thrust of this literature by insisting that racial and ethnic divisions matter to the extent that they map onto the distribution of income. Thus conceived, race and ethnicity are an integral part of the structure of inequality.
Our theoretical discussion focuses on how the structure of inequality shapes the coalitional proclivities and policy preferences of middle-income voters, but the claim that proximity matters to social affinity should apply to all voters. Although we do not believe that governments are exclusively responsive to the policy preferences of middle-income voters, it seems reasonable to suppose that middle-income voters play a pivotal role in coalitional politics. Moreover, we expect that the redistributive policy preferences of middle-income voters are more variable, across countries and over time, than those of the poor or the affluent. This is a proposition that can and should be empirically verified. Our preliminary analysis of survey data suggests that the structure of inequality shapes the preferences of middle-income voters and that these preferences in turn impact government policy. Further analysis of individual preferences constitutes an obvious next step that we intend to pursue.
Quite legitimately, macrocomparative analyses of the type presented here invite questions about endogeneity. Our theoretical and empirical discussion treats the structure of inequality as an exogenous variable that causes changes in redistribution, but is it not equally plausible to treat redistribution as a cause of the structure of inequality? Specifically, redistributive government policies might promote compression of the 50–10 earnings ratio by setting a floor for competition in the labor market (i.e., by providing citizens with a “social wage” that employers must exceed in order to attract workers). Mindful of this concern, we emphasize that our measures of the structure of earnings inequality (as well as our other independent variables) temporally precede our measures of the dependent variables, that our statistical models include a lagged dependent variable, and that our main findings hold up with fixed-effects specifications that focus on within-country variation. It should also be noted that there is no obvious reason to suppose that redistributive government policies cause dispersion of the upper half of the earnings distribution: To the contrary, Hibbs (Reference Hibbs1987) argues that high marginal tax rates serve to compress market wages in the upper half of the distribution by reducing the net gains associated with any given wage increase. In short, we do not believe that endogeneity represents a serious challenge to our interpretation of the relationship between earnings skew and redistribution.
What, then, explains cross-national and temporal variation in the structure of inequality? From a comparative perspective, labor-market institutions provide the most obvious point of departure for addressing this question. According to Pontusson, Rueda, and Way (Reference Pontusson, Rueda and Way2002), unionization and bargaining centralization are associated with more compressed 90–50 and 50–10 earnings ratios, but the effect of these institutional variables on the 50–10 ratio is about three times as large as their effect on the 90–50 ratio. Even operating within highly centralized bargaining systems, solidaristic unions appear to have been far better at instilling their distributive preferences among workers in the lower half of the earnings distribution than among those in the upper half of the distribution. The reasons have to do partly with the distribution of union members across the earnings distribution and partly with the willingness of employers to accommodate union preferences.
Technology constitutes another potential source of variation in the structure of earnings inequality. Autor, Katz, and Kearney (Reference Autor, Katz and Kearney2006) show that the U.S. labor market became more polarized as a result of the introduction of new information and communication technologies. In their account, these new technologies render high-skilled workers more valuable, while allowing employers to shed workers performing semiskilled routine tasks without affecting the demand for or productivity of workers performing low-skill nonroutine tasks. As a result, wage differentials between high-skilled and semiskilled workers continued to increase, whereas the differentials between semiskilled and unskilled workers remained constant or even declined from 1990 to 2004. As Piketty and Saez (Reference Piketty and Saez2003) suggest, the rapid growth of corporate compensation, linked to the dynamics of equity markets, constitutes yet another possible factor behind changes in the structure of earnings inequality over the past two decades.
According to our data on earnings among full-time employees, earnings skew in the U.S. rose from 0.99 in 1986 to 1.12 in 2001. The U.S. case poses something of a puzzle for our theory, which predicts that increased skew in the distribution of income increases political pressure for redistribution. The concentration of racial minorities at the bottom of the income distribution is one potential obstacle to the formation of a redistributive coalition of poor and middle-income voters in the U.S. Yet, there is little reason to believe that during this period the overlap of race and income became more pronounced or that racism became more widespread. One could perhaps interpret the election of Barack Obama as a political manifestation of long-term changes in the structure of inequality. How long it takes for changes in the structure of inequality to affect redistributive policy is an important question to which we do not yet have a satisfactory answer.
A number of countries have experienced larger increases of earnings skew than the U.S. since 1990. In several of these countries—notably, Australia, France, Ireland, and Switzerland—government policy appears to have become more redistributive relative to countries in which earnings skew has remained stable. The German case is noteworthy as the only case in which we observe a clear trend reversal during the time period covered by our earnings data. According to the OECD, earnings skew in Germany increased from 1.00 in 1984 to 1.15 in 1995 and then fell back to 1.01 by 2004. Arguably, the increase of skew from 1984 to 1995 contributed to the leftward shift of German politics that culminated in the Social Democratic Party (SPD)-Green coalition government of 1998, whereas the subsequent decline of skew contributed to the rightward shift that culminated in the Christian Democratic Union (CDU)-Free Democratic Party (FDP) coalition government of 2009. Considering our previous discussion of partisan effects, it is particularly important to note that the policy priorities of both major German parties shifted in favor of redistribution in the 1990s and against redistribution in the first decade of the twenty-first century.
Following Lindert (Reference Lindert2004, 15–16), it has become commonplace to speak of a Robin Hood paradox. At least among advanced democracies, government redistribution through taxes and transfers appears to be associated with less, rather than more, market inequality. Several prominent contributions resolve this paradox by treating redistribution as a by-product of social insurance. In Moene and Wallerstein's (Reference Moene and Wallerstein2001) formulation, demand for insurance rises with income (holding risk exposure constant) and a mean-preserving decline of inequality means that the income of the median voter is higher (cf. Bénabou Reference Bénabou2000; Iversen and Soskice Reference Iversen and Soskice2001). This solution to the Robin Hood paradox is problematic for two reasons. Private insurance represents an obvious alternative to social insurance for high-income individuals. Moreover, previous research has shown that it is quite possible to organize social insurance schemes in ways that preserve the market distribution of income.
Our core argument suggests a different solution to the Robin Hood paradox. The key is the observation that countries with less market inequality also tend to be characterized by a more skewed structure of market inequality during the period we examine. Income equalization during the postwar era primarily occurred through labor-market dynamics associated with the expansion of Fordist mass production, full employment, and centralized wage bargaining. This equalization involved considerably greater compression of the lower half than the upper half of the earnings distribution, generating a more skewed earnings distribution and thus setting the stage for a more redistributive policy orientation. At the foundation of the modern welfare states in the 1930s and 1940s, insurance was the primary motivation, and the redistributive impact of new social policies was limited. From the second half of the 1960s through the first half of the 1980s, we observe a new phase of welfare state expansion, involving not only the introduction of new types of social spending, but also reforms that rendered existing social insurance schemes more redistributive by raising minimum benefits and capping maximum benefits.Footnote 31 Consistent with the main themes of the comparative welfare state literature, this historical reinterpretation is worthy of further exploration.
APPENDIX: DEFINITIONS AND VARIABLES AND SOURCES

ESS, European Social Survey; FDI, foreign direct investment; GDP, gross domestic product; ISSP, International Social Survey Programme; OECD, Organisation for Economic Co-operation and Development; UNESCO, United Nations Educational, Scientific and Cultural Organization.
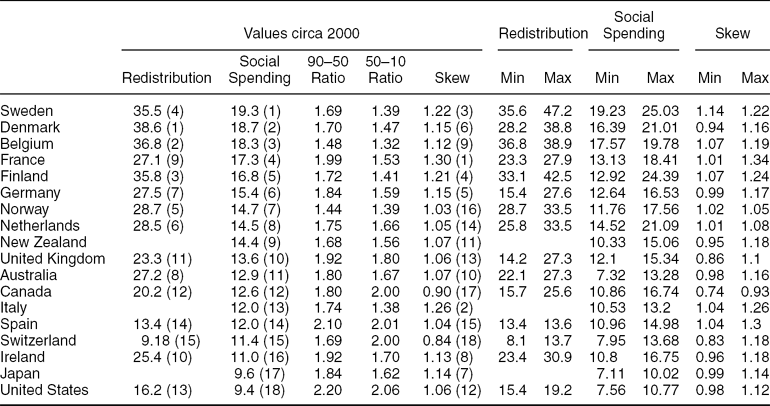
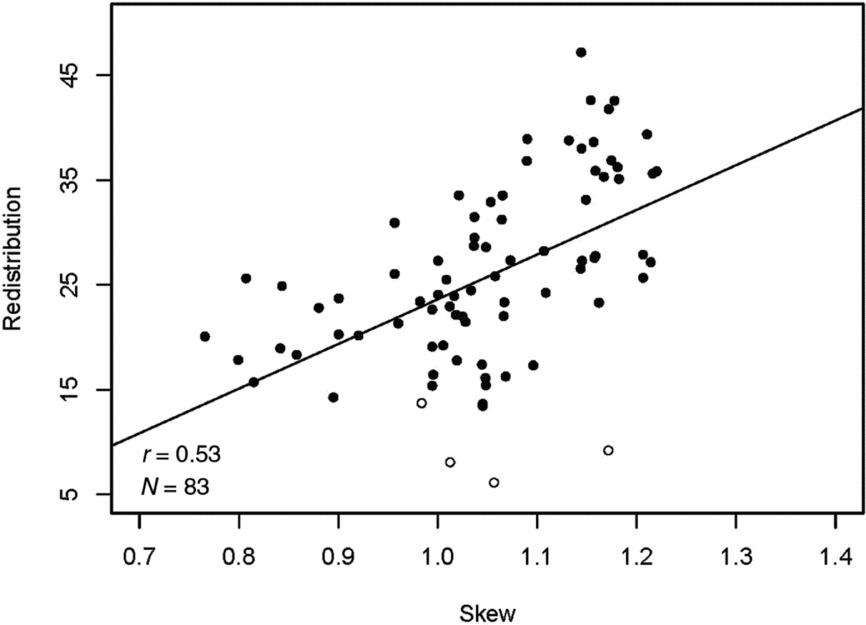
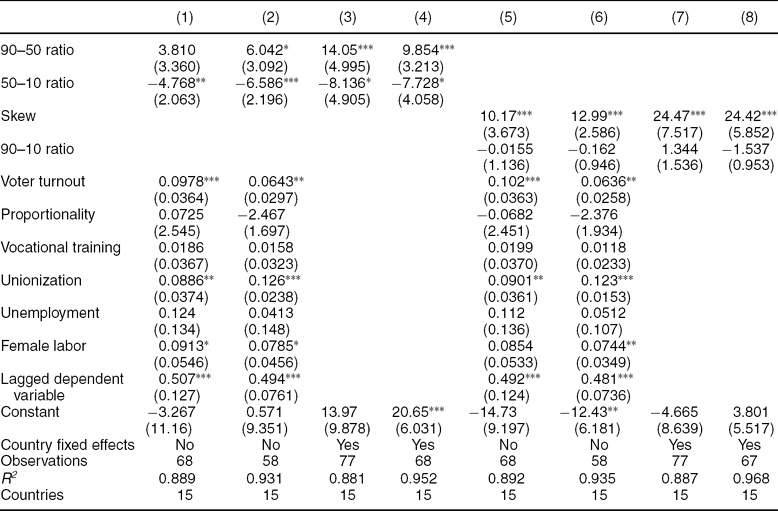
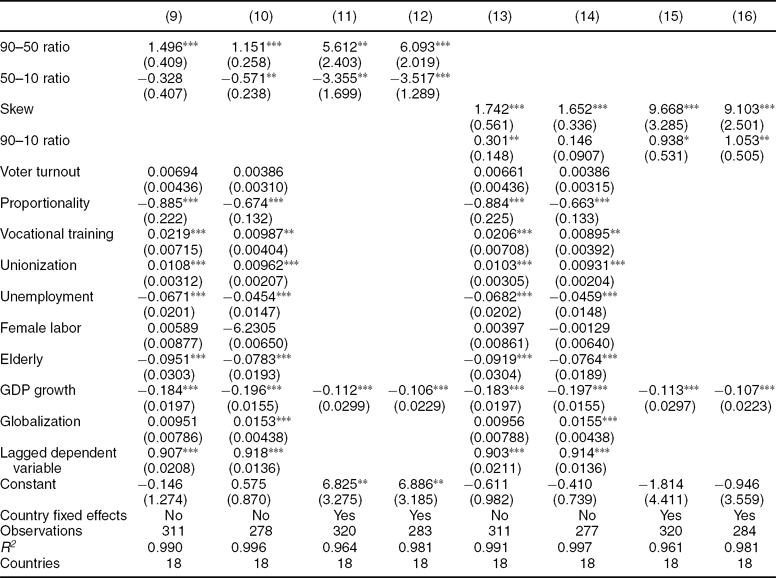
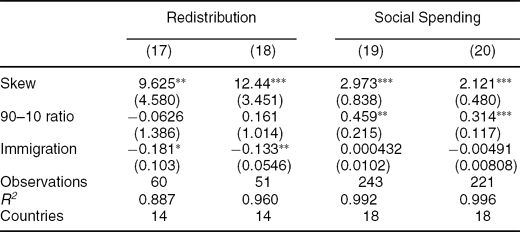
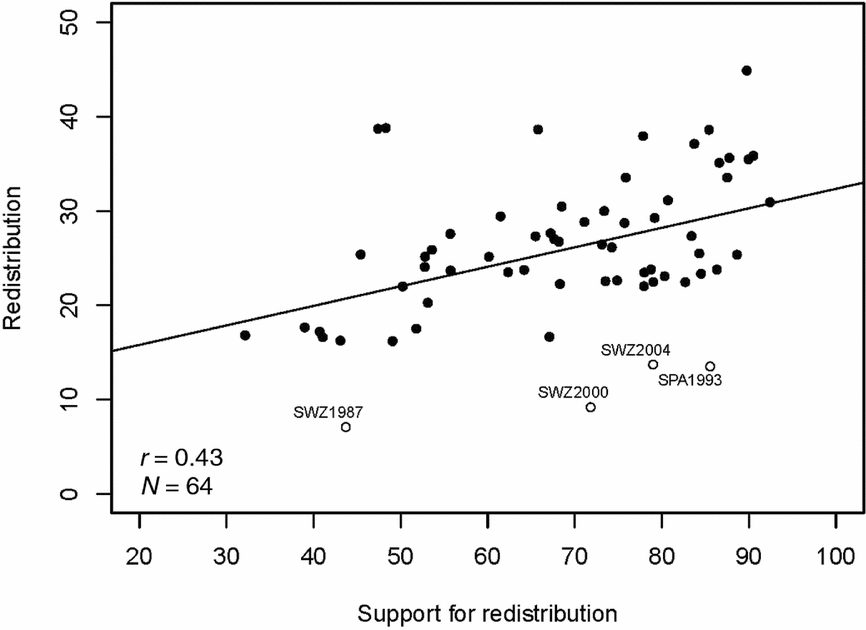
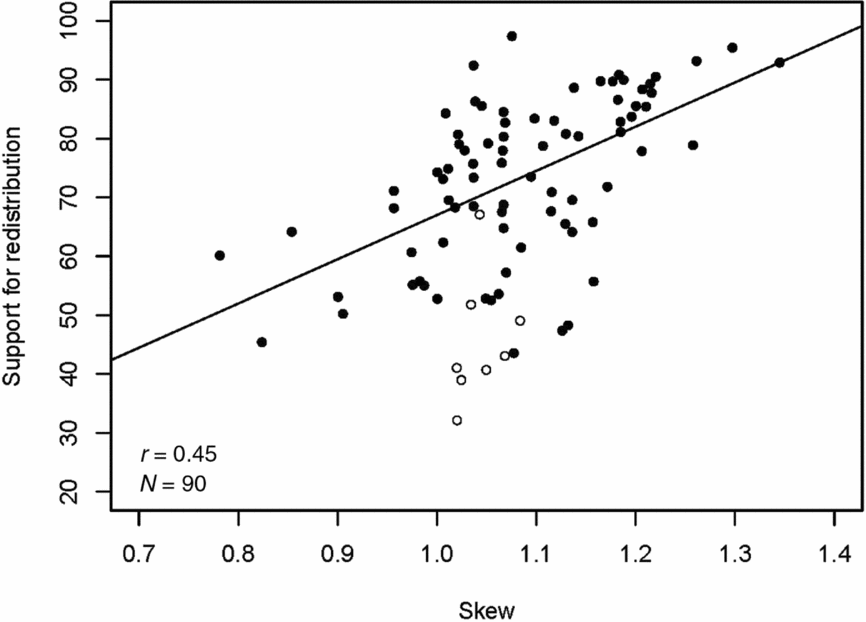
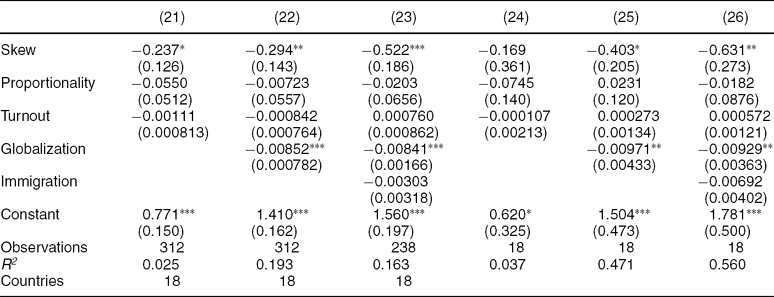
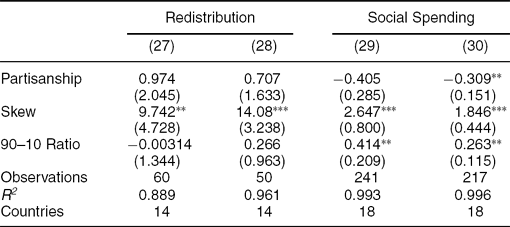



Comments
No Comments have been published for this article.