Professional interpreters are bilinguals who perform what is arguably one of the most challenging linguistic tasks possible – comprehending messages in one language, while simultaneously rendering their meaning into another language (Chang & Schallert, Reference Chang and Schallert2007; Christoffels & de Groot, Reference Christoffels, de Groot, Kroll and de Groot2005; Gerver, Reference Gerver and Briskin1976; Padilla, Bajo, Cañas & Padilla, Reference Padilla, Bajo, Cañas, Padilla and Tommola1995). Unimodal interpreters work between languages that are produced and perceived in the same modality – typically two spoken languages, both of which use the vocal tract for articulation and the auditory system for perception. In contrast, bimodal interpreters interpret between two languages that are produced and perceived in different modalities – one is a spoken language and the other is a signed language, which uses the hands, face, and body as articulators and is perceived through the visual system (see Swabey & Nicodemus, Reference Swabey, Nicodemus, Nicodemus and Swabey2011).
Both unimodal and bimodal interpreters perform the same basic task – they must comprehend a message in one language and produce its equivalent in a second language. Several linguistic, cognitive, and social factors can influence the success – or failure – of an interpretation (Gile, Reference Gile2005; Marmaridou, Reference Marmaridou1996; Martin, Reference Martin2005). One critical factor that impacts the quality of interpretation is direction, i.e., interpreting either from one's second language (L2) into one's native language (L1) or the opposite direction (Godijns & Hinderdael, Reference Godijns and Hinderdael2005a; Kalina, Reference Kalina2005).Footnote 1 For example, some have argued that interpreters can only create linguistically and culturally appropriate messages when working into their native language (Donovan, Reference Donovan, Kelly, Martin, Nobs, Sanchez and Way2003, Reference Donovan2005; Seleskovitch, Reference Seleskovitch1978, Reference Seleskovitch1999). Furthermore, asymmetries in interpretation direction have been taken as evidence for the architecture of the bilingual lexicon. For example, Kroll and Stewart (Reference Kroll and Stewart1994) argued that faster lexical translation times for L2 to L1 than for L1 to L2 support the Revised Hierarchical Model in which L2 words are more strongly connected to their L1 translation equivalents.
Within the field of spoken language interpreting, there is a strong and long-standing predisposition to work from L2 into L1. Based on a large survey of European Parliament interpreters, Donovan (Reference Donovan2004) argued that this pervasive preference for interpreting into L1 stems from a variety of factors, including ease of self-monitoring in L1, better ability to interpret culturally-based references into L1 (e.g., humor), and greater facility for reproducing equivalent registers into L1. In addition, it is well known that comprehension precedes production in language acquisition for both child and adult learners (e.g., Clark & Hecht, Reference Clark and Hecht1983; Izumi, Reference Izumi2003). Even for proficient adult bilinguals, speaking the second language is usually considered harder than comprehending the second language. Therefore, it follows that spoken language interpreters would find it easier to work from L2 into L1, which requires them to produce the interpretation in their native language. Indeed, empirical studies have shown that interpreters make fewer grammatical errors and fewer omissions of information when interpreting into L1 (Lee, Reference Lee2003; Tommola & Helevä, Reference Tommola, Helevä, Bowker, Cronin, Kenny and Pearson1998; but see Al-Salman & Al-Khanji, Reference Al-Salman and Al-Khanji2002; Pavlović, Reference Pavlović2007). Further, the L2 to L1 direction is even preferred for translation of written texts, where the time pressure and cognitive demands of simultaneous interpretation are not present (Newmark, Reference Newmark1988; Pokorn, Reference Pokorn2005). In fact, the L2 to L1 direction of interpretation is so dominant that there are institutionalized policies requiring spoken language interpreters to work into their native language (Association Internationale des Interprètes de Conférence (AIIC), 1991; Pavlović, Reference Pavlović2007).
In sharp contrast to the field of spoken language interpreting, there are several anecdotal reports that bimodal interpreters prefer working in the opposite direction, i.e., from their native language into their second, weaker language (Crasborn, Reference Crasborn2006; Napier, Rohan & Slatyer, Reference Napier, Rohan and Slatyer2005; Nicodemus, Reference Nicodemus2008). For the vast majority of bimodal interpreters, their native language is spoken and their second language is signed and learned in adulthood. This opposite preference for L1 (spoken language) to L2 (signed language) interpreting has been reported for interpreters with varying language pairs: English–American Sign Language (ASL; Nicodemus, Reference Nicodemus2008), Dutch–Sign Language of the Netherlands (van den Bogaerde, Reference Van den Bogaerde2010), and English–Auslan (Napier et al., Reference Napier, Rohan and Slatyer2005). Further, a recent study by van Dijk, Boers, Christoffels and Hermans (Reference Van Dijk, Boers, Christoffels and Hermans2011) found that bimodal interpreters produced higher quality interpretations when working from their L1 (spoken Dutch) into their L2 (Sign Language of the Netherlands). If unimodal and bimodal interpreters do indeed exhibit opposite preferences for interpretation direction, then it raises several questions about what might drive the difference between these bilingual types.
In this study, we directly compared interpretation direction preferences for a large group of bimodal (ASL–English) interpreters and unimodal (spoken language) interpreters using a survey instrument that was designed to elicit information not only about interpretation direction preferences, but also about factors that might influence such preferences. Specifically, we examined (i) self-rankings of comprehension and production proficiency in L1 and L2 (in non-interpreting situations), (ii) amount of training and work experience in each interpreting direction (L1 into L2 and L2 into L1), and (iii) self-ranking of professional status (novice to highly experienced).
We predicted that both bimodal and unimodal interpreters would rank their L2 comprehension and production as weaker than their L1. We also predicted that bimodal interpreters would report a greater difference between L2 (ASL) and L1 (English) proficiency because most bimodal interpreters acquire ASL in late adolescence or early adulthood, whereas many unimodal interpreters acquire their L2 in childhood. However, the key factor of interest was whether this difference in linguistic proficiency is greater for production than for comprehension. Producing a second language is usually harder than comprehending the second language, and as noted above, this factor has been hypothesized to account for the L2 to L1 direction preference held by spoken language interpreters. Given the greater cognitive effort required for language production, both unimodal and bimodal interpreters may prefer to produce interpretations into their stronger, native language (contra the anecdotal L1 into L2 direction preference expressed by bimodal interpreters). However, it is possible that signed language interpreters may actually feel more proficient in their L2 production than in their L2 comprehension, which could lead to the opposite asymmetry in interpreting direction preference. In fact, van Dijk et al. (Reference Van Dijk, Boers, Christoffels and Hermans2011) hypothesize that the signed language production skills of bimodal interpreters may be better than their language comprehension skills. It is also possible that signed language interpreters may feel equally proficient in L1 (English) production and L2 (ASL) production, which would mitigate the preference to work into their L1.
Another factor that might influence interpreting direction preferences is the amount of either training or professional experience working in one direction over the other. The opposite preference for bimodal interpreters could arise because they receive more extensive training in the L1 (English) to L2 (ASL) direction. Currently, there is no quantitative data regarding the amount of training that bimodal interpreting students receive in each direction. It is also likely that there is a higher demand for English to ASL interpreting because there are many more situations in which deaf consumers need to access spoken English (e.g., classroom instruction, legal proceedings) than situations in which they are the primary speaker and their signing must be interpreted into English. Thus, bimodal interpreters may prefer to work into ASL because they simply have more experience and practice interpreting in this direction, whereas unimodal interpreters may have the opposite experience, with more training and practice interpreting into their native language.
Professional status as an interpreter may also differentially impact direction preferences for bimodal versus unimodal interpreters. Many signed language interpreter educators report that novice interpreters often over-estimate their ASL proficiency and ability to interpret into ASL. Further, novice signed language interpreters self-report that they are extremely uncomfortable with “voicing,” that is, interpreting from ASL into English. Based on these anecdotal reports, we predicted that the L1 (English) to L2 (ASL) interpreting preference would be most prevalent among novice interpreters. We hypothesized that a stronger L1 to L2 preference for novice bimodal interpreters might occur because of the unique capacity to fingerspell when a sign is not known and to transcode, i.e., produce ASL signs in English word order, which results in a sign for word translation that does not incorporate ASL morphology or syntactic markers. Such strategies are either not possible (fingerspelling) or are infelicitous (transcoding) when interpreting from ASL into English, nor are they available to unimodal interpreters working into their weaker language. Thus, we predicted that the L1 to L2 preference would be strongest for novice bimodal interpreters because they are more likely to rely on fingerspelling and transcoding as default strategies compared to expert interpreters.
In sum, our survey of direction asymmetries for spoken and signed language interpreters was designed to directly compare the preferences of unimodal and bimodal interpreters, provide evidence regarding the modality-specificity or independence of such preferences, and provide clues to the possible underlying causes of these preferences.
Method
Both groups of interpreters completed an online survey about their language and education background, interpreting training and professional experience, and linguistic fluency in their native and non-native languages. In addition, participants were asked to state their preference for interpreting into their L1 or L2, as well as their perceived proficiency for interpreting in each language direction. The surveys were presented in written English using SurveyMonkey (http://www.surveymonkey.com).
The survey forms for the unimodal and bimodal interpreters were nearly identical except for questions relating to certification (which differs between spoken and signed language interpreters) and the labels that were used to describe native and non-native languages. For the spoken language interpreters, the terms “A” and “B” language were used because these terms are the official designations established by the AIIC for describing native (“A”) and non-native (“B”) languages. For bimodal interpreters, the terms “native” and “non-native” languages were used because “A” and “B” are not common designations used by signed language interpreters in North America.
ASL–English interpreters were recruited through electronic mailing lists (listservs) for members of two national interpreting organizations in North America: the Registry of Interpreters for the Deaf (RID) and the Association of Visual Language Interpreters of Canada (AVLIC). Spoken language interpreters were recruited through postings on 18 international interpreting listservs (i.e., professional associations and educational institutions). Involvement in the study was voluntary, and no compensation was provided to the participants. The survey took approximately 15 minutes to complete.
The data for both groups were transferred from SurveyMonkey into Excel for analysis, and partially completed surveys were eliminated.
Results
A total of 1,359 interpreters completed the survey (658 unimodal and 701 bimodal interpreters). However, surveys from 118 unimodal interpreters were excluded because they did not clearly identify an L1 (“A” language”) or L2 (“B” language) and 68 bimodal interpreters were excluded because they either indicated that they had a native language other than English or ASL or they indicated two native languages (usually ASL and English). The final participant sample consisted of 540 unimodal interpreters and 633 bimodal interpreters. Direction preferences for bimodal interpreters who indicated that ASL was their native language were analyzed separately.
The spoken language interpreters reported many different language combinations, and as a group reported 31 different native languages. This result indicates that our recruiting methods tapped into a large international pool of spoken language interpreters. The most common language combination reported by the unimodal interpreters was Spanish (L1) and English (L2) (N = 90). The majority of the signed language interpreters (94%) reported English (N = 597) as their L1, while a smaller group (6%) stated that ASL was their native language (N = 36). It is likely that this latter group, commonly referred to as Codas (Children of Deaf Adults), acquired ASL as their first language from deaf family members.
Women were over-represented in both groups of interpreters, with 381 females (71%) in the unimodal group and 566 females (90%) in the bimodal group. This finding represented typical gender patterns of professional interpreters. For example, the Registry of Interpreters for the Deaf (RID) reports that their membership is 87% female. The mean age of unimodal interpreters was 47 years (SD = 12; range = 21–80 years), and mean age of the bimodal interpreters was 41 years (SD = 11; range = 19–71 years). This group difference in age was significant, t(1,1193) = 8.70, p < .001, and may reflect the fact that signed language interpreting is an emerging field with a younger pool of practitioners.
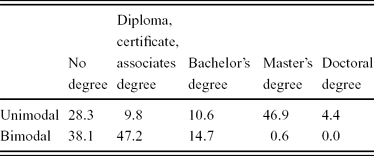
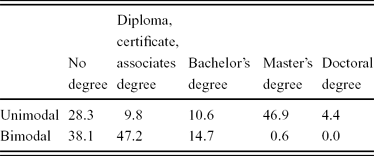
Unimodal interpreters held more earned degrees, notably, more graduate degrees, in interpretation and translation than the bimodal interpreters (see Table 1). The majority of bimodal interpreters held either no degree in interpreting or held a two-year degree (or less). This result may be due to the fact that signed language interpreting is a relatively new field, and there are few graduate degree programs available in signed language interpreting (and none in translation). In addition, signed language interpreting is often still viewed as a trade, rather than as a professional discipline, and unlike spoken language interpreting, it is not rooted in translation studies, which has a long literary tradition.
Percentage of interpreters with higher education credentials in interpreting or translation.
Participants were asked to indicate their professional status as interpreters using a Likert scale, ranging from 1 (“novice”) to 7 (“highly experienced”). Unimodal interpreters provided significantly higher self-rankings of professional status than did bimodal interpreters: mean ranking = 5.8 (SE = .1) vs. 5.0 (SE = .1), Mann-Whitney U = 122525.5, n 1 = 540, n 2 = 662, p < .0001. This disparity in self-perception of professional standing between the groups may arise in part because unimodal interpreters have many more opportunities to interpret in formal and high status situations (e.g., diplomatic talks, international law and trade negotiations). In contrast, bimodal interpreters work much more frequently in community settings (e.g., medical appointments, classroom interpreting) and therefore may be less likely to perceive themselves as highly experienced professionals.
Direction asymmetries in unimodal and bimodal interpreters
Both groups were asked the following two questions:
1. In general, in which interpreting direction do you feel more proficient (i.e., skilled, competent, capable)?
__ From my [“A” language/English] into my [“B” language/ASL].
__ From my [“B” language/ASL] into my [“A” language/English].
__ I feel equally proficient in both interpreting directions.
2. In which language direction do you prefer to interpret? (Note: This may be different from the interpreting direction in which you feel most proficient.)
__ From my [“A” language/English] into my [“B” language/ASL].
__ From my [“B” language/ASL] into my [“A” language/English].
__ I do not have a preference for interpreting in either language direction.
While interpreters may most often prefer working in their most proficient direction, it is possible that some may prefer a particular direction for reasons other than proficiency. For example, rate of pay can differ depending upon language direction (Chang & Schallert, Reference Chang and Schallert2007), and some interpreters may prefer to work in their less proficient direction in order to obtain more practice. Therefore, the direction asymmetry analysis was conducted only with those respondents who reported either (a) the same language direction for both their preference and their proficiency or (b) indicated no direction preference and equal proficiency in both directions. Based on this criterion, 179 unimodal and 276 bimodal interpreters were excluded from the analysis – most often because they expressed equal proficiency in both directions but expressed a preference for interpreting in one direction or vice versa (i.e., no direction preference, but they felt more proficient in one direction). In addition, some ASL–English interpreters were excluded because either they reported ASL as their native language (N = 21) or they reported that they were non-native English speakers (N = 7). As a result, the total number of respondents for the direction asymmetry analysis was 361 unimodal and 357 bimodal interpreters.
Significantly more unimodal (32%; N = 114) than bimodal interpreters (22%; N = 79) reported that they preferred and felt equally proficient interpreting in both directions (L1 to L2 and L2 to L1), χ 2 = 8.16, p < .01 (see Table 2).
Percentage of interpreters expressing no direction preference and of those who expressed a direction preference, the percentage of interpreters who preferred to interpret in each direction.

Of those respondents who indicated a direction preference, three times as many bimodal interpreters (82%) felt more proficient working from their L1 into their L2 compared to unimodal interpreters, (28%), χ 2 = 153.44, p < .001. This result clearly confirms anecdotal reports that bimodal interpreters prefer to work from their native language (English) into their second, weaker language (ASL), whereas unimodal interpreters, as expected, preferred to work into their native language.
Respondents were also asked to rate their proficiency for each interpreting direction using a 1 (“not very proficient”) to 7 (“highly proficient”) Likert scale. We conducted a 2 (group: unimodal, bimodal) × 2 (direction: L1 to L2, L2 to L1) ANOVA with these ratings, and the results are shown in Figure 1. Unimodal interpreters provided higher proficiency ratings (mean = 5.83; SE = .06) than did the bimodal interpreters (mean = 4.85; SE = .06); main effect of group: F(1,469) = 150.156, MSE = 1.507, p < .001. There was no main effect of interpreting direction, F < 1. Crucially, however, there was a significant interaction between interpreting group and direction, F(1,469) = 201.528, MSE = 0.793, p < .001. Bimodal interpreters provided significantly higher proficiency ratings for working from L1 (English) into L2 (ASL) (mean = 5.28, SE = .07) than from L2 (ASL) into L1 (English) (mean = 4.43, SE = .07), t(223) = 13.182, p < .001. In contrast, unimodal interpreters rated themselves as less proficient when working from L1 into L2 (mean = 5.43, SE = .07) than from L2 into L1 (mean = 6.23, SE = .07), t(246) = 8.525, p < .001.
Mean self-reported proficiency ratings for both interpreting directions by bimodal and unimodal interpreters. Error bars indicate standard error of the mean (proficiency rating: 1 = not very proficient, 7 = highly proficient).

These are the first quantitative data that demonstrate the striking difference between spoken and signed language interpreters in their preferred direction for interpretation. We now turn to data that are relevant to possible explanations for this difference in direction asymmetry between unimodal and bimodal interpreters.
L1 and L2 comprehension and production
To assess interpreters’ self-perceived ability to comprehend and produce their L1 and L2, we asked them to rate their overall comprehension and production abilities in their two languages in non-interpreting situations using a Likert scale ranging from 1 (“very weak”) to 7 (“very strong”). This analysis was conducted with the same group of 357 bimodal and 361 unimodal interpreters from the above direction asymmetry analysis.
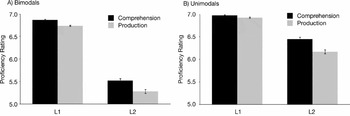
A 2 (group: unimodal, bimodal) × 2 (language: L1, L2) × 2 (processing type: comprehension, production) ANOVA was conducted with proficiency ratings as the dependent measure. The results are shown in Figure 2. Unimodal interpreters gave higher proficiency ratings overall compared to bimodal interpreters, mean ratings = 6.63 (SE = .03) and 6.10 (SE = .03), respectively, F(1,706) = 201.392, MSE = 0.989, p < .001. As expected, proficiency ratings were higher for L1 (mean = 6.88; SE = .01) than for L2 (mean = 5.86; SE = .03), F(1,706) = 929.674, MSE = 0.792, p < .001. As expected, both groups of interpreters felt less proficient in language production (mean = 6.28; SE = .02) than in language comprehension (mean = 6.46; SE = .02), F(1,706) = 125.311, MSE = 0.165, p < .001.
Mean self-reported proficiency ratings for comprehension and production in L1 and L2 by bimodal and unimodal interpreters. Error bars indicate standard error of the mean (proficiency rating: 1 = not very proficient, 7 = highly proficient).

There was a significant interaction between language and processing type, F(1,706) = 41.797, MSE = 0.128, p < .001. L2 production (mean proficiency rating = 5.73; SE = .04) was considered to be much weaker than L1 production (mean proficiency rating = 6.84; SE = .02). Comprehension was also considered weaker for L2 than for L1, mean proficiency ratings = 5.99 (SE = .04) and 6.92 (SE = .01), respectively, but the difference between proficiency ratings for L2 and L1 was greater for language production (mean difference = 1.11) than for comprehension (mean difference = 0.93).
There was also a significant interaction between language and interpreter group, F(1,706) = 131.119, MSE = 0.792, p < .001. Self-ratings for L2 proficiency were much lower for the bimodal interpreters (mean = 5.40; SE = .05) than for the unimodal interpreters (mean = 6.32; SE = .05). Self-ratings for L1 proficiency were also lower for the bimodal interpreters (mean = 6.81; SE = .02) than for the unimodal interpreters (mean = 6.95; SE = .02), but the difference between proficiency ratings was much greater for L2 (mean difference = 0.92) than for L1 (mean difference = 0.14).
Finally, there was a three-way interaction between language, processing type, and interpreter group, F(1,706) = 4.759, MSE = 0.128, p = .029. For L1, the unimodal interpreters reported very similar proficiency ratings for comprehension and production (mean difference = 0.05), whereas the bimodal interpreters reported a larger difference between comprehension and production for their L1 (mean difference = 0.13), F(1,706) = 8.896, MSE = 0.063, p = .003. In contrast, for L2, both groups reported a similar difference between comprehension and production: mean difference in proficiency ratings = .27 and .24 for the unimodal and bimodal interpreters, respectively, F < 1. It is not clear why bimodal interpreters exhibited a greater disparity between L1 comprehension and production proficiency than did the unimodal interpreters. One possibility is that bimodal interpreters were influenced by their lack of proficiency when interpreting into their L1 (see Figure 1), and therefore provided lower proficiency ratings for L1 production, even though they were asked to rate their proficiency in non-interpreting situations.
We next examine whether bimodal interpreters might receive more training or have more professional experience interpreting from L1 into L2 than from L2 into L1.
Training and work experience
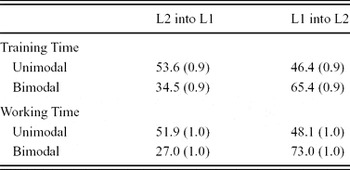
Interpreters were asked to estimate the percentage of training time received in each language direction, as well as the percentage of time interpreting in each direction in their professional practice. The results are listed in Table 3. With respect to training, unimodal interpreters received fairly balanced instruction in each interpreting direction, with a slight bias for more training into their L1; in contrast, the bimodal interpreters received almost twice as much instruction in interpreting from L1 (English) to L2 (ASL), F(1,669) = 220.218, MSE = 555.958, p < .001. Similarly, with respect to work experience, unimodal interpreters reported that they work about equally in both language directions, whereas the bimodal interpreters reported that they interpret from L1 into L2 almost three times as often as from L2 into L1, F(1,695) = 337.166, MSE = 640.826, p < .001.
Mean percentage (standard error) of interpreters’ estimated time spent training and interpreting in each language direction.

Professional status: Novice vs. expert interpreters
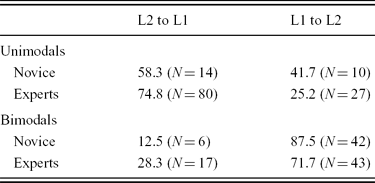
To determine whether professional status affected direction preferences, we categorized the interpreters in both groups as novice or expert based on the following criteria. We defined novice interpreters as those who had three years or less of full-time interpreting experience and rated themselves as a “4” or below on the scale of professional status (see above). An additional criterion for novice bimodal interpreters was that they did not hold certification from a national credentialing organization. We defined expert interpreters as those who had 10 or more years of full-time interpreting experience and rated themselves as either “6” or “7” on the scale of professional status.Footnote 2 Additionally, expert bimodal interpreters held national interpreting certification. This analysis did not include “intermediate” interpreters who did not meet the criteria for either novice or expert and thus fell in between these two categories. For the unimodal interpreters, 6% (N = 32) were novices and 45% (N = 242) were experts. For the bimodal interpreters, 8% (N = 56) were novices and 25% (N = 169) were experts.
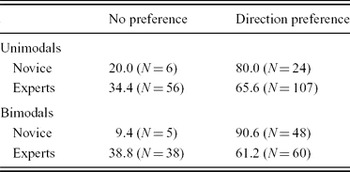
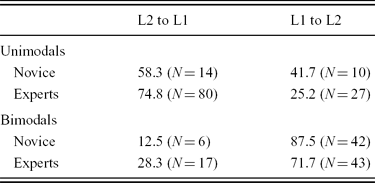
As shown in Table 4, both novice and expert unimodal interpreters tended to express a direction preference, and novices were not significantly different from experts, χ 2 = 2.39, p > .1. In contrast, for the bimodal interpreters, novices were significantly more likely to express a direction preference than the experts, χ 2 = 14.54, p < .001.
Percentage of novice and expert interpreters who expressed no direction preference or who preferred a specific interpreting direction (either L1/English to L2/ASL or L2/ASL to L1/English).

As shown in Table 5, of those respondents who expressed a direction preference, more novice and expert unimodal interpreters preferred to work into their L1, but again there was no difference between the two groups, χ 2 = 2.612, p > .1. In contrast, more bimodal interpreters preferred to work into their L2 (ASL), and significantly more novices than experts preferred to work into their L2, χ 2 = 3.989, p < .05.
Percentage of novice and expert interpreters who preferred interpreting from L1/English into L2/ASL or from L2/ASL into L1/English.
Thus far, we have only examined bimodal interpreters who indicated that ASL was their second language. We now turn to the group of interpreters who indicated that ASL was their first language or that both ASL and English were acquired natively. Data from these interpreters will help determine how ASL fluency affects direction preference in contrast to factors unrelated to proficiency, such as time spent training or interpreting in each direction.
Bimodal interpreters whose native language is ASL
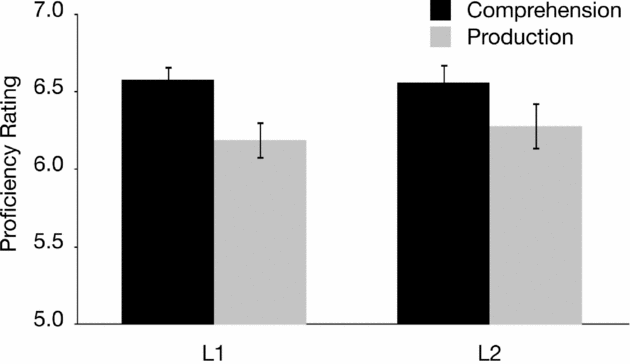
In this section we examine the responses of bimodal interpreters (N = 44) who indicated that ASL was their native language and who provided consistent responses for their preference and their proficiency with respect to interpreting direction. We first report the results from their self-ratings for comprehension and production for both English and ASL. We conducted a 2 (language: English, ASL) × 2 (processing type: comprehension, production) ANOVA with proficiency ratings as the dependent measure. As can be seen in Figure 3, proficiency ratings for production were lower than for comprehension for both languages, F(1,42) = 23.177, MSE = 0.211, p < .001. This finding parallels the results with the other bimodal interpreters (ASL = L2) and the unimodal interpreters (see Figure 2). In contrast to these two groups, however, there was no main effect of language, F < 1. The L1 ASL interpreters provided similar proficiency ratings for both of their languages. Further, there was no interaction between language and processing type, F < 1. This finding again contrasts with the results from the other two interpreter groups for whom the difference in proficiency ratings for L2 compared to L1 was much greater for language production than comprehension.
Mean self-reported proficiency ratings for comprehension and production in L1 (ASL) and L2 (English) by bimodal interpreters who indicated ASL as a native language. Error bars indicate standard error of the mean (proficiency rating: 1 = not very proficient, 7 = highly proficient).
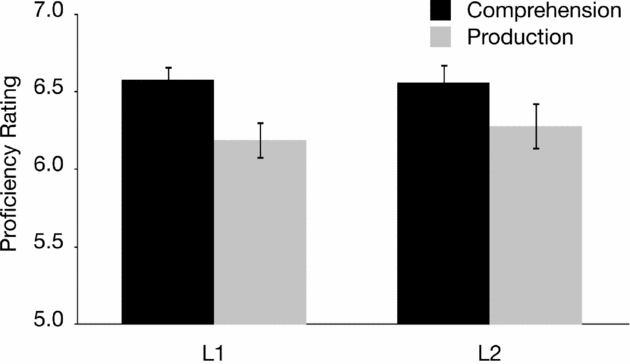
This pattern of proficiency ratings indicates that bimodal interpreters who acquired ASL as a native language were relatively balanced in both English and ASL. As expected, their proficiency ratings for ASL were significantly higher than those of the bimodal interpreters who indicated ASL as their L2, F(1,399) = 38.430, MSE = 2.061, p < .001 (mean rating = 6.39 for L1 ASL interpreters and 5.38 for the L2 ASL interpreters). The L1 ASL interpreters also differed from the unimodal interpreters who (like the L2 ASL interpreters) rated their proficiency in L2 as lower than L1. However, we only analyzed data from unimodal interpreters who identified a clear L1 and L2 and therefore were less likely to be balanced bilinguals.
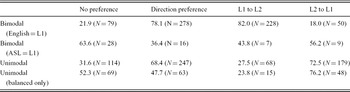
We next examined whether the direction preferences were different for this group of ASL–English interpreters who are highly proficient signers. As shown in Table 6, this group exhibited a unique pattern of direction preference that did not parallel either the L2 ASL bimodal interpreters or the unimodal interpreters.
Percentage of interpreters expressing no direction preference and of those who expressed a direction preference, the percentage of interpreters who preferred to interpret in each direction. (For convenience, data from the bimodal interpreters (English = L1) and the unimodal interpreters are repeated from Table 2.)

Significantly more L1 ASL interpreters indicated no interpreting direction preference compared to L2 ASL interpreters, χ 2 = 35.00, p < .001, and compared to the unimodal interpreters, χ 2 = 17.70, p < .001. In addition, this group of bimodal interpreters also differed in direction preference from both the L2 ASL interpreters, χ 2 = 6.43, p < .05, and from the unimodal interpreters, χ 2 = 5.99, p < .05. Direction preference for the L1 ASL interpreters was roughly divided between the two interpreting directions, which stands in contrast to the other two interpreting groups, who clearly preferred either L1 to L2 (bimodal interpreters) or L2 to L1 (unimodal interpreters). Thus, the L1 ASL interpreters were much more likely to indicate equal proficiency in both interpreting directions, and direction preference was not consistent among those who did express a preference.
We next examined whether a difference in training or work experience might explain the pattern of direction preferences observed for the L1 ASL interpreters compared to the L2 ASL interpreters. However, the same asymmetry in training and work experience was observed for both groups. The L1 ASL interpreters also reported receiving significantly more training from English into ASL (59%) than ASL into English (41%), t(39) = 2.912, p = .006, and they reported working significantly more often into ASL (64%) than into English (36%), t(41) = 7.381, p < .001.
Finally, to examine whether a similar pattern held for the more balanced unimodal interpreters, we determined the direction preferences for those unimodal interpreters (N = 132) who provided a proficiency rating of “7” for both their “A” (L1) and their “B” (L2) languages (for both production and comprehension). As shown in Table 6, balanced unimodal interpreters patterned like the L1 ASL bimodal interpreters, with roughly half expressing no direction preference. Thus, when both unimodal and bimodal interpreters are equally proficient in their two languages, the likelihood that they have a preference for an interpreting direction decreases. However, in contrast to the L1 ASL interpreters, the balanced unimodal interpreters who expressed a direction preference overwhelmingly preferred to interpret into their L1 (“A” language), χ 2 = 6.35, p < .05.
Discussion
Unlike unimodal interpreters, bimodal interpreters overwhelmingly expressed a preference to interpret from their L1 (English) into their L2 (ASL), and this direction preference was particularly strong for novice bimodal interpreters who are least proficient in ASL. We observed a few subtle differences between the population characteristics of unimodal and bimodal interpreters, but these differences are unlikely to explain the divergence in direction preference. Specifically, bimodal interpreters were an average of six years younger than unimodal interpreters, held fewer graduate degrees, and fewer rated themselves as highly experienced interpreters. We suggest that these difference arise because spoken language interpreting has a much longer history, requires a much higher level of linguistic proficiency before entering the field, and has more practitioners in high status environments (e.g., diplomatic negotiations) than in community environments.
Significantly more unimodal than bimodal interpreters reported equal ease interpreting in both directions (see Table 2 above). Unimodal interpreters were more likely to receive balanced training in both directions and also to have more experience working in both directions (see Table 3 above). Such training and experience may lead to a larger proportion of unimodal interpreters who have achieved equal proficiency in both interpreting directions. Given the more balanced work and training environment for unimodal interpreters, there may be a greater expectation of balanced fluency among unimodal than among bimodal interpreters.
In addition, bimodal interpreters rated themselves as less proficient in their L2 compared to the unimodal interpreters for both comprehension and production (see Figure 2 above). This difference may arise because of how signed and spoken languages are typically acquired as a second language. Bimodal interpreters most often learn ASL in adulthood, whereas spoken language interpreters may learn their second language in early childhood because English (the most common L2) was taught in school as a second language, their family moved to a new country when they were young, or they attended a bilingual school. None of these conditions were possible for the bimodal interpreters, and many studies have shown that early language acquisition leads to greater proficiency in adulthood (e.g., Johnson & Newport, Reference Johnson and Newport1989; Mayberry & Eichen, Reference Mayberry and Eichen1991). Furthermore, unimodal interpreters who receive training are usually quite proficient in their two languages when they enter an interpreter education program. In contrast, many bimodal interpreters enter interpreter education programs without any prior experience with ASL, or with only one or two years of ASL instruction. Thus, signed language interpreting programs typically provide language instruction alongside interpreter training. These educational and language background factors may explain the disparity in L2 proficiency ratings for bimodal versus unimodal interpreters
The results of the proficiency ratings for L1 and L2 comprehension and production (see Figure 2) indicate that the different direction preferences for unimodal and bimodal interpreters was not due to distinct language production–comprehension asymmetries. Both unimodal and bimodal interpreters patterned similarly, rating their L1 production ability as stronger than their L2 production ability – in fact, the disparity between L1 and L2 production proficiency was even larger for the bimodal interpreters. Furthermore, bimodal interpreters did not feel more proficient in their L2 production than in their L2 comprehension (in fact, just the opposite). Although the disparity between production and comprehension might be a driving factor for the L2 into L1 interpreting preference for spoken language interpreters, other factors must over-ride this bias for bimodal interpreters.
The results also revealed that work experience and training cannot completely explain the difference between unimodal and bimodal interpreters. Although bimodal interpreters had significantly more experience and training interpreting from L1 into L2, the unimodal interpreters did not have more experience interpreting from L2 into L1 – their training and work experience was evenly divided between directions (see Table 3). As noted in the introduction, bimodal interpreters may have more experience interpreting from L1 into L2 because there is a greater demand for English into ASL interpretation. There are more hearing individuals in positions where they provide information to deaf people than deaf individuals in positions to provide information to hearing people. In contrast, the language communities that employ unimodal interpreters may be more balanced and equitable with respect to the distribution of speakers who are in positions that utilize interpreting services. That is, many more individuals in spoken language communities hold positions that require bi-directional communication (e.g., diplomats and business leaders), and thus unimodal interpreters work equally between both languages, rather than primarily in one direction. The balanced work and training experience for unimodal interpreters is somewhat surprising given the long-standing bias and organizational policies for interpreting into L1. Nonetheless, these findings suggest that the L2 into L1 preference emerges for unimodal interpreters despite nearly equal time training and working in both interpreting directions.
Finally, unimodal novice and expert interpreters had relatively similar interpreting direction preferences, whereas significantly more novice bimodal interpreters preferred to interpret into their L2 and fewer bimodal novices expressed no direction preference compared to experts (see Tables 4 and 5). This pattern of results was predicted because we hypothesized that novice ASL–English interpreters can rely on modality-specific strategies, specifically fingerspelling and transcoding, that are not available to spoken language interpreters.
When interpreting from English into ASL, novice interpreters can easily default to fingerspelling an English word when they do not know the ASL sign. This compensatory strategy is possible because deaf consumers are almost always bilingual in (written) English and ASL. In contrast, if a novice interpreter encounters an unknown ASL sign when interpreting from ASL into English, he or she has no “fall back” strategy, and the interpretation can break down. In addition, comprehending fingerspelling is notoriously difficult for novice interpreters, as evidenced by specific coursework, workshops, and DVDs devoted to improving fingerspelling reception. Thus, fingerspelling increases the difficulty of interpreting from ASL into English but decreases the difficulty of interpreting from English into ASL. We note, however, that fingerspelling as a “default strategy” is often not successful because the deaf consumer may not know the English word and ubiquitous fingerspelling violates linguistic constraints on the use of fingerspelling in ASL discourse (Battison, Reference Battison1978; Wilcox, Reference Wilcox1992).
For bimodal interpreters, transcoding refers to either producing ASL signs with English syntactic structure or English words with ASL syntactic structure, which frequently results in ungrammatical constructions. We suggest that when interpreting from English into ASL, transcoding has a degree of acceptance among deaf consumers. The production of ASL with English word order is characteristic of invented signed systems such as Signed Exact English, and some deaf consumers may actually request transcoding because of their language and educational background. Further, in the past, “English-like” signing was regarded as superior and more erudite than the signing used in everyday interactions within the Deaf community (Padden & Humphries, Reference Padden and Humphries1988). In contrast, when interpreting from ASL into English, transcoding is generally unacceptable to hearing consumers because the English output is ungrammatical and sounds like “broken English”. Thus, although transcoding often does not result in effective ASL interpretations for many deaf consumers, this tactic is nonetheless frequently used, particularly by novice interpreters. Finally, bimodal interpreters often work in situations with one deaf consumer and many hearing consumers. For novice interpreters, this asymmetry may foster a preference for interpreting into ASL because then only one person is aware of inadequacies in the interpretation.
Another factor that might affect both novice and expert bimodal interpreters’ preference for English into ASL over ASL into English is the extensive linguistic variation within the deaf signing community (Lucas & Valli, Reference Lucas, Valli and Lucas1989). The vast majority of deaf consumers are non-native signers (an estimated 90%; Mitchell & Karchmer, Reference Mitchell and Karchmer2004), whereas the majority of hearing consumers are native English speakers. In fact, some deaf individuals have had very little to no exposure to a signed language throughout most of their childhood, acquiring ASL as a late first language. Further, as noted above, some deaf individuals have been taught to communicate via artificially constructed signed systems, such as Cued Speech or Signed Exact English. Thus, while both unimodal and bimodal interpreters work with variations of language use (e.g., dialects, registers), bimodal interpreters must also frequently interpret for consumers who use highly diverse and non-standardized forms of signed language. This asymmetry in linguistic variation between ASL and English is likely to lead to a preference to interpret from English into ASL because bimodal interpreters have much more control over their own signed output than the signed input from the deaf consumer. These conditions may have a stronger influence on novice interpreters’ direction preference because they have not yet gained sufficient experience to cope with the extensive linguistic variation in sign.
Finally, novice bimodal interpreters may prefer to interpret into ASL because they cannot self-monitor their signed language output as successfully as they can their spoken language output. Just as hearing consumers immediately recognize transcoded English as odd or ungrammatical, interpreters also hear their own errors. Novice interpreters may be more likely to accurately detect their errors when speaking because auditory feedback plays a larger role in self-monitoring than visual feedback does during signing (Emmorey, Bosworth & Kraljic, Reference Emmorey, Bosworth and Kraljic2009). Psycholinguistic research has shown that signers do not visually monitor their output, relying more on proprioceptive feedback to catch signed errors (Emmorey, Gertsberg, Korpics & Wright, Reference Emmorey, Gersberg, Korpics and Wright2009; Emmorey, Korpics & Petronio, Reference Emmorey, Korpics and Petronio2009). Novice signers may be less able to detect their signed errors because a) they are less fluent in ASL and b) they may not have yet developed proprioceptive self-monitoring skills.
In sum, we propose that the following factors all converge to favor interpreting from L1 (English) into L2 (ASL) for bimodal interpreters:
a. Bimodal interpreters receive significantly more training and practice working from English into ASL.
b. Fingerspelling decreases the difficulty of interpreting from English into ASL but increases the difficulty of interpreting from ASL into English.
c. Transcoding requires less effort than creating an interpretation, and it is more acceptable to transcode when interpreting from English into ASL than from ASL into English (e.g., some deaf consumers may request transcoding – literal word for sign translations – of English into ASL).
d. Bimodal interpreters have more control over their own ASL output than the ASL input they receive from deaf consumers who can vary widely in their signing ability (90% of deaf consumers are non-native signers).
e. Bimodal interpreters (especially novice interpreters) may be better able to self-monitor their spoken than their signed output because auditory feedback plays a larger role than visual feedback in on-line error detection. A heightened awareness of errors during “voicing” (ASL into English) may lead bimodal interpreters to disfavor this interpreting direction.
Note that all of these factors, except perhaps the amount of work experience and practice, are likely to be affected by proficiency in ASL. Higher levels of ASL proficiency will result in better fingerspelling skill, less need to transcode, better comprehension of ASL variation, and similar self-monitoring skills for signing and speaking. Increased ASL proficiency thus reduces the difficulty of interpreting from ASL into English, which may reduce the L1 into L2 direction preference. Supporting this hypothesis, we found that bimodal interpreters who considered ASL to be their L1 and who were equally proficient in both languages did not show a strong preference for interpreting into ASL (see Table 6 above). In contrast, the unimodal interpreters who rated themselves as equally proficient in their L1 and L2 nonetheless still expressed a preference to work into their L1. These results suggest that proficiency in L2 has a much stronger affect on interpreting direction preferences for bimodal than for unimodal interpreters. We suggest that this difference is rooted in modality-specific challenges that face bimodal interpreters and in the fact that many bimodal interpreters are late ASL learners who often enter the field of interpreting with relatively low ASL proficiency.
It remains to be determined whether the quality of interpretation might actually be better when bimodal interpreters work into their stronger L1 (English) compared to working into their weaker L2 (ASL). However, a survey of deaf consumers in the US suggests that this is not the case. Forestal (Reference Forestal2009) found that deaf people report concerns about interpreters’ ability to render accurate interpretations from ASL into English. Forty six percent of deaf respondents (N = 181) cited poor ASL to English interpreting as the primary reason for negative experiences with interpreters. In addition, it will be important to discover whether the same direction asymmetry is found when bimodal interpreters perform a simple lexical translation task in which the above factors do not apply. That is, do bimodal interpreters (or bimodal bilinguals) exhibit better L1 to L2 translation than L2 to L1 translation, in contrast to what has been found for unimodal bilinguals (e.g., Kroll & Stewart, Reference Kroll and Stewart1994)? Baus, Carreiras and Emmorey (in press) reported faster lexical translation times for L1 to L2 (English to ASL) than for L2 to L1 translation (ASL to English) for bimodal bilinguals (and for new learners of ASL). However, presentation modality prevented a direct comparison of translation directions because the English to-be-translated materials were presented as printed words while the ASL to-be-translated materials were presented as video clips of signs. It is likely that it took longer to recognize signs which unfolded over time than printed words which were perceived simultaneously, leading to much longer L2 (ASL) to L1 (English) translation times. If this asymmetry is still found when modality factors are controlled, then it will suggest that bimodal bilinguals may differ from unimodal bilinguals with respect to how their two languages are connected at the lexical level. For example, it is possible that mouthing (the production of English mouth patterns with an ASL sign) creates a unique link between the two lexicons (see also Thompson, Vinson & Vigliocco, Reference Thompson, Vinson and Vigliocco2010).
We conclude that bimodal bilinguals and bimodal interpreters provide a unique avenue for investigating factors that affect translation performance and the nature of the links between languages. In this study, we documented a clear difference in interpreting direction preference: spoken language interpreters prefer to interpret into their stronger, native language, while signed language interpreters prefer to interpret into their weaker, second language (ASL). Thus, bimodal and unimodal bilinguals do not exhibit the same language translation asymmetry. Our data indicate that this result cannot be completely explained by differences between interpreter groups in the amount of practice and training or by different asymmetries in language production and comprehension skills. We propose several modality-specific and community-based effects that might combine to alter translation direction preferences for signed language interpreters compared to spoken language interpreters. Given the limits of survey methods, we suggest that future research employ psycholinguistic paradigms and direct assessments of interpreter performance to determine whether and how such modality-specific factors as use of fingerspelling or proprioceptive self-monitoring might impact the accuracy and ease of interpreting into a signed versus a spoken language for bimodal interpreters.