





1. Introduction
Froth flotation by small air bubbles has traditionally been used in industry to capture fine minerals and other hydrophobic particles (Kitchener Reference Kitchener1984; Wills & Napier-Munn Reference Wills and Napier-Munn2006). However, this method is not efficient for capturing very small particles of approximately 10–20  $\mathrm {\mu }$m in diameter or less (Miettinen, Ralston & Fornasiero Reference Miettinen, Ralston and Fornasiero2010; Leja Reference Leja2012). In such cases, the lubrication resistance between the floating bubbles and particles hinders collision, making the particles move around the bubble instead of being captured (Mehrotra, Sastry & Morey Reference Mehrotra, Sastry and Morey1983; Barnocky & Davis Reference Barnocky and Davis1989; Loewenberg & Davis Reference Loewenberg and Davis1994; Miettinen et al. Reference Miettinen, Ralston and Fornasiero2010). An alternative to froth flotation is provided by the more efficient hydrophobic oil-binder techniques (Sirianni, Capes & Puddington Reference Sirianni, Capes and Puddington1969; Mehrotra et al. Reference Mehrotra, Sastry and Morey1983; van Netten, Moreno-Atanasio & Galvin Reference van Netten, Moreno-Atanasio and Galvin2014, Reference van Netten, Moreno-Atanasio and Galvin2016). These techniques, however, can be expensive due to large amount of oil required. More recently, an alternative binder method was proposed using a water-in-oil-in-water (W/O/W) emulsion containing salt-water droplets covered by semi-permeable, surfactant-stabilized oil layers (Galvin & van Netten Reference Galvin and van Netten2017; van Netten, Borrow & Galvin Reference van Netten, Borrow and Galvin2017; Sahasrabudhe et al. Reference Sahasrabudhe, DeIuliis, Davy and Galvin2021). In addition to using much less oil than other oil-binder techniques, this new method has been shown to be very efficient, as the permeability of the oil layer mitigates the lubrication forces between particle and droplet, allowing for an increased capture rate (Davis & Zinchenko Reference Davis and Zinchenko2018; Baysinger & Davis Reference Baysinger and Davis2021). Moreover, the expansion of the droplets, caused by an osmotic flux of water entering the droplet due to the presence of salt inside the droplets, also contributes to a higher collision efficiency (Roure & Davis Reference Roure and Davis2021b). However, the influx of fresh water dilutes the salt water just inside the droplets, which slows down the drop expansion and reduces the particle engulfment rate, so that the quantitative benefits of osmotic drop expansion on particle capture are unclear.
To better understand the physics underlying this novel particle-capture method, we focus on the investigation of binary interactions between droplets and particles. This type of two-particle analysis has been extensively used in the literature to investigate particle collision and agglomeration (e.g. Zeichner & Schowalter Reference Zeichner and Schowalter1977; Davis Reference Davis1984; Rother & Davis Reference Rother and Davis2001; Phan et al. Reference Phan, Nguyen, Miller, Evans and Jameson2003; Roure & Cunha Reference Roure and Cunha2018; Reboucas & Loewenberg Reference Reboucas and Loewenberg2021; Rother, Stark & Davis Reference Rother, Stark and Davis2022). More specifically, to model the different aspects involved in the novel agglomeration method by emulsion binders, the works by Davis & Zinchenko (Reference Davis and Zinchenko2018) and Roure & Davis (Reference Roure and Davis2021b) respectively investigated the effects of permeability and osmotic swelling on particle capture. The work by Davis & Zinchenko (Reference Davis and Zinchenko2018) presents analytical and asymptotic solutions for the hydrodynamic problem of a rigid particle interacting with a droplet covered with a semi-permeable film, and then uses the solution to investigate the collision efficiency of particles and non-expanding droplets. Roure & Davis (Reference Roure and Davis2021b) extended the investigation of collision efficiencies to the case of expanding droplets. In this context, the use of standard collision theory to calculate the collision efficiency ceases to be valid, and the collision efficiencies (as well as the collision kernels for the population dynamics) are time dependent. One of the main assumptions in the prior work is that the diffusion of salt inside the drop occurs instantly, corresponding to a small Péclet number. However, in most cases, the influx of fresh water and the non-instantaneous diffusion of salt from the drop centre to its interface diminish the concentration of salt at the inner drop interface, slowing down subsequent osmosis and drop expansion considerably. In recent works, this interplay between diffusion and expansion was investigated theoretically and experimentally (DeIuliis et al. Reference DeIuliis, Sahasrabudhe, Davis and Galvin2021, Reference DeIuliis, Sahasrabudhe, Davis, White and Galvin2022; Roure & Davis Reference Roure and Davis2021a). Roure & Davis (Reference Roure and Davis2021a) modelled the drop expansion as a diffusion problem with nonlinear, moving boundary conditions similar to those found in Stefan problems with kinetic undercooling (Evans & King Reference Evans and King2000; McCue et al. Reference McCue, Hsieh, Moroney and Nelson2011; Back et al. Reference Back, McCue, Hsieh and Moroney2014). For high Péclet numbers, the theoretical calculations predict a low-concentration boundary layer near the drop interface, which substantially slows drop expansion. The results from the expansion-diffusion model have shown good agreement with experimental results for osmotic swelling of W/O/W emulsion binders (DeIuliis et al. Reference DeIuliis, Sahasrabudhe, Davis and Galvin2021, Reference DeIuliis, Sahasrabudhe, Davis, White and Galvin2022).
The main goal of this paper is to quantify the effects of slow diffusion on the capture of particles by swelling droplets, extending the results of Roure & Davis (Reference Roure and Davis2021b) to the case where diffusion limitations slow down drop expansion. To this end, we investigate the dynamics of a rigid spherical particle near a spherical drop with a semi-permeable interface that expands due to osmosis in an external, pure-extensional flow field. To model the diffusion-limited osmotic swelling of the droplet, we use our diffusion-expansion model presented previously (Roure & Davis Reference Roure and Davis2021a), which is then coupled to the set of dynamical equations governing the relative particle trajectory. By performing multiple trajectory simulations, we calculate the transient collision efficiencies, which can be used to determine the collision kernel for population dynamics. We are especially interested in determining if, and by how much, the collision efficiency for very small particles is increased by osmotic expansion of droplets, potentially overcoming the limitations of froth flotation.
2. Methods
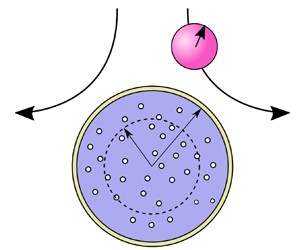
To investigate the capture dynamics of particles, we focus on the binary interactions between particles and droplets, as done by Davis & Zinchenko (Reference Davis and Zinchenko2018) and Roure & Davis (Reference Roure and Davis2021b). The particle and droplet are both spherical and interact in a surrounding linear flow with conditions of creeping flow (small Reynolds number). A sketch of the problem is shown in figure 1. For the non-dimensionalization of the problem, we follow the same procedure used previously (Roure & Davis Reference Roure and Davis2021b). Namely, we use the inverse shear rate  $\dot {\gamma }^{-1}$ as the characteristic time scale and the initial drop radius,
 $a_{i}$, as the characteristic length scale.
Sketch of the binary interaction model between a spherical particle and a semi-permeable drop in the presence of an external linear flow. The presence of salt inside the droplet leads to its swelling, which can be mitigated by a slow diffusion of salt inside the drop. The dashed circle represents the starting configuration of the droplet, with starting radius  $a_i$. The drop radius
 $a_d$ changes with time as the drop expands due to the water permeation caused by osmosis.

For modelling the binary interactions between particles and drops, we consider the particle and drop to be free of net forces and torques (i.e. a mobility problem). Attractive forces, such as van der Waals or hydrophobic interactions, are neglected, as it is anticipated that permeation of fluid into the drop will reduce the lubrication resistance to allow for contact without attractive forces (Davis & Zinchenko Reference Davis and Zinchenko2018). Also, as done previously (Roure & Davis Reference Roure and Davis2021b), we focus our analysis on the case where the external flow is given by a uniaxial extensional flow having inflow along the  $z$ axis, with
 $\boldsymbol {u}^{\infty } = \boldsymbol {E}^{\infty } \boldsymbol {\cdot } \boldsymbol {x}$ and
 $\boldsymbol {E}^{\infty } = \dot {\gamma }(\boldsymbol {\hat {e}}_x \boldsymbol {\hat {e}}_x + \boldsymbol {\hat {e}}_y\boldsymbol {\hat {e}}_y - 2 \boldsymbol {\hat {e}}_z\boldsymbol {\hat {e}}_z)$, where
 $\boldsymbol {x} = (x,y,z) \equiv r \ \boldsymbol {\hat {e}}_r$ is the position vector with origin at the centre of the drop. In this context, the non-dimensional governing equations for the relative motion of the solid particle, in Cartesian coordinates, are (Batchelor & Green Reference Batchelor and Green1972b)
 \begin{equation} \left. \begin{aligned} {{\rm d}\kern0.7pt x}/{\rm d}t & = \phantom{-2}(1-B)x + E\ x, \\ {{\rm d} y}/{\rm d}t & = \phantom{-2}(1-B)y + E\ y\quad \text{and}\\ {\rm d}z/{\rm d}t & ={-}2(1-B)z + E\ z, \end{aligned} \right\} \end{equation}
where
 \begin{equation} E = (B-A)(x^2+ y^2 - 2 z^2)/r^2, \end{equation}
and  $A(r,t)$ and
 $B(r,t)$ are the mobility functions, which account for the hydrodynamic interactions between the particle and drop. These functions depend on the centre-to-centre separation
 $r$ and on physical and geometric parameters such as oil-layer permeability
 $K$ (more specifically, its non-dimensional counterpart
 $K^* \equiv K \mu / a_i$, where
 $K$ is the ratio between permeate flux and pressure difference across the oil layer and
 $\mu$ is the dynamic viscosity of the surrounding fluid, which we consider to be the same as the inner solution) and the ratio between radii
 $a_d/a_p$, which changes over time as the drop swelling occurs. As shown previously (Roure & Davis Reference Roure and Davis2021b), although the system of differential equations in (2.1) is non-autonomous, the only dependence of the mobilities on time comes from a quasi-steady contribution of the radius change, as the drop expands quiescently, without changing the boundary conditions, allowing us to use the mobility calculations of Davis & Zinchenko (Reference Davis and Zinchenko2018) for a non-expanding permeable drop. Hence, the system of equations in (2.1) must be supplemented with an equation for the drop radius evolution.
In our previous work (Roure & Davis Reference Roure and Davis2021b), the assumption that the salt inside the drop diffused instantly (so that the salt concentration remained uniform throughout the drop volume but slowly declined with time due to dilution by the influx of fresh water) allowed us to simplify the problem and to find an explicit equation for the drop radius as a function of time. However, in practical situations, inner salt-diffusion effects play an important role in the drop swelling process, as observed experimentally by DeIuliis et al. (Reference DeIuliis, Sahasrabudhe, Davis and Galvin2021). To model the swelling problem, we consider that the diffusion of salt inside the drop occurs faster than the inner flow. Note that in the fast-agglomeration process, the ‘drop’ is actually a binder fragment composed of many tiny emulsion drops that damp out inner flow and exhibit an effective diffusivity that is lower than the molecular diffusivity (van Netten et al. Reference van Netten, Borrow and Galvin2017; DeIuliis et al. Reference DeIuliis, Sahasrabudhe, Davis and Galvin2021). Hence, the diffusion of salt is governed by a standard diffusion equation, with a boundary condition at the moving boundary  $r = a_d(t)$ related to the influx of water due to the jump in osmotic pressure driven by the salt concentration at the interface. Moreover, we also consider that the diffusion problem retains a spherical symmetry and that there are no convective currents (i.e. the salt is sufficiently dilute that a buoyancy-driven flow does not come into play). Hence, we couple the system of (2.1) with the following diffusion-expansion problem:
 $$\begin{gather} \frac{\partial c}{\partial t} = \frac{\text{Eg}}{{\textit{Pe}}} \ \frac{1}{r^2} \frac{\partial}{\partial r} \left( r^2 \frac{\partial c}{\partial r} \right), \end{gather}$$
 $$\begin{gather}\frac{{\rm d}a}{{\rm d}t} = \text{Eg} \ c|_{r = a_d(t)}, \end{gather}$$
with initial and boundary conditions given by
 \begin{equation} \left. \begin{aligned} & a(0) = 1 , \ c(r,0) = 1, \\ & \partial c / \partial r|_{r = 0} = 0, \\ & \partial c / \partial r|_{r = a_d(t)} ={-} {\textit{Pe}} \ c^2|_{r = a_d(t)}. \end{aligned} \right\} \end{equation}
The initial and boundary conditions presented in (2.5) respectively correspond to the initial drop radius, initially uniform salt concentration inside the droplet, axisymmetry of the problem, and the osmotic water permeation through the interface (Roure & Davis Reference Roure and Davis2021a). Note that the salt concentration  $c$ is made dimensionless by the initial uniform concentration
 $c_i$. The non-dimensional parameters
 $\textrm {Eg} = KRTc_i/(\dot {\gamma } a_i)$ and
 ${\textit {Pe}} = KRT c_i a_i/ D$, are respectively the engulfment parameter and the Péclet number. Note that an ideal solution is assumed and that the water outside the drop is salt-free, so that
 $RTc_e$ is the osmotic pressure difference across the film, where
 $c_e = c|_{r=a_d(t)}$ is the salt concentration inside the drop adjacent to the inner edge of the film. Here,
 $c_i$ is the initial salt concentration inside the drop (assumed uniform),
 $D$ is the inner salt effective diffusivity,
 $T$ is the absolute temperature, and
 $R$ is the ideal gas constant. The engulfment parameter Eg, first introduced in our previous work (Roure & Davis Reference Roure and Davis2021b), is a ratio between the characteristic flow time and the initial drop expansion time. The name was chosen due to an analogy to phase-transition problems, where particles are engulfed by a solidifying or freezing interface as it advances. The Péclet number defined here is not the traditional ratio of convection and diffusion, but rather it measures the ratio between the diffusion and initial drop-expansion characteristic times. Equations (2.3) and (2.4) together with the boundary conditions (2.5) constitute a moving-boundary problem. The absence of convective terms in (2.3) indicates that the drop expansion is independent of the particle dynamics. If that was not the case, the set of differential equations (2.1) and equations (2.3) and (2.4) would have to be solved simultaneously, even under the consideration of a quasi-stationary, passive drop expansion. Note that the effect of osmosis alone is for the interface of the drop to expand passively through the surrounding fluid, without causing internal flow (Roure & Davis Reference Roure and Davis2021b). Thus, the potential sources of inner flow are from the motion of a nearby particle, which would be very small for
 $K^* \ll 1$, or from density differences due to the salt concentration gradient inside the drop.
2.1. Trajectory simulations
For calculation of relative particle trajectories, we solve the system of (2.1) numerically using a fourth-order Runge–Kutta scheme with an adaptive time step. The drop expansion, governed by (2.3) and (2.4), is calculated in advance using the finite-difference scheme we described previously (Roure & Davis Reference Roure and Davis2021a) and then tabulated and used as an input in the kinematic calculations. To find the precise time of collision, we perform a linear extrapolation of the trajectory right before the numerical overlap step or for separations smaller than a given threshold. This last time increment is given by  $\max \{ 0, \delta t_{col} \}$, with
 \begin{equation} \delta t_{col} = \begin{cases} (r^2 - R^2)/(2(\dot{a}_d R - \boldsymbol{r} \boldsymbol{\cdot} \boldsymbol{V} )) & \text{if }V = \dot{a}_d,\\ \dfrac{\dot{a}_d R - \boldsymbol{r} \boldsymbol{\cdot} \boldsymbol{V} -\sqrt{(\dot{a}_d R - \boldsymbol{r} \boldsymbol{\cdot} \boldsymbol{V} )^2 - (r^2 - R^2)(V^2 - \dot{a}_d^2)}}{V^2 - \dot{a}_d^2} & \text{if }V \ne \dot{a}_d, \end{cases} \end{equation}
where  $R(t) = a_d(t) + a_p$,
 $\boldsymbol {V}$ is the relative particle velocity and
 $V = \|\boldsymbol {V}\|$. If the imaginary part of
 $\delta t_{col}$ is non-zero, the particle does not collide with the drop.
One of the greatest challenges faced in the simulations performed in our previous work (Roure & Davis Reference Roure and Davis2021b) was to obtain precise values for the collision volume, which required a high resolution of the function  $t_{col}(\boldsymbol {x})$ to be interpolated. However, using the analytical expressions for the mobilities, which are given in terms of infinite series, leads to high computational times, which made it hard to achieve such high resolution, considering that the numerical calculation of
 $t_{col}$ is of order
 $O(h^{-2})$, where
 $h$ is the space step. Hence, in that paper, we had to filter the noise of the function
 $V_{col}(t)$ before taking its time derivative to calculate the collision efficiency, which led to small discrepancies with theoretical results.
To overcome this issue, we incorporated the near- and far-field asymptotic expressions of Davis & Zinchenko (Reference Davis and Zinchenko2018) for small and large separations, respectively. The constants present in the expressions for the near-field mobilities had to be tabulated for different size ratios, as the ratio between the drop and particle radii changes with time during the simulation. Moreover, we also tabulated the analytical values of the mobilities for intermediate separations. These tabulations made the code approximately  $200{\times }$ faster, which allowed us to improve the resolution of the function
 $t_{col}(\boldsymbol {x})$ and to get rid of the smoothing step, obtaining more precise results.
Figure 2 shows numerical results for the relative particle trajectories for  $K^* = 10^{-4}$,
 $a_p = 0.5$ and different initial conditions. Figure 2(a) shows the results for a non-expanding droplet. In this case, none of the simulated trajectories leads to a collision with the droplet. In contrast, as can be seen in figure 2(b), which shows results for an expanding drop with
 $\textrm {Eg} = 2.0$ and
 ${\textit {Pe}} = 0$, the particles starting at
 $x = 0.2$,
 $0.4$ and
 $0.6$ are captured by the droplet.
Numerical results for the relative particle trajectories for  $K^* = 10^{-4}$,
 $a_p = 0.25$,
 $y_0 = 0$,
 $z_0 = 4.0$ and
 $x_0 = 0.2$,
 $0.4$,
 $0.6$ and
 $0.8$ (left to right): (a) result for a non-expanding droplet and (b) result for an expanding drop with
 $\textrm {Eg} = 2.0$ and
 ${\textit {Pe}} = 0$. Although the trajectories all have the same starting position, more particles are captured in the presence of swelling. The dashed semi-circles in panel (b) are the drop interfaces at the time of capture.

The results shown in figure 2 indicate that the main advantage of drop swelling capture is that it enables the capture of particles that would not be captured otherwise. For non-expanding droplets in a purely extensional flow, there is a region at the adjacency of the droplet where particles do not get captured, even when close to the droplet. The presence of drop swelling, however, can improve the capture of such particles. One way to quantify this improvement is to investigate the motion of particles in the  $xy$ plane. Figure 3 shows numerical results of the separation gap
 $s(t) = r(t) - R(t)$, where
 $r$ is the centre-to-centre distance and
 $R(t) = a_d(t) +a_p$ is the sum of the drop and particle radii versus time for particles in the
 $xy$ plane (i.e. at
 $z = 0$) for
 $a_p = 0.5$,
 $K^* = 10^{-4}$,
 ${\textit {Pe}} = 0$: (a)
 $\textrm {Eg} = 0$; (b)
 $\textrm {Eg} = 0.25$; (c)
 $\textrm {Eg} = 0.5$ and (d)
 $\textrm {Eg} = 1.0$ for different starting positions. For small values of the engulfment parameter Eg, particles starting on this plane do not get captured. However, for values of Eg above a certain threshold, we see the formation of an annular region with thickness
 $\delta$ where the particles get captured. This capture layer appears in theoretical studies of the collision efficiency of froth flotation (Yoon & Luttrell Reference Yoon and Luttrell1989; Loewenberg & Davis Reference Loewenberg and Davis1994), and it is directly related to the collision efficiency. For the froth flotation process, this layer appears because of the presence of attractive forces, as lubrication forces would impede particle collision from these regions otherwise. For our system, however, the existence of this adjacency layer happens because of drop expansion, even in the absence of attractive forces. The thickness of the capture layer, which corresponds to the bifurcation point in the diagrams in figure 3, depends on the physical parameters of the problem.
Separation gap versus time for particles starting in the  $xy$ plane (i.e. at
 $z = 0$) for
 $a_p = 0.5$,
 $K^* = 10^{-4}$,
 ${\textit {Pe}} = 0$: (a)
 $\textrm {Eg} = 0$; (b)
 $\textrm {Eg} = 0.25$; (c)
 $\textrm {Eg} = 0.5$ and (d)
 $\textrm {Eg} = 1.0$ for different starting positions. For values of Eg above a threshold given by
 $R(0)(1 - A_0)$, there is a bifurcation in the behaviour of the system, indicated by the formation of the lateral capture layer with thickness
 $\delta =$ (b) 0.04, (c) 0.083 and (d) = 0.163.

2.2. Calculation of collision efficiency
The main goal of our simulations is to calculate the collision efficiency between the particle and drop. The collision efficiency is defined as the ratio between the pair collision rate over the ideal pair collision rate (i.e. the collision rate in the absence of any interparticle interaction, where the particles are brought together by the external flow field). As discussed previously (Roure & Davis Reference Roure and Davis2021b), for an initially uniform pair distribution function, the collision efficiency in an extensional flow can be calculated by
 \begin{equation} E_{col}(t) = \frac{3 \sqrt{3}}{8 {\rm \pi}R_0^3} \frac{{\rm d} |V_{col}|}{{\rm d}t}, \end{equation}
where  $R_0 = R(0) = a_i + a_p$ and
 $|V_{col}(t)|$ is the volume of the region
 $V_{col}$, which consists of starting points of trajectories that lead to a collision with the drop in a time less than or equal to
 $t$. Note that the collision efficiency is defined as the ratio of the actual collision rate to the collision rate due to external flow for no drop expansion and with hydrodynamic and molecular interactions neglected. We also define the collision area
 $A_{col}(t)$ as being the surface formed by the starting points of trajectories that will lead to a collision in a time
 $t$. The relationship between
 $A_{col}$ and
 $V_{col}$ is
 \begin{equation} V_{col}(t) = \bigcup_{\tau \le t} A_{col}(\tau). \end{equation}
In many situations, the collision area  $A_{col}(t)$ coincides with the external boundary of
 $V_{col}$, which we call
 $A^*_{col}$. We note that in our previous work (Roure & Davis Reference Roure and Davis2021b), the surface defined as
 $A_{col}$ is the
 $A^*_{col}$ defined in this paper. However, the two coincide for all cases considered in that paper. Another definition of interest is the one of the collision surfaces
 $S_{col}(t)$, which we define as the region of the collision sphere (i.e. the sphere with radius
 $R(t) = a_d(t)+a_p$) that is capable of capturing particles (i.e.
 $\boldsymbol {V}\boldsymbol {\cdot }\boldsymbol {\hat {n}}|_{S_{col}(t)} < \dot {a}(t)$). This definition is a generalization of
 $S_{col}$, which we defined previously in Roure & Davis (Reference Roure and Davis2021b). Namely,
 $S_{col} = S_{col}(0)$. There is a clear relationship between
 $S_{col}(t)$ and
 $A_{col}(t)$; if we consider the time-evolution function
 $\psi _t$ related to the dynamical system (2.1), such that
 $\psi _t(\boldsymbol {x}(0)) = \boldsymbol {x}(t)$, we have
 $\psi _t(A_{col}) = S_{col}(t)$ or, alternatively,
 $\psi _t^{-1}(S_{col}(t)) = A_{col}(t)$. These geometries, as well as the geometrical relationship between
 $A_{col}(t)$ and
 $S_{col}(t)$, are illustrated in figure 4. This geometrical relationship helps us understand why, in some cases, the surfaces
 $A_{col}$ and
 $A^*_{col}$ differ from each other, as previously stated. Namely, for an expanding droplet with sufficiently high Eg, for which
 $A^*_{col}$ is path-connected, as the drop expansion diminishes with time, a no-capture region begins to form at the adjacency of the collision surface at large times, breaking the path-connectedness of
 $S_{col}(t)$ and, by consequence,
 $A_{col}(t)$.
Sketch of the different geometries involved in the collision volume analysis and the relationship between them. Here,  $V_{col}$ is the volume composed of starting points of trajectories that lead to a collision in a time
 $\tau \le t$,
 $A_{col}$ is the surface composed by starting points of trajectories that lead to a collision in a time
 $t$,
 $S_{col}$ is the region of the collision sphere that is able to capture particles at a time
 $t$ and
 $\psi _t$ is the time-evolution operator of the dynamical system.

This relationship between  $A_{col}$ and
 $S_{col}$ can be used to calculate the collision volume by reversing the dynamical system (i.e. by solving
 $\textrm {d}\boldsymbol {r}/\textrm {d}t = -\boldsymbol {V}(\boldsymbol {r},T-t)$ using the points in
 $S_{col}(t)$ as starting positions) and then using
 $A_{col}(t)$ to calculate
 $A^*_{col}(t)$ and
 $V_{col}(t)$. Such a procedure was used in our previous work (Roure & Davis Reference Roure and Davis2021b) to calculate the transient collision efficiency for non-expanding droplets, where
 $A_{col}(t) = A^*_{col}(t)$ and the time evolution operators form a one-parameter subgroup. Another method of calculation of
 $A^*_{col}(t)$, also used previously (Roure & Davis Reference Roure and Davis2021b), was to calculate, via numerical interpolation, the level sets
 $t_{col}(\boldsymbol {x}) = t$, where
 $t_{col}(\boldsymbol {x})$ is the collision time of a trajectory starting at
 $\boldsymbol {x}$.
An alternative expression for the collision efficiency can be given in terms of a surface integration over  $S_{col}$, such that:
 \begin{equation} E_{col}(t) ={-} \frac{3 \sqrt{3}}{8 {\rm \pi}R(0)^3} \int_{S_{col}(t)} f(\boldsymbol{x},t) \boldsymbol{\hat{n}} \boldsymbol{\cdot} \left(\boldsymbol{V} - \boldsymbol{V}^S\right) \,{\rm d}S, \end{equation}
where  $f(\boldsymbol {x},t)$ is the pair distribution function,
 $\boldsymbol {\hat {n}}$ is the outward normal unit vector and
 $\boldsymbol {V}^S$ is the interface velocity. For a non-expanding drop, where
 $S_{col}(t) = S_{col}(0) = S_{col}$ and
 $\boldsymbol {V}^S \boldsymbol {\cdot } \boldsymbol {\hat {n}} = \boldsymbol {0}$, this expression can also be used to calculate the steady-state collision efficiency, which coincides with the expression obtained by Davis & Zinchenko (Reference Davis and Zinchenko2018). However, for transient systems, this expression requires the knowledge of the pair distribution function, which is governed by the Liouville equation:
 \begin{equation} \frac{\partial f}{\partial t} + \boldsymbol{\nabla} \boldsymbol{\cdot} \left( \boldsymbol{V} f\right) = 0, \end{equation}
with initial condition  $f(\boldsymbol {x},0) = f_0(\boldsymbol {x})$. In our previous work (Roure & Davis Reference Roure and Davis2021b), we provided a semi-analytical, transient solution of (2.10) for the case of non-expanding drops. For expanding droplets, such a transient solution ceases to be valid, as it is not possible to re-write the equation in the integrable form presented by Batchelor & Green (Reference Batchelor and Green1972a). However, it is still possible to obtain a semi-analytical solution of (2.10). Namely, the pair distribution function is given by
 \begin{equation} f(\boldsymbol{x},t) = f_0(\boldsymbol{x}) |d\psi_t^{{-}1}|, \end{equation}
where  $|d\psi _t^{-1}|$ is the Jacobian of the inverse of the time evolution function
 $\psi _t$. This relationship comes directly from the conservation form of (2.10). Similar relationships between the pair distribution function and the Jacobian of the time evolution operator have appeared before in works concerning the statistical mechanics of non-Hamiltonian systems (Tuckerman, Mundy & Martyna Reference Tuckerman, Mundy and Martyna1999; Ezra Reference Ezra2004). For an initially uniform pair-distribution function, the relationship reduces to
 \begin{equation} f(\boldsymbol{x},t) = |d\psi_t^{{-}1} (\boldsymbol{x})|. \end{equation}
As previously discussed, we can approximate the inverse time-evolution function by numerically solving the reverse dynamical system. Hence, we can obtain a numerical approximation for the Jacobian  $|d\psi _t^{-1} (\boldsymbol {x})|$ and, thus, the pair distribution function
 $f(\boldsymbol {x},t)$ by considering the deformation of a small square element by the reverse dynamical system. This method used for the numerical calculation of the Jacobian is somewhat similar to techniques used in dynamical systems to calculate Lyapunov exponents (Sandri Reference Sandri1996; Cvitanovic et al. Reference Cvitanovic, Artuso, Mainieri, Tanner, Vattay, Whelan and Wirzba2005).
Figure 5 shows numerical results for the pair distribution function calculated by the aforementioned method. For the simulations, we used  $K^* = 10^{-4}$,
 ${\textit {Pe}} = 0$,
 $a_p = 0.5$, and (a)
 $\textrm {Eg} =0$ and (b)
 $\textrm {Eg} =1$. We also evaluated the results at the surface of a sphere of radius
 $R(t) + 0.01$ (i.e. close to the collision sphere of radius
 $R(t)$). This small shift in radius is motivated by the fact that the probability distribution at the surface of the collision sphere can reach very high values, as expected from theoretical calculations, resulting in a less-detailed visualization. Like the results presented previously for non-expanding droplets, we observe the formation of a high-probability region at the top of the sphere (i.e. at the collision region), represented by the bright yellow region in figure 5(a). In the same figure 5(a), we also notice a dark region, where
 $f(\boldsymbol {x},t) = 0$ for non-zero times. This region is associated with the wake region predicted by Wilson (Reference Wilson2005) and observed in our previous transient simulations (Roure & Davis Reference Roure and Davis2021b). The increase of the pair-distribution function at the top of the collision region for non-expanding spheres explains the transient increasing behaviour of the collision efficiency observed in the previous numerical simulations.
Numerical results for the pair distribution function  $f(\boldsymbol {x},t)$ for
 $K = 10^{-4}$,
 ${\textit {Pe}} = 0$,
 $a_p = 0.5$: (a)
 $\textrm {Eg} =0$ and (b)
 $\textrm {Eg} =1$. The results shown in the figure are evaluated at the surface of a sphere of radius
 $R(t) + 0.01$. For
 $\textrm {Eg} =0$, there is a zero-probability region corresponding to the wake region. For non-zero values of Eg, the formation of such a region only occurs at larger times.

In contrast, the results shown in figure 5(b) for expanding spheres with  $\textrm {Eg} =1$ show lower values of the pair distribution function when compared to the non-expanding droplets. However, the increase in capture area (as well as surface area) together with a non-zero surface velocity, adds a positive contribution
 $E_{col}(t)|_{{Eg}}$ to the collision efficiency, where
 \begin{equation} E_{col}(t)|_{{Eg}} = \frac{3 \sqrt{3}}{8 {\rm \pi}R(0)^3} \int_{S_{col}(t)} f(\boldsymbol{x},t) \boldsymbol{V}^S \boldsymbol{\cdot} \boldsymbol{\hat{n}} \,{\rm d}S, \end{equation}
resulting in a higher overall collision efficiency when compared to the one of non-expanding droplets. This contribution, however, decays with time, as the surface velocity slows down with time due to dilution of the salt water inside the drop. For  ${\textit {Pe}} = 0$, the decrease occurs slowly, whereas for high Péclet numbers, the decrease in expansion rate can occur fast, resulting in a short-time transition between engulfment-dominated and flow-dominated capture, as we will show in § 3.2.
The physics behind this sharp decay can be better understood by analysing the short-time behaviour of the collision efficiency, given by (2.9). Namely, for sufficiently high values of Eg, such that  $S_{col}(0)$ and
 $S_{col}(\delta t)$ are the whole surfaces of spheres with radii
 $R(0)$ and
 $R(\delta t)$, respectively, and considering an initially uniform pair distribution function, we can obtain an asymptotic expression for (2.9) such that
 \begin{equation} E_{col}(\delta t) \sim \frac{3 \sqrt{3}}{2 R(0)} \left[ \dot{a}_d(0) + \delta t \left( \ddot{a}_d(0) - \frac{4 R(0)^2}{5} \beta + \frac{2 \dot{a}_d(0)^2}{R(0)} \right) \right], \end{equation}
where
 \begin{equation} \beta = \left(1 - A_0\right)\left( \frac{3}{R(0)} (A_0 - B_0) + \left. \frac{\partial A}{\partial r} \right|_{r = R(0), t = 0}\right), \end{equation}
and  $A_0$ and
 $B_0$ are the values of the mobility functions
 $A$ and
 $B$, respectively, evaluated at the surface of the sphere of radius
 $R(0)$ at
 $t=0$. In (2.14), the leading order is equal to the initial value of the collision efficiency predicted by Roure & Davis (Reference Roure and Davis2021b), as expected. Moreover, if the order
 $O(\delta t)$ term related to the flow (i.e. the first-order term containing
 $\beta$) is zero, this expansion is compatible with the pure-engulfment collision efficiency obtained in the same paper, indicating that the contributions from the terms
 $\ddot {a}_d(0)$ and
 $2\dot {a}_d(0)^2/R(0)$ are purely due to drop expansion. Note that the flow term at order
 $O(\delta t)$ does not depend on the swelling dynamics of the drop, which indicates that both effects (flow and expansion) are uncoupled at
 $t = 0$. However, as the swelling dynamics influences the time evolution of the pair-distribution function, the effects of flow and swelling start to blend as time proceeds. The derivation of (2.14) can be made by performing a change of variables from
 $R(\delta t)$ to
 $R(0)$, followed by a regular expansion of both the integrand and the Jacobian in powers of
 $\delta t$. Then, we use the fact that the integrals
 \begin{gather} \int_{S_{col}(0)} V_r|_{t = 0} \,{\rm d}S, \end{gather}
 \begin{gather} \int_{S_{col}(0)} \partial V_r / \partial r|_{t = 0} \, {\rm d}S \end{gather}
and
 \begin{gather} \int_{S_{col}(0)} \partial V_r / \partial t|_{t = 0} \, {\rm d}S, \end{gather}
all vanish when integrated over the whole sphere (here,  $V_r \equiv \boldsymbol {V}\boldsymbol {\cdot } \boldsymbol {\hat {e}}_r$). In (2.14), the term
 $\ddot {a}_d(0)$, which is the initial radial acceleration of the drop radius, gives a negative contribution to the first order of
 $E_{col}(\delta t)$. For
 ${\textit {Pe}} = 0$, this term is equal to
 $- 3 \dot {a}_d(0)^2 = -3 \textrm {Eg}^2$, which is larger in magnitude than the last term, resulting in an overall decreasing behaviour for the collision efficiency from engulfment. For high Péclet numbers, the absolute value of
 $\ddot {a}_d(0)$ can be very large. In fact, the second derivative of the short-time expansion in our earlier work (Roure & Davis Reference Roure and Davis2021a) is singular at
 $t = 0$, indicating that although the initial value of the collision efficiency is not affected by the Péclet number, there is a sharp decay of
 $E_{col}$ for
 ${\textit {Pe}} \gg 1$ at very short times (physically, this decay occurs because of the sharp reduction in salt concentration and, hence, osmotic expansion rate when diffusion of salt from the drop interior to its inner edge is slow). For
 ${\textit {Pe}} = 0$, we can use this short-time expansion to determine the critical value of engulfment, Eg
 $^*$, for which the particle capture at short times will transition from flow dominated to engulfment dominated. Namely, this transition happens when the term of order
 $O(\delta t)$ (i.e. the derivative of the collision efficiency at
 $t = 0$) changes sign. Hence, if Eg
 $^*$ exists, it is given by
 \begin{equation} \text{Eg}^* = \left( \frac{4 R(0)^3\beta}{5\left(2 - 3 R(0)\right)} \right)^{1/2}. \end{equation}
When drop expansion happens slowly compared to the imposed flow velocity, it is also expected that for long times, the pair distribution function  $f(\boldsymbol {x},t)$ will converge to a quasi-steady-state limit similar to the analytical expression by Batchelor & Green (Reference Batchelor and Green1972a),
 $f(\boldsymbol {x},t) \sim (1 - A_t(R(t)))^{-1} \phi _t(R(t))$, where
 $A_t(R(t))$ is a shorthand notation for the mobility at time
 $t$ evaluated at
 $r = R(t)$ and we define
 $B_t(R(t))$ in the same way. Similarly,
 $\phi _t$ is the function
 $\phi$, defined by
 \begin{equation} \phi(r) = \exp\left( \int_{r}^{\infty} \frac{A(r') - B(r')}{1 - A(r')} \frac{dr'}{r'} \right), \end{equation}
evaluated at time  $t$ (i.e. using the mobilities
 $A_t$ and
 $B_t$ instead of
 $A$ and
 $B$). Hence, by plugging the quasi-steady pair distribution into (2.9), we can derive an expression for the quasi-steady collision efficiency, given by
 \begin{equation} E_{col} (t) \sim \frac{3 \sqrt{3}}{2 \left[\phi_t (R (t))\right]^3} \left( \frac{R (t)}{R (0)} \right)^3 \left[ (\cos (\alpha) - \cos (\alpha)^3) + \frac{\dot{a}}{R (t)} \frac{(1 - \cos (\alpha))}{{1 - A_t} (R (t))} \right], \end{equation}
where  $\alpha (t)$ is the angle determining the collision region at time
 $t$. Similarly to in our previous work (Roure & Davis Reference Roure and Davis2021b), we have
 \begin{equation} \cos(\alpha) = \begin{cases} \dfrac{1}{\sqrt{3}} \left(1 - \dfrac{\dot{a}(t)}{R(t)(1-A_t(R(t)))}\right)^{1/2} & \text{for }\dot{a}(t) \le R(t)(1-A_t(R(t))),\\ 0 & \text{for }\dot{a}(t) \ge R(t)(1-A_t(R(t))). \end{cases} \end{equation}
For non-expanding droplets, where  $R(t) = R(0)$ and
 $\cos (\alpha ) = 1/\sqrt {3}$, the analysis yields
 $E_{col} = \phi (R(0))^{-3}$, as expected.
3. Results and discussion
3.1. Drop expansion
Before presenting the results for the collision efficiency, we discuss some of the numerical results related to the diffusion-limited swelling of droplets. These results for the expansion kinetics of a drop are tabulated and used as inputs for the mobility simulations.
Figure 6 shows numerical results for the evolution of the salt concentration profile inside a drop for (a)  ${\textit {Pe}} = 2$ and (b)
 ${\textit {Pe}} = 200$. These results were obtained by the finite-difference scheme proposed previously (Roure & Davis Reference Roure and Davis2021a). For large Péclet numbers (i.e. slow salt diffusion), the concentration profile remains unaltered at the central portion of the droplet and all diffusive effects are confined to a boundary-layer region, as described previously (Roure & Davis Reference Roure and Davis2021a). The increase in Péclet number leads to a lower concentration of salt at the drop surface, resulting in a slower drop expansion, as seen in the results shown in figure 7. Namely, as diffusion occurs slowly, the flux of salt from the centre to the inner drop surface (where the salt water is diluted by the influx of fresh water) requires a large concentration gradient and balances a reduced osmotic expansion rate (due to the lower salt concentration).
Evolution of the salt concentration profile for (a)  ${\textit {Pe}} = 2$ and (b)
 ${\textit {Pe}} = 200$ and times
 $t = 0.1$,
 $0.2$,
 $0.3$,
 $0.4$ and
 $0.5$. For high Péclet numbers, the diffusion effects are constrained to a concentration boundary layer, as predicted in our previous work (Roure & Davis Reference Roure and Davis2021a). The vertical dashed lines are the drop radii at the specific time.

Radial evolution of a spherical droplet size for different Péclet numbers. As the diffusion becomes slower, the salt concentration at the drop surface diminishes, reducing the osmotic influx and leading to a slower expansion.

3.2. Collision efficiency
In addition to the Péclet number and the engulfment parameter, there are other physical parameters that influence particle capture, such as the non-dimensional permeability  $K^*$ and particle size
 $a_p$. In practice, a large range of parameter values is possible. Davis & Zinchenko (Reference Davis and Zinchenko2018) estimated
 $K^*$ values in the ranges of
 $10^{-6}$ to
 $10^{-4}$ for small drops and particles with reduced radii of 1–100
 $\mathrm {\mu }$m in water, whereas even smaller values may be estimated from experiments with larger (millimetre-sized) agglomerates (DeIuliis et al. Reference DeIuliis, Sahasrabudhe, Davis and Galvin2021; Roure & Davis Reference Roure and Davis2021a). These same experiments yielded
 ${\textit {Pe}} = O(10^2-10^3)$, but smaller values are expected for smaller drops (Roure & Davis Reference Roure and Davis2021a). The engulfment parameter can be recast as
 $\textrm {Eg} = K^* RT c_i/(\mu \dot {\gamma })$ and so can take on a wide range of values of
 $O(1)$ or less. Similarly, since drops (or bubbles) typically capture smaller particles,
 $a_0 < 1$ is expected.
Roure & Davis (Reference Roure and Davis2021b) determined collision efficiencies for the case of fast inner diffusion (i.e.  ${\textit {Pe}} = 0$) and relatively large particles (
 $0.25 \le a_p \le 1$). In this section, we consider more realistic scenarios of
 $0 \le {\textit {Pe}} \le 200$,
 $K^* = 10^{-6}$ and
 $10^{-4}$,
 $0 \le \textrm {Eg} \le 3$ and
 $0.05 \le a_p \le 1$. The larger values of
 ${\textit {Pe}}$ allow us to examine the degree to which diffusion limitations slow the drop expansion and collision efficiency, while the smaller size ratios allow us to examine the effectiveness of engulfment due to drop expansion in capturing very fine particles.
Figure 8 shows numerical results for the collision efficiency for  $a_p = 0.5$,
 $\textrm {Eg} =1$ and
 ${\textit {Pe}} = 0.1$,
 $5$,
 $25$ and
 $200$. The solid curves in figure 8 represent the results for
 $K^* = 10^{-4}$, whereas the dashed curves are the results for
 $K^* = 10^{-6}$. Though difficult to see, the initial value of collision efficiency for all cases is the same,
 $E_{col} = \sqrt {3}$, as given by the theoretical expression in (2.14). As in our previous work, where we observed a decreasing collision efficiency versus time in expansion-dominated capture, a similar trend is observed here. As expected from the discussion presented in § 3.2, it is noted that an increase in Péclet number also results in a sharper decay of the collision efficiency at short times due to the rapid reduction in drop expansion with slow salt diffusion. This initial decay is noticeably sharp in the cases where the Péclet number is large, as there is a fast depletion of salt at the drop surface. The short-time region of the curves in figure 8 display a similar behaviour to our previous results for the evolution of salt concentration at the drop interface (Roure & Davis Reference Roure and Davis2021a). This result is expected, as the salt concentration at the interface is the main driver behind the osmotic swelling. However, in contrast to the salt depletion at the interface, the collision efficiency curves are not necessarily monotonically decreasing. Namely, for high Péclet numbers, as time increases, it is possible to observe an increasing behaviour of the collision efficiency, which is characteristic of flow-dominated capture. This behaviour occurs when the characteristic time of the initial sharp decay of salt concentration at the interface is much smaller than the characteristic flow time. In the limit of
 ${\textit {Pe}} \to \infty$, we expect
 $\textrm {d}E_{col}/\textrm {d}t|_{t=0}$ in our model to be singular, with the collision efficiency presenting an instant decay from the theoretical initial collision efficiency at the given engulfment parameter to the initial collision efficiency for
 $\textrm {Eg} = 0$, as the salt would not be able to diffuse to the diluted water at the inner edge of the drop and expansion would cease. Moreover, it is noted that the numerical results for
 $K^* = 10^{-6}$, indicated by the dashed lines in figure 8, are practically identical to the ones for
 $K^* = 10^{-4}$. A similar behaviour of the collision efficiency curves coinciding for small values of
 $K^*$ was observed previously (Roure & Davis Reference Roure and Davis2021b) in the absence of inner diffusion for
 $\textrm {Eg} =1$; under these conditions, the collision efficiency is dominated by engulfment. Hence, the results in figure 8 indicate that the engulfment dominance of the collision efficiency can persist for considerably large times, even for large Péclet numbers. Of course, since
 $\textrm {Eg} =KRTc_i/(\dot {\gamma } a_i)$, a reduction in the permeability
 $K$ with all else unchanged would lead to reduced engulfment and a lower collision efficiency.
Collision efficiency versus time for  $a_p = 0.5$,
 $\textrm {Eg} =1$, and
 $K^* = 10^{-4}$ (solid lines) and
 $K^* = 10^{-6}$ (dashed lines) for different Péclet numbers. Although all of the curves start at the same value, the increase in the Péclet number results in a faster decay in salt concentration at the boundary at short times, which leads to a slower drop swelling and, thus, lower collision efficiency.

Figure 9 shows the collision efficiency versus time for  $a_p = 0.5$,
 $K^* = 10^{-4}$,
 ${\textit {Pe}} = 200$ and
 $\textrm {Eg} = 0$,
 $0.25$,
 $1.0$,
 $2.0$ and
 $3.0$. As expected, the collision efficiency is greater for larger values of Eg. The short-time decay of
 $E_{col}$ for high Eg is slower when compared to lower values of Eg. Moreover, as seen before in figure 8 and in our previously presented results (Roure & Davis Reference Roure and Davis2021b), the slowing of drop swelling also produces a change in the curve's shape. Namely, for high values of Eg, the collision efficiency presents a decreasing behaviour with time, as expected in expansion-dominated capture, whereas for smaller values of the engulfment parameter, we observe a short-time decay followed by an increasing collision efficiency and a slow decrease for even larger times. Also, in contrast to the results shown in figure 8, decreasing the value of Eg also decreases the initial collision efficiency. Hence, the sharp decay observed at short times in figure 8 for drops with slower swelling rate is no longer present.
Collision efficiency versus time for  $a_p = 0.5$,
 ${\textit {Pe}} = 200$ and different values of the engulfment parameter Eg. The solid lines represent the results for
 $K^* = 10^{-4}$, whereas the dashed lines are the results for
 $K^* = 10^{-6}$. For large values of Eg, the collision efficiency is dominated by engulfment and the results coincide. For non-expanding droplets, however, the collision efficiency for permeability
 $K^* = 10^{-4}$ at larger times is approximately twice as large as the one for
 $K^* = 10^{-6}$.

Figure 10 show numerical results for the collision efficiency versus time for  $K^* = 10^{-4}$ and
 $a_p = 0.1$,
 $0.25$,
 $0.5$ and
 $1.0$ for (a)
 $\textrm {Eg} = 0$ and (b)
 $\textrm {Eg} = 1$ and
 ${\textit {Pe}} = 200$. In figure 10(a), the collision efficiency without engulfment presents an increasing behaviour until it reaches the steady state predicted by collision theory, represented by the dashed lines. The agreement between the transient simulations and collision theory is much better than reported previously (Roure & Davis Reference Roure and Davis2021b), because of the increase in resolution allowed by the tabulation of the mobility functions described in § 2.1. From figure 10(a), we see that for smaller particles, the collision efficiency and, thus, the pair-distribution function, takes a longer time to reach a steady state. Moreover, the collision efficiency becomes small for small particles, which tend to flow around non-expanding droplets. In figure 10(b), the behaviour is initially dominated by engulfment. In this regime, smaller particles have higher collision efficiencies compared to larger particles, as predicted by the expression for pure expansion. However, at larger times, when the drop expansion rate decreases, the capture transitions to a more flow-like behaviour. In this regime, the collision efficiency presents a more quasi-steady behaviour and, as expected from flow-induced capture, the collision efficiency for finer particles is smaller. Because the expansion rate decays slowly, the influence of drop expansion is still present in the sense that the collision rate is still much higher than for flow capture without expansion shown in figure 10(a).
Collision efficiency versus time for  $K^* = 10^{-4}$ and
 $a_p = 0.1$,
 $0.25$,
 $0.5$ and
 $1.0$ for (a)
 $\textrm {Eg} = 0$ and (b)
 $\textrm {Eg} = 1$ and
 ${\textit {Pe}} = 200$. In panel (a), the collision efficiency presents an increasing behaviour until it reaches the steady state predicted by collision theory, represented by the dashed lines. In panel (b), the behaviour is initially dominated by engulfment, but transitions to a long-time, quasi-steady behaviour.

Although the results in figure 10(b) show an increasing behaviour of collision efficiency with radius for larger times, this behaviour is non-monotonic, as in the results for non-expanding permeable droplets reported by Davis & Zinchenko (Reference Davis and Zinchenko2018). To better understand this behaviour, we investigated how different physical parameters, such as the particle size  $a_p$, Péclet number
 ${\textit {Pe}}$ and engulfment parameter Eg, affect the collision efficiency at moderate times. Figure 11 shows numerical results for the collision efficiency at time
 $t = 1$ versus the non-dimensional particle radius for
 $K^* = 10^{-4}$ and different values of Eg. Figure 11(a) shows the results for
 ${\textit {Pe}} = 5$. For this small Péclet number, we see that, even for moderate values of Eg, the collision efficiency at time
 $t = 1$ is still dominated by engulfment. Namely, for
 $\textrm {Eg} = 1$, the collision efficiency decreases with increasing particle radius
 $a_p$, which is characteristic of engulfment-dominated capture. For smaller values of Eg, we see a non-monotonic behaviour characteristic of flow-dominated capture. In contrast, the results in figure 11(b), which shows numerical results for
 ${\textit {Pe}} = 200$, present a flow-dominated behaviour even for
 $\textrm {Eg} =1$. However, it is also noted that the collision efficiencies for larger values of Eg are considerably higher than for non-expanding droplets, especially for smaller particles. Thus, engulfment due to drop expansion provides a significant enhancement to the capture of very fine particles.
Collision efficiency at time  $t = 1$ versus non-dimensional particle radius for
 $K^* = 10^{-4}$ and different values of the engulfment parameter Eg: (a) results for
 ${\textit {Pe}} = 5$ and (b) results for
 ${\textit {Pe}} = 200$.

The preceding figure and discussion suggest a transition from flow-dominated particle capture to engulfment-dominated particle capture. This concept is further examined in figure 12, which shows a ‘phase diagram’ for the dominant capture mechanism for  $a_p = 0.5$ and
 $K^*=10^{-4}$. In contrast to the critical engulfment parameter Eg
 $^*$ defined by (2.19), which is related to the behaviour of the collision efficiency at
 $t = 0$, the previous results in this section indicate an alternative way to characterize the transition between flow- and engulfment-dominated behaviours by noting the presence of a local minimum at short times for flow-dominated capture, which is followed by a subsequent increase in collision efficiency. To this end, we performed a series of numerical simulations at various values of
 ${\textit {Pe}}$ and Eg. By analysing the results for each Péclet number, we can estimate a critical value of Eg, Eg
 $_c$, for which the collision efficiency ceases to be monotonically decreasing, indicating a transition in the dominant capture mechanism. The numerically calculated values of these transition points are shown by the curve in figure 12. Above the curve is the region of engulfment-dominated particle capture, whereas the shaded area below the curve is the region of flow-dominated capture. As expected, the value of Eg
 $_c$ increases monotonically with
 ${\textit {Pe}}$ due to the fast depletion of salt at the inner drop interface. From figure 12, it is also noted that there is a sharp increase in the critical engulfment parameter from small to moderate Péclet numbers, which transitions to a slower increasing behaviour that is nearly linear with
 ${\textit {Pe}}$.
Phase diagram representing the transition between flow- and engulfment-dominated particle capture for  $a_p = 0.5$ and
 $K^*=10^{-4}$ and
 ${\textit {Pe}} =$
 $0.1$,
 $1$,
 $5$,
 $25$,
 $100$,
 $200$ and
 $300$. For each Péclet number, we identify a critical engulfment parameter, Eg
 $_c$, represented by the solid curve, at which there is a transition between particle-capture mechanisms. The region above the transition curve represents engulfment-dominated particle capture, whereas the shaded area below is the region of flow-dominated particle capture.

4. Comparison between flotation and agglomeration
One important comparison to make is between our theoretical results for the capture efficiency of the agglomeration process and previous theoretical results regarding froth flotation. To this end, in this section, we compare the results from our model with the theoretical results obtained for froth flotation by Loewenberg & Davis (Reference Loewenberg and Davis1994). Following the discussion at the beginning of § 3.2, we focus our attention to the limits of the permeability range estimated by Davis & Zinchenko (Reference Davis and Zinchenko2018), with  $K^* = 10^{-6}$ and
 $10^{-4}$,
 ${\textit {Pe}} = 200$ and small values of Eg.
Figure 13 shows numerical results for the collision efficiency evaluated at the non-dimensional time  $t = 1$ (expanding drops) or steady state (non-expanding drops) for different particle sizes. The dashed curve is the reference result for the steady-state collision efficiencies of froth flotation obtained by Loewenberg & Davis (Reference Loewenberg and Davis1994) for different particle radii and
 $H \equiv A/(RT) = 1$, where
 $A$ is a measure of the van der Waals attraction, as described by Hamaker (Reference Hamaker1937). The solid curves are the results for the agglomeration method investigated in this paper with and without engulfment. The inset shows a closeup of the region for smaller particle sizes. For non-expanding (
 $\textrm {Eg} =0$) drops, the permeable interfaces for flow-induced capture lead to collision efficiencies without attractive forces that are comparable to (
 $K^* = 10^{-6}$) or larger than (
 $K^* = 10^{-4}$) the flotation capture efficiencies with van der Waals attraction but no permeation. However, both mechanisms yield very low efficiencies for
 $a_p < 0.05$ (i.e. small particles of radii less than
 $5\,\%$ of the drop or bubble radius).
Numerical results for the collision efficiency versus particle radius. The dashed curve is the reference result for the steady-state collision efficiencies of froth flotation obtained by Loewenberg & Davis (Reference Loewenberg and Davis1994) for different particle radii and  $H \equiv A/(RT) = 1$. The solid curves are the results for the fast agglomeration method where: (i)
 $\textrm {Eg} = 0$,
 $K^* = 10^{-6}$; (ii)
 $\textrm {Eg} = 0$,
 $K^* = 10^{-4}$; (iii)
 $\textrm {Eg} = 0.05$,
 $K^* = 10^{-6}$; (iv)
 $\textrm {Eg} = 0.1$,
 $K^* = 10^{-6}$,
 ${\textit {Pe}} = 200$; and (v)
 $\textrm {Eg} = 0.25$,
 $K^* = 10^{-6}$,
 ${\textit {Pe}} = 200$. The inset shows a closeup of the region for smaller particle sizes. The results for non-expanding droplets are at steady state, whereas the results for expanding droplets are evaluated at
 $t = 1$.

Fortunately, even the smallest engulfment examined ( $\textrm {Eg} = 0.05$,
 $K^* = 10^{-6}$) provides considerable enhancement in the collision efficiency for the new process of fast agglomeration with emulsion binders, with the enhancement the greatest on a relative basis for smallest particles. This prediction supports the experimental observations of van Netten et al. (Reference van Netten, Borrow and Galvin2017) that the process rapidly captures particles of all sizes. Moreover, the current analysis of the agglomeration process neglects molecular attractive forces, which would further increase the collision efficiency for very small permeabilities and engulfment parameters.
5. Concluding remarks
Particle capture by small, salt-water drops covered with a thin permeable film was analysed by solving the transient diffusion problem inside the expanding drops and the two-sphere mobility equations for the drop–particle interaction in an extensional flow field. Osmotic flow into the drops is characterized by an engulfment parameter (ratio of permeate flow to imposed external flow), while salt diffusion inside the drop is characterized by a Péclet number (ratio of osmotic flow to diffusive flux). As expected, increasing the engulfment parameter increases the drop–particle collision efficiency, especially for very small particles, which tend to flow on streamlines around non-expanding drops rather than collide with them. Increasing the Péclet number decreases the collision efficiency, however, as the slower diffusion of salt from the drop center to its edge leads to a diffusion boundary-layer of declining salt concentration near the inner edge of the drop interface, and a reduced driving force for osmotic flow and drop expansion. Nevertheless, this effect is relatively weak; figure 8 shows a decline in collision efficiency of less than one-half at  $t = 1$ as
 ${\textit {Pe}}$ is increased from
 $0.1$ to
 $25$ and less than two-thirds as
 ${\textit {Pe}}$ is increased from
 $0.1$ to
 $200$, for
 $\textrm {Eg} = 1$,
 $K^* = 10^{-4}$ and
 $a_p = 0.5$. Further, for very small particles, even a small amount of engulfment can provide a substantial relative increase in the collision efficiency over that without engulfment. For example, figure 13 shows for
 $a_p = 0.05$, a 12-fold increase in the collision efficiency from
 $0.005$ for froth flotation to
 $0.06$ for fast agglomeration with
 $\textrm {Eg} = 0.1$,
 $K^* = 10^{-6}$ and
 ${\textit {Pe}} = 200$.
The engulfment parameter is defined as  $\textrm {Eg} = KRTc_i/(\dot {\gamma }a_i)$. In addition to decreasing the imposed shear rate
 $\dot {\gamma }$ (which would reduce the base collision rate proportionately) or increasing the initial salt concentration,
 $c_i$, Eg can be increased by using drops with smaller radius
 $a_i$. Smaller drops have smaller Péclet number,
 ${\textit {Pe}} = KRTc_i a_i/D$, with less diffusional resistance and, hence, higher collision efficiencies. Moreover, the particle-to-drop size ratio is increased for smaller drops, which further increases the collision rate. Thus, smaller drops are recommended where feasible. Regardless, the simulations show that fast agglomeration is a suitable alternative for froth flotation of even very small particles, as long as modest engulfment due to osmotic flow into expanding drops is present.
Acknowledgement
A portion of this research comprised the senior thesis of J. Trost at the University of Colorado Boulder.
Funding
Acknowledgement is made to the donors of The American Chemical Society Petroleum Research Fund for partial support of this research. The authors also thank Professor K. Galvin of the University of Newcastle for introducing the problem, in turn acknowledging in-kind contributions from the Australian Research Council for the ARC Centre of Excellence for Enabling Eco-Efficient Beneficiation of Minerals, grant number CE200100009.
Declaration of interests
The authors report no conflict of interest.


 Open access

