Introduction
The effects of excessive artificial light, a phenomenon known as light pollution, could have direct consequences on retinal health. Constant exposure may produce retinal degeneration (RD) as a consequence of photoreceptors or retinal pigment epithelium cell death (Contín et al., Reference Contín, Benedetto, Quinteros-Quintana and Guido2016). Due to the wide range of light sources, the retinal damage is usually divided into two classes: (a) damage produced by low irradiance levels of light, mediated by the activation of rhodopsin in photoreceptor cells and (b) damage produced by a brief exposure to high irradiance (bright light), where injuries occur at short times of exposure (Hao et al., Reference Hao, Wenzel, Obin, Chen, Brill, Krasnoperova, Eversole-Cire, Kleyner, Taylor, Simon, Grimm, Reme and Lem2002). The relationship between photoreceptor degeneration and glia activation in light-induced retinal injury remains poorly understood and depends on light source, intensity, exposure times, and/or in vivo/in vitro models (Harada et al., Reference Harada, Harada, Kohsaka, Wada, Yoshida, Ohno, Mamada, Tanaka, Parada and Wada2002; Chen et al., Reference Chen, Wu, Dentchev, Zeng, Wang, Tsui, Tobias, Bennett, Baldwin and Dunaief2004; Kang et al., Reference Kang, Larbi, Andrade, Reardon, Reh and Wohl2021).
Previously, we demonstrated that exposure to constant low light (200 lux) produced RD in Wistar rats. We observed a significant reduction in the outer nuclear layer (ONL) after 6 days (LL6) (Contín et al., Reference Contín, Arietti, Benedetto, Bussi and Guido2013; Benedetto & Contin, Reference Benedetto and Contin2019). Moreover, at early exposure times (2 days; LL2), we demonstrated rhodopsin hyper-phosphorylation on serine334 residue, suggesting that rhodopsin phosphorylation may be affected by prolonged phototransduction activity, as one of the first events (Contín et al., Reference Contín, Arietti, Benedetto, Bussi and Guido2013). Also, our results suggest that a caspase-3 independent apoptotic mechanism may be involved, that is, calpain-dependent mechanism or other pathways such as necroptosis. Interestingly, markers of oxidative stress increased after 5 days (LL5) in the ONL and correlated with a reduction in docosahexaenoic acid (DHA). DHA is the major component of rod outer segment (OS) membrane and it is highly vulnerable to oxidation; thus, oxidative stress processes may affect the OS structure after low light exposure (Benedetto & Contin, Reference Benedetto and Contin2019). Therefore, we consider that low light-induced photoreceptor cell death in Wistar rats is a useful model for studying the mechanisms involved in phototransduction defects during the early stages, in order to define the main events leading to RD.
The retina, as part of the central nervous system (CNS), is nourished by minority cellular subsets, the glia and vasculature. Although glia constitutes a small fraction of the retina, it exerts profound effects on neurons, vasculature and other glial cells. Retinal glial cells are subdivided into macroglia (Müller cells and astrocytes) and microglia (resident immune cells) with specific morphological, physiological, and antigenic characteristics (Vecino et al., Reference Vecino, Rodriguez, Ruzafa, Pereiro and Sharma2016; Telegina et al., Reference Telegina, Kozhevnikova and Kolosova2018). Müller cells comprise 90% of the retinal glia and anatomically define the distal and proximal borders of the retina since they spread through it from the inner limiting membrane to the distal end to ONL (Vecino et al., Reference Vecino, Rodriguez, Ruzafa, Pereiro and Sharma2016). They provide homeostatic and metabolic support to photoreceptors and other neurons required for normal neuronal activity (Reichenbach & Bringmann, Reference Reichenbach and Bringmann2010). Müller cells maintain the viability of photoreceptors and other retinal neurons; they direct light onto photoreceptors, recycle the retinoid in an alternative visual cycle (Guido et al., Reference Guido, Marchese, Rios, Morera, Diaz, Garbarino-Pico and Contin2020), provide structural stabilization of the retina, and modulate immune and inflammatory responses (Chen et al., Reference Chen, Deng, Cui, Fang, Zuo, Deng, Li, Wang and Zhao2018). In pathological conditions, a reactive gliosis response is induced, which may have effects aimed to protect the retina against further damage and maintenance of homeostasis (Bringmann & Wiedemann, Reference Bringmann and Wiedemann2011), or to produce cytotoxic effects, increasing the susceptibility to stressful stimuli (de Hoz et al., Reference de Hoz, Rojas, Ramírez, Salazar, Gallego, Triviño and Ramírez2016). Reactive gliosis has been described in different retinal pathologies, including age-related macular degeneration (AMD), diabetic retinopathy, glaucoma, retinal detachment, and retinitis pigmentosa (Reichenbach & Bringmann, Reference Reichenbach and Bringmann2010). Thus, understanding the role of glia in both, protective and cytotoxic effects, would help in the design of therapeutic strategies for treating the retinal physiopathology. Astrocytes also play important roles in retinal development and hemodynamics. In response to neuronal activity and neurotransmitter release, astrocytes produce vasoactive compounds and promote vasodilation or constriction of retinal blood vessels (Kur et al., Reference Kur, Newman and Chan-Ling2012).
Microglial cells act as phagocytes and, together with perivascular cells, form a network of immune effector cells in the CNS (Karlstetter et al., Reference Karlstetter, Ebert and Langmann2010, Reference Karlstetter, Scholz, Rutar, Wong, Provis and Langmann2015). In the retina, microglia represents the resident tissue macrophages and play important roles in retinal homeostasis, recovery from injury, and progression of the disease. Microglia also fulfill a number of tasks needed for the physiological functions in the healthy retina; for instance, maintaining the purposeful and functional histo-architecture of the adult retina, expressing receptors and releasing neuroprotective and anti-inflammatory factors, playing a critical role in host defense, immune regulation, as well as in tissue repair (Streit, Reference Streit2002). Moreover, an adequate resident microglial population is necessary for proper retinal blood vessel formation (Checchin et al., Reference Checchin, Sennlaub, Levavasseur, Leduc and Chemtob2006), and their distribution through the retinal layers is documented as well (Ashwell et al., Reference Ashwell, Holländer, Streit and Stone1989; Provis et al., Reference Provis, Diaz and Penfold1996). Under physiological conditions, microglial cells are located in the inner plexiform layer (IPL) and outer plexiform layer (OPL) participating in neuron–microglia interaction to maintain cellular homeostasis. In pathological conditions, the “activated” microglia denote different functions including migration and morphological changes (Checchin et al., Reference Checchin, Sennlaub, Levavasseur, Leduc and Chemtob2006; Langmann, Reference Langmann2007; Rashid et al., Reference Rashid, Akhtar-Schaefer and Langmann2019), acquiring an ameba-like shape, the ability to migrate into the damaged region and to express a number of pro- and anti-inflammatory molecules. The classical photoreceptor layer (ONL), which is devoid of microglial cells in healthy retina, becomes colonized by these cells in conditions that induce massive ONL cell degeneration, such as inherited photoreceptor degeneration (Rashid et al., Reference Rashid, Akhtar-Schaefer and Langmann2019) or light/laser injury; Bejarano-Escobar et al., Reference Bejarano-Escobar, Blasco, Martín-Partido and Francisco-Morcillo2012). In some age-related diseases, such as AMD, the activated microglia can be neurotoxic and lead to the degeneration of photoreceptors, thereby contributing to typical chronic inflammation (Telegina et al., Reference Telegina, Kozhevnikova and Kolosova2018).
In the present work, we aimed to characterize glial cells’ response along the time–course of RD induced by chronic exposure to low-intensity LED light in Wistar rats. The use of such a model in the comprehensive study of RD may provide a basis for future strategies for preventing or delaying visual cell loss.
Materials and methods
Animals
According to the 3Rs principles for ethical use of animals in scientific research, all efforts were made to minimize both animal number and their suffering. Male albino Wistar rats (12–15 weeks), inbreed in our laboratory for 5 years, were maintained on 12:12 h light-dark cycles with lights on (less than 50 lux of white fluorescent lamp) from zeitgeber time (ZT) 0 to 12 from birth until the day of the experiment. Food and water were available ad libitum.
Retinal light damage
Retinal degeneration was induced as described by Contín et al. (Reference Contín, Arietti, Benedetto, Bussi and Guido2013). Briefly, animals were exposed to constant light in boxes equipped with LED devices (EVERLIGHT Electronic Co., Ltd. T-13/4 3294-15/T2C9-1HMB, color temperature of 5500 K) in the inner upper surface and temperature-controlled at 24 ± 1 °C. At rat eye level, 200 lux were measured with a light meter (model 401036; Extech Instruments Corp., Waltham, MA). After light stimulation, the animals were sacrificed in a CO2 chamber at ZT6.
Light exposure protocol
Animals were exposed to constant light stimulation for 2, 4, 6, and 8 days (LL2–LL8, respectively). Rats exposed to fluorescent light at 50 lux on 12:12 h light-dark cycles (LDR) were used as controls of standard housing conditions. Rats exposed to constant darkness (DD7), were used as no-exposure controls.
Immunohistochemistry
After exposure, whole rat eyes were fixed in 4% (w/v) paraformaldehyde in phosphate-buffered saline (PBS, pH 7.4) overnight at 4 °C, cryoprotected in sucrose and mounted in optimal cutting temperature compound (OCT; Tissue-Tek Sakura). 20 μm-thick retinal sections were obtained along the horizontal meridian (nasal-temporal) using a cryostat (HM525 NX-Thermo Scientific). Sections were washed in PBS and permeabilized with PBS 0.2% (v/v) Triton X-100 (Sigma Chemical Co, St. Louis, MO), 40 min at room temperature (RT). Then, they were blocked with blocking buffer [PBS supplemented with 0.05% Triton X-100; 3% (w/v) BSA, 2% (w/v) horse serum, and 0.2% (w/v) sodium azide; Sigma-Aldrich Co., St. Louis, MO] for 2:30 h at RT with continuous gentle shaking. After that, sections were incubated with rabbit polyclonal anti-glial fibrillary acidic protein (GFAP, Cat. No. G9269, Sigma–Aldrich Co., dilution 1:500) or goat polyclonal anti-ionized calcium binding adaptor molecule 1 (Iba1, Cat. No. ab107159, Abcam, Cambridge, UK, dilution 1:500) both diluted in blocking buffer, overnight at 4 °C in a humidified chamber. Samples were then rinsed three times by 5 min in PBS 0.05% (v/v) Triton X-100 and incubated with goat anti-rabbit IgG (H + L) highly cross-adsorbed secondary antibody, Alexa Fluor 594 and donkey anti-goat IgG (H + L) cross-adsorbed secondary antibody, Alexa Fluor 488 (Invitrogen-Molecular Probes, Eugene, OR, cat. # A-11037# and A-11055, respectively), and 3 μM DAPI, for 1 h at RT. Finally, they were washed three times in PBS and mounted in Mowiol (Sigma-Aldrich Co.). Images were collected using a confocal microscope (Olympus FV1200, Japan).
Microglia cells number analysis
To analyze the number of microglial cells, vertical cryosections of retina immunostained with Iba1 were used. The quantifications of the number of Iba1-positive cells were made along all retinal cell layers and in two defined regions: (a) inner portion retina, corresponding to ganglion cell layer (GCL), IPL, inner nuclear layer (INL) and OPL, and (b) outer portion retina, corresponding to ONL + OS. Two images (at 20× magnification) per section were taken in fields on both sides of the optic nerve area and three non-consecutive sections per animal from each experimental group were analyzed.
Immunoblot
Homogenates of the whole retina suspended in 200 μl of PBS containing proteases inhibitors, were lysed by repeated cycles of ultra-sonication, and total protein content was determined by the Bradford assay kit (Bio-Rad Protein Assay Dye Reagent Concentrate, Catalogue Number 5000006). Lysates were then suspended in sample buffer [62.5 mM Tris–HCl pH 6.8; 2% (w/v) SDS; 10% (v/v) glycerol; 50 mM DTT; 0.1% (w/v) bromophenol blue] and heated at 90 °C for 5 min. Proteins (25 μg/lane) and molecular weight marker [5 μl ECL Rainbow Marker-Full range (12,000–225,000 Da) from Amersham Code RPN7800E] were separated by SDS–gel electrophoresis on 10% polyacrylamide gels, transferred onto nitrocellulose membranes, blocked for 1 h at RT with blocking buffer consisting of 5% (w/v) skim milk in washing buffer [0.1% (v/v) Tween-20 in PBS], and then incubated overnight at 4 °C with anti-GFAP or anti-α-tubulin antibody diluted 1:1000 in blocking buffer. The membranes were subsequently washed and incubated with the corresponding secondary antibody (goat anti-rabbit IRDye 700CW or goat anti-mouse IRDye 800CW, Odyssey LI-COR) in PBS for 1 h at RT, followed by three washes (5 min each wash) with washing buffer. Membranes were scanned using an Odyssey IR Imager (LI-COR Biosciences) and the quantification of the protein bands was performed by densitometry using the FIJI/Image J program (NIH).
RNA extraction, cDNA synthesis, and real-time reverse transcription polymerase chain reaction (RT-PCR)
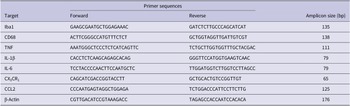
Total RNA was extracted from individual rat retinas using TRIzol RNA extraction reagent (Invitrogen, Carlsbad, CA), according to the manufacturer’s instructions. The isolated RNA was quantified using an Epoch Microplate Reader (BioTek Instruments, Winooski, VT). For complementary DNA (cDNA) synthesis, 2 μg of RNA was treated with DNase I (Thermo Scientific, USA) to remove possible contamination with genomic DNA. The product was incubated with a mix of random hexamer and Oligo-dT primers (Biodynamics), deoxynucleotides, and the reverse transcriptase M-MLV (Promega, Madison, WI), in RNAse-free conditions. Reverse transcription was performed following the manufacturer’s specifications, employing a thermocycler Mastercycler gradient (Eppendorf, Hamburg, Germany). Real-time RT-PCR was performed using the CFX96 Touch Real-Time PCR Detection System (Bio-Rad, USA). cDNA (120 ng) was amplified in 15 μl reaction mixture consisting of 7.5 μl of 2× SYBR Green PCR Master Mix (Life Technologies, USA), 0.75 μl 10 μM primer mixture, and 0.75 μl of nuclease-free water. The parameters used for PCR were as follows: 95 °C for 5 min (1 time); 95 °C for 30 sec, 60 °C for 30 sec, and 72 °C for 30 sec (40 times), and 95 °C for 60 sec (1 time). Samples were subjected to a melting-curve analysis to confirm the amplification specificity. Semi-quantification was performed by the method of ΔΔCt. The fold change in each target gene relative to the β-Actin endogenous control gene was determined by: fold change = 2−Δ(ΔCt) where ΔCt = Ct(target) – Ct(β-Actin) and Δ(ΔCt) = ΔCt(LL) – ΔCt(LDR). Real-time RT-PCR was run separately for each animal in triplicate. The primers used for real-time RT-PCR are provided in Table 1.
Primer sequences for genes related to glial cell markers, inflammatory cytokines, and chemokines

Statistical analysis
Statistical analysis was carried out using the Infostat software (Version 2017, InfoStat Group, FCA, National University of Cordoba, Argentina). The assumptions of normality and homogeneity of the variance were proved by Shapiro-Wilks and Levene tests, respectively. When data were normally distributed analyzed using one-way analysis of variance (ANOVA) and Bonferroni post hoc test. When the data did not comply with the assumptions of the ANOVA tests being non-normally distributed for the groups, data were analyzed using a non-parametric Kruskal–Wallis test. Data are expressed as mean ± s.d. In all cases, a P-value <0.05 was considered statistically significant. All graphics were made using GraphPad Prism Software, version 6.01 (San Diego, CA).
Results
As we demonstrated before, retina exposed to constant light for several days resulted in a diminution of ONL corresponding to photoreceptor cell loss (Fig. 1E, LL6; Contín et al., Reference Contín, Arietti, Benedetto, Bussi and Guido2013). Along with the degeneration of the outer retina, as part of the mechanism of light damage, the immune response may be triggered possibly by the activation of retinal glial cells. Thus, we characterized the macro and microglia response, in order to evaluate glial activation during the onset of RD.
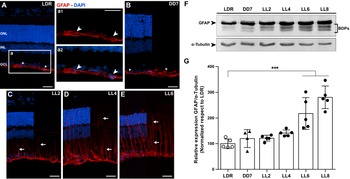
Effect of constant light exposure on GFAP expression in rat retinas. Confocal imaging of retina showing Immunofluorescence staining of GFAP expression in control animals, LDR (A) and DD7 (B), and exposed to light for two (LL2), four (LL4) and six (LL6) days (C-E). 40× magnification. (a1) LDR GFAP expression and (a2) merge with DAPI on a small area of GCL. 60× magnification. White arrowhead: GFAP labeled astrocyte at the level of GCL. White arrow: GFAP labeled muller cells. Red: GFAP antibody staining; blue: nuclear DAPI staining. Scale bar = 25 μm. ONL, outer nuclear layer; INL, inner nuclear layer; GCL, ganglion cell layer. (F) Representative western blot of GFAP and α-tubulin staining; BDPs, breakdown products. (G) Densitometry quantification of western blot staining with GFAP and α-tubulin is shown as relative expression (GFAP/α-tubulin) expressed as percentage and normalized relative to LDR. Data are presented as mean ± s.d. ***P < 0.001, by nonparametric Kruskal–Wallis test. n = 5 animals/group.

Macroglia
In the healthy retina, GFAP is expressed in Müller cells end feet but in the presence of metabolic stress, it is upregulated and expressed in the entirety of these cells, becoming an important marker of reactive gliosis. Also, GFAP is a typical marker for retinal astrocytes, present in reactive and non-reactive cells. In retina, GFAP immunostaining labels astrocytes in the GCL and their processes in the nerve fiber layer, and in blood vessels of the superficial plexus (Stone & Dreher, Reference Stone and Dreher1987). After the injury, both macroglial cells have been implicated in retinal gliosis. Müller cell gliosis effects are an enigma for major retinal diseases (Reichenbach & Bringmann, Reference Reichenbach and Bringmann2010); hence, in order to study the retinal macroglia responses during retinal injury promoted by light, we analyzed GFAP expression in control retinas and after different times of light exposure (LL).
Immunostaining for GFAP in retina from control groups LDR and DD7 showed intense labeling in GCL and short filament projections (Fig. 1A and 1B and inset a, white arrowhead); this morphology and localization of GFAP positive cells was indicative of retinal astrocytes. However, after LL2, the expression of GFAP increased, and GFAP labeling extended into an elaborate filamentous structure spanning the retinal thickness, indicative of Müller cells expression, with higher levels at LL6 (Fig. 1C–1E, white arrows). Western blot analysis showed increased expression of GFAP and breakdown products (BDPs) at LL2, LL4, LL6, and LL8 relative to LDR (Fig. 1F). Data quantification demonstrated a gradual increase of GFAP expression along the time of exposure, reaching a statistically significant increase at LL6 and LL8 (P < 0.001), compared to control group LDR (Fig. 1G).
Microglia
In order to assess microglial cell activation after constant low light, we study the shape and localization of these cells by immunolabeling of retinal sections with Iba1 antibody. The morphology of this cell is strongly related to the activation; it is accepted that resting inactive microglia have a dynamic morphology with a small cell body and many long and ramified processes. When microglia become activated, the cells display morphological changes such as size increase, retraction and thickening of the processes, and deformation of the cell soma acquiring an “ameboid shape” (Karperien et al., Reference Karperien, Ahammer and Jelinek2013).
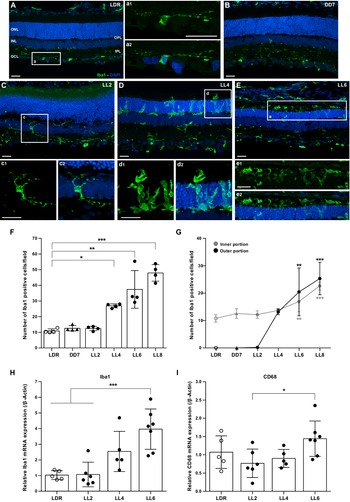
After immunostaining with Iba1, we found few weak-labeled positive cells in GCL, IPL, and OPL in control retinas (LDR and DD7), and these cells showed typical resting microglia characteristics: small cell body with long and ramified processes (Fig. 2A and 2B and inset a). In retinas exposed to light treatment, we found an increasing number of Iba1-positive cells in INL, IPL as well as in OPL and ONL, at LL4 and LL6 (Fig. 2D and 2E). The cell morphology became ameboid with thicker processes characteristic of activated cells (Fig. 2, insets d and e). Collectively, these data suggested that Iba1-positive cells, macrophages and microglia, are activated, increasing in number and accumulating in the outer retina in our model of RD promoted by light.
Microglial cell response as a consequence of constant light stimulation. Confocal imaging of retina showing Immunofluorescence staining of Iba1 expression in control animals, LDR (A) and DD7 (B), and exposed to light for two (LL2), four (LL4) and six (LL6) days (C-E). 40x magnification. Iba1 positive cells and merge with DAPI on different retinal layers in LDR (a1 and a2), LL2 (c1 and c2), LL4 (d1 and d2) and LL6 (e1 and e2). 60x magnification. Green: Iba1 antibody staining, blue: nuclear DAPI staining. Scale bar = 25 μm. ONL, outer nuclear layer; INL, inner nuclear layer; GCL, ganglion cell layer; IPL, inner plexiform layer; OPL, outer plexiform layer. (F) Iba1-positive cells quantification in all retinal layers on the optic nerve area. Three non-consecutive sections of one retina per animal were analyzed (spaced at least by 50 μm). Data are presented as mean ± s.d. *P < 0.05, **P < 0.01, ***P < 0.001 by nonparametric Kruskal–Wallis test. n = 4 animals/group. (G) Comparison of the number of Iba1-positive cells in the inner portion (GCL, IPL, INL + OPL) and outer portion (ONL + OS) retina. Data are presented as mean ± s.d. *P < 0.05, **P < 0.01, ***P < 0.001 respect to LDR by nonparametric Kruskal–Wallis test (outer portion) or one-way ANOVA and Bonferroni’s post hoc test (inner portion). n = 4 animals/group. Quantitative analysis of Iba1 (H) and CD68 (I) mRNA by real-time RT-PCR. Data are presented as mean ± s.d. *P < 0.05 respect to LL2, ***P < 0.001 respect to LDR and LL2 by one-way ANOVA and Bonferroni’s post hoc test. n = 5–7 animals/group.

In order to further the analysis of microglial response in retinas exposed to constant light, we counted Iba1-positive cells in two retinal areas: (a) inner portion retina, corresponding to GCL and IPL, INL, and OPL, and (b) outer portion retina, corresponding to ONL + OS (Fig. 2G). The analysis revealed a higher number of Iba1-positive cells in the outer portion retina with a statistical significance after LL6 with respect to controls (Fig. 2G, LL6 P = 0.0037; LL8 P < 0.001), indicative of profuse migration and activation of these cells after LL6. The analysis of total Iba1-positive cells along all the cell layers confirmed this result and showed a significant increase of Iba1-positive cells after LL4 and LL6 relative to control animals (Fig. 2F, LL4 P = 0.0315, LL6 P = 0.0016 and LL8 P < 0.001).
In order to further confirm the increase in Iba1 expression, mRNA levels of Iba1 were measured by real-time RT-PCR. As shown in Fig. 2H, while mRNA levels of Iba1 were similar in controls and LL2 retinas, the expression increased around 2- and 4-fold at LL4 (non-significative, P = 0.1843) and LL6 (P < 0.001), respectively. Altogether, our results indicate that low light promotes retinal microglial activation after LL6 of constant exposure.
Several surface markers such as CD68, complement receptor 3 (CD11b/CD18, OX42), MHC-II (OX6), F4/80, and Griffonia simplicifolia isolectin B4, are also used to detect and classify microglial activity (Kreutzberg, Reference Kreutzberg1996). In order to complete the characterization of microglia response, we studied the expression of CD68 by real-time RT-PCR. CD68 is a glycoprotein localized in lysosomes and a marker for activated phagocytic cells (Croisier et al., Reference Croisier, Moran, Dexter, Pearce and Graeber2005). CD68 expression (Fig. 2I) did not change after light exposure at LL2 and LL4 relative to control LDR, while it increased significantly at LL6 with respect to LL2 (P = 0.0489), supporting the idea that the microglial activation reaches significant levels after 4 to 6 days of exposure.
Activated microglia may exert detrimental neurotoxic effects by excessive production of cytotoxic factors such as tumor necrosis factor (TNF), interleukin (IL)-1β, IL-6, and reactive oxygen species (ROS). The cytotoxic factors may amplify the cascade of microglial activation, causing neurodegeneration (Chao et al., Reference Chao, Hu, Ehrlich and Peterson1995; Liu et al., Reference Liu, Peng, Laties and Wen1998). Therefore, we studied the expression levels of immune mediators by real-time RT-PCR. As shown in Fig. 3, relative mRNA levels of TNF (Fig. 3A) and IL-6 (Fig. 3C) were significantly increased only at LL6 compared with control LDR (P = 0.0108 and P = 0.0275, respectively). IL-1β (Fig. 3B) did not show significant changes in mRNA expression at any of the times studied (P > 0.05 for all experimental groups). All these results suggest that inflammatory mediators are induced by constant light after 6 days of exposure.
Quantitative analysis of pro-inflammatory markers after constant light exposure. Retinas were obtained from individual rats after different exposure times (LL2, LL4 or LL6) or standard housing conditions (LDR) and mRNA was isolated. Using real-time RT-PCR, we quantified the relative expression levels of TNF (A), IL-1β (B), IL-6 (C), CX3CR1 (D) and CCL2 (E). Graphs show the fold change of expression calculated as 2–ΔΔCT. β-Actin was used as the housekeeping gene. In all cases, data are presented as mean ± s.d. *P < 0.05, **P < 0.01, ***P < 0.001 by one-way ANOVA and Bonferroni’s post hoc test. n = 5–7 animals/group.

Chemokines are a family of small signaling proteins that regulate monocyte/macrophage activation and recruitment, acting as a chemoattractant and activating inflammatory cells (Yang et al., Reference Yang, Zhu and Tso2007). Chemokines are involved in the pathogenesis of immune-mediated inflammation (Baggiolini & Dahinden, Reference Baggiolini and Dahinden1994) and their levels increased significantly after inflammation-associated neurodegeneration. Fractalkine is a chemokine belonging to the CX3C subfamily that exists as both soluble and membrane-bound forms (Bazan et al., Reference Bazan, Bacon, Hardiman, Wang, Soo, Rossi, Greaves, Zlotnik and Schall1997), and it has been found in retinas exposed to bright light damage (Zhang et al., Reference Zhang, Xu, Liu, Ni and Zhou2012). In AMD progression, the major chemokine signaling pathways linked are CCL2/CCR2 and CX3CL1/CX3CR1 (Li et al., Reference Li, Eter and Heiduschka2015). Chronic stress can also stimulate the expression of CCL2, increasing monocyte and microglial cell recruitment and amplifying the inflammatory state (Feng et al., Reference Feng, Wang, Liu, Zhang, Xu and Ni2017a). In order to evaluate fractalkine and CCL2 involvement in low light-induced damage, we studied the fractalkine receptor (CX3CR1) and CCL2 mRNA expression during continuous light exposure. We found that CX3CR1 (Fig. 3D) and CCL2 (Fig. 3E) expression increased significantly at LL4 (P = 0.0312 and P = 0.004, respectively) and LL6 (P < 0.001 and P < 0.001, respectively) with respect to LDR.
Discussion
The excess of artificial light is a growing problem, identified as “light pollution.” It produces several complications at different ecological and environmental levels; in vision, it might produce RD per se or accelerate other retinal diseases (Contín et al., Reference Contín, Benedetto, Quinteros-Quintana and Guido2016). The possibility to understand the molecular mechanisms of light damage in different retinal injury models will contribute to the knowledge of visual disorders related to light pollution and defects in the phototransduction mechanism. In the present study, a Wistar rat model of constant light-induced RD was used to study the time–course of glial activation. As we demonstrated before, we found a reduction in ONL of rat retinas after LL6 compared with control animals LDR and DD7 (Fig. 1A vs. 1E). GFAP immunostaining analysis showed differences between controls and LL-treated animals, demonstrating an increase in the number of GFAP-positive cells with a filamentous morphology through the retinal thickness which extends to ONL (Fig. 1A–1C, white arrows). GFAP is an important marker of reactive gliosis that is up-regulated and expressed in the entirety of Müller and astrocytes cells in the presence of stress (Yang & Wang, Reference Yang and Wang2015; Karlen et al., Reference Karlen, Miller, Wang, Levine, Zawadzki and Burns2018). Therefore, our results confirm a clear activation of macroglia after constant exposure to low light (Fig. 1A–1E). Analysis of GFAP expression by western blot showed a significant increment of GFAP and BDPs levels at LL6 and LL8, relative to control LDR and DD7 (Fig. 1F and 1G). It has been shown that the proteolytic conversion of intact glial protein GFAP (50 kDa) into BDPs is involved in glial injury in CNS during the acute/subacute phase of several traumas, and GFAP-BDPs were associated with the role of Ca2+-dependent protease calpains or cathepsin D as alternative death pathways (Yang & Wang, Reference Yang and Wang2015). Previously, we demonstrated that a caspase-3 independent cell death mechanism is involved in retinal damage induced by constant low light exposure, suggesting the participation of other cell death pathways (Contín et al., Reference Contín, Arietti, Benedetto, Bussi and Guido2013). Ca2+-dependent protease calpains or cathepsin D as alternative death pathways may involve a late gliosis mechanism, in which GFAP-positive cells may exert cytotoxic effects on the retina after LL6; this mechanism has been described for other retinal light damage (Donovan et al., Reference Donovan, Carmody and Cotter2001; Donovan & Cotter, Reference Donovan and Cotter2002; Chahory et al., Reference Chahory, Keller, Martin, Omri, Crisanti and Torriglia2010).
Immunohistochemistry analysis revealed Iba1-positive cells characteristic of resting microglia in the IPL and OPL of control retinas (LDR and DD7; Fig. 2A and 2B and inset a); however, at LL4, LL6, and LL8, increased numbers of Iba1-positive cells in INL and IPL were observed, as well as in OPL and ONL (Fig. 2C–2E). The increase of Iba1-positive cells showing characteristic ameboid morphology in the outer portion retina (Fig. 2, insets c and d), indicated profuse migration and activation of microglia after LL4 and LL6. mRNA expression confirmed these results; Iba1 and CD68 levels increased after LL4, while no changes were observed between controls and LL2 animals (Fig. 2H and 2I). Altogether, our results support the idea that constant exposure to low light induced a late microglial activation.
Since the retina is the tissue adapted to capture light photons, it is continuously exposed to light and oxygen, making it vulnerable to oxidative stress, (Benedetto & Contin, Reference Benedetto and Contin2019). Therefore, the continuous surveillance of the retina for the detection of noxious stimuli is mostly carried out by microglial cells, the resident tissue macrophages which confer neuroprotection against transient pathophysiological insults. Under sustained injury, like constant light, microglial inflammatory responses might become deregulated, promoting photoreceptor cell death via other mechanisms. In this sense, oxidative stress is an important factor in injured retina frequently involved in worsening disease progression, which may be initiated by events such as hypoxia or inherited mutations, and triggers microglial activation (Chen et al., Reference Chen, Qi and Yang2015; Masuda et al., Reference Masuda, Shimazawa and Hara2017; Rashid et al., Reference Rashid, Akhtar-Schaefer and Langmann2019). Previously, we demonstrated the existence of oxidative reactions in our model (Benedetto & Contin, Reference Benedetto and Contin2019). Dihydroethidium (DHE)-positive labeling in retinal ONL and a significant increase in ROS production at LL5, were both indicative of active oxidative stress responses after 5 days of constant light. Thus, oxidative stress may be related to glial activation after several days of constant light. During the first days of light exposure, microglia may enhance tissue repair processes in order to return to homeostasis; however, under sustained light stimulus, the induction of microglial inflammatory responses may promote photoreceptor cell death.
It is known that upon injury, microglia and monocytes are activated promoting the secretion of neurotoxic factors, contributing to neurodegeneration (Zhang et al., Reference Zhang, Xu, Liu, Ni and Zhou2012; Li et al., Reference Li, Eter and Heiduschka2015; Wang & Cepko, Reference Wang and Cepko2022). In bright light-induced photoreceptor degeneration models, retinal microglia and monocytes are activated and recruited to the outer retina area where photoreceptor apoptosis occurred; this activation was correlated with the upregulation of the proinflammatory factors IL-1β and TNF (Feng et al., Reference Feng, Puyang, Chen, Liang, Troy and Liu2017b). The time-course study confirmed that light exposure promotes the upregulation of the proinflammatory TNF and IL-6 in a time-related manner, in parallel with microglial activation and migration (Fig. 3). Nonetheless this activation appeared later, after the initial photoreceptor cell death had already started. IL-1β did not show significant changes of mRNA expression at any time of LL studied (Fig. 3B); we propose that IL-1β expression may be inhibited in an indirect way via mechanisms involving the dysregulation of energy metabolism (i.e., PKM2/ HIF-1α) in photoreceptors exposed to constant light (Luo et al., Reference Luo, Hu, Chang, Zhong, Knabel, O’Meally, Cole, Pandey and Semenza2011; Rajala et al., Reference Rajala, Rajala, Kooker, Wang and Anderson2016). It has been demonstrated that activated microglia may exert detrimental neurotoxic effects by excessive production of cytotoxic factors such as TNF (Liddelow et al., Reference Liddelow, Guttenplan, Clarke, Bennett, Bohlen, Schirmer, Bennett, Münch, Chung, Peterson, Wilton, Frouin, Napier, Panicker, Kumar, Buckwalter, Rowitch, Dawson, Dawson, Stevens and Barres2017). However, using a model of light-induced retinal degeneration in zebrafish, it has been demonstrated that TNF is produced by dying retinal neurons and is necessary to induce Müller glia to proliferate and to promote a retinal regenerative response in zebrafish (Nelson et al., Reference Nelson, Ackerman, O’Hayer, Bailey, Gorsuch and Hyde2013). Even though mammalian Müller glia exhibit limited proliferation, we cannot rule out that TNF may exert a regenerative role after LL6; however, further studies are needed to evaluate its effects in conditions of constant low light exposure in mammalian models.
In bright light damage, it has been shown that the apoptotic peak of photoreceptors death was consistent with an elevated level of fractalkine, and both alterations were present before the increase of microglial infiltration; these observations suggest that after intense blue light exposure, soluble fractalkine is initially released by injured photoreceptors, and thereby causes the migration of microglia into the ONL via CX3CR1 (Zhang et al., Reference Zhang, Xu, Liu, Ni and Zhou2012). Here we demonstrated that in low light damage both CX3CR1 (Fig. 3D) and CCL2 (Fig. 3E) mRNA expression increased after LL6 supporting a role for these chemokines at the time of active gliosis and inflammation, and suggesting an ongoing cross-talk between microglia and neuronal cells at later stages of neurodegeneration.
Studies in retina from Arr1−/− mouse model (visual arrestin, an intracellular protein that desensitizes rhodopsin) showed that microglia and monocyte proliferation induced photoreceptor degeneration, and CCL2-CCR2 pathway was identified as an important mediator of retinal health; however, microglia and monocyte proliferation occur several days after photoreceptor loss (Karlen et al., Reference Karlen, Miller, Wang, Levine, Zawadzki and Burns2018), supporting the idea that other mechanisms are initiating photoreceptors cell death. In photoreceptors lacking Arrestin-1, rod phototransduction pathway is greatly affected since it prolongs rhodopsin activation; this effect results in light-induced photoreceptor degeneration and it is one of the main triggers of cell death; (Wu et al., Reference Wu, Seregard and Algvere2006). We think that the late macro and microglia activation may be involved in RD in low light retinal damage; however, some phototransduction-dependent factors may be the initial event that set off death pathways cascades. Previously, we performed electroretinogram studies in animals under LL, and demonstrated that both, “a” and “b” waves decrease their amplitudes and increase their latency time during light stimuli, getting abolished records before LL4 (Quinteros Quintana et al., Reference Quinteros Quintana, Benedetto, Maldonado, de Payer and Contin2016); these results show that electrical dysfunction activity precedes overt ONL cell loss, redox imbalance (Benedetto & Contin, Reference Benedetto and Contin2019), as well as macroglial (Fig. 1) and microglial activation (Figs. 2 and 3), indicating that the initial death signal occurred before LL4. Recently, it has been demonstrated in albino Sprague–Dawley rats exposed to intense light (1000 lux) that ONL reduction did not correlate with deficient electroretinography measurements, indicating that functional alterations precede morphological ones. However, the up-regulation of glial markers occurred concurrently with the functional alteration (Riccitelli et al., Reference Riccitelli, Di Paolo, Ashley, Bisti and Di Marco2021). Low-intensity light stimuli need the activation of photopigments and phototransduction mechanisms to induce RD (Hao et al., Reference Hao, Wenzel, Obin, Chen, Brill, Krasnoperova, Eversole-Cire, Kleyner, Taylor, Simon, Grimm, Reme and Lem2002; Organisciak et al., Reference Organisciak, Wong, Rapp, Darrow, Ziesel, Rangarajan and Lang2012), suggesting that impairment of the phototransduction pathways could be responsible for initiating cell death mechanisms. Moreover, we previously demonstrated an increase in phosphorylated rhodopsin (rhodopsin phospho-Ser334) starting from LL2 through LL7, supporting the idea that early changes in phototransduction cascade are involved before glial activation (Contín et al., Reference Contín, Arietti, Benedetto, Bussi and Guido2013). Further studies are needed to determine the role of opsin-mediated RD processes in this model; however, we propose that retinal dysfunction during the first days of low light exposure (LL1–LL4) may be promoted by phototransduction deregulation which may induce other cell death pathways. In contrast, in models of exposure to bright white light microglia activation appears as an early event in RD (Scholz et al., Reference Scholz, Sobotka, Caramoy, Stempfl, Moehle and Langmann2015). We speculate that one of the key mechanisms triggering photoreceptors cell death could be phototransduction-dependent mechanisms, possibly involving rhodopsin hyper-phosphorylation as a consequence of impairment of the enzymes related to the phosphorylation/dephosphorylation processes (Contín et al., Reference Contín, Arietti, Benedetto, Bussi and Guido2013).
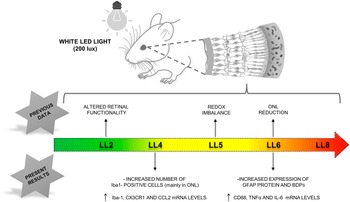
In summary, using a RD model induced by chronic low-intensity LED light exposure, we demonstrated that glial and immune activation appears to be secondary to other initial neurodegeneration events (Fig. 4).
Retinal light damage induced by constant low exposure. ONL reduction is significant at LL6; at the same time, we found increased levels of GFAP, CD68, TNF, IL-6, CX3CR1, and CCL2 expressions. Iba-1 positive cells began to increase at LL4 in ONL with a characteristic amoeboid morphology being significant after LL6. Previous data showed an altered retinal functionality by ERG after LL2 with redox imbalance at LL5. Our data indicate that glial and immune activation appears to be secondary to other initial neurodegeneration events. ONL: outer nuclear layer.

Our results demonstrate cellular and structural alterations associated with constant light damage. A glial response is evident, as we observed an increase in microglial cell numbers, Müller cell activation in the retina and increased expression of other markers such as TNF, IL-6, CX3CR1, and CCL2. All these results correlate with the thinning of the retinal outer nuclear layer. This amplified, immunological cascade and the loss of limiting control mechanisms may contribute significantly to retinal tissue damage. However, whether microglia proliferation is neuroprotective or neurotoxic is an issue that remains to be clarified. Thus, additional studies are required, which might give important clues for a better understanding of glia function at the time of LL studied.
Acknowledgments
We are grateful to Dr. Cecilia Sampedro and Dr. Carlos R. Mas for technical support in image acquisition and Rosa E. Andrada for animal facility management.
Author contributions
M.G.B. and M.M.B. performed the experiments and analyzed the data. M.A.C. conceived the project and designed the experiments. A.L.D. and M.E.G supervised the work and helped to write the manuscript.
Funding statement
This work has been funded by Consejo Nacional de Investigaciones Científicas y Técnicas de la República Argentina (CONICET), PICT 2013 No. 106 and CONICET PIP Nro. 11220150100226 (2015–2017) and (PIP) 2014–2021. Secretaría de Ciencia y Tecnología- Universidad Nacional de Córdoba (SeCyT-UNC) 2014–2018 and 2018–2024, and by Agencia Nacional de Promoción Científica y Técnica FONCyT, PICT 2016 No. 0187.
Competing interests
The authors have no competing interest to declare.