n-3 PUFA are essential nutrients primarily derived from marine sources and widely consumed as dietary supplements. Beyond their well-established cardiometabolic benefits(Reference Lichtenstein, Appel and Vadiveloo1), n-3 PUFA have gained increasing attention as potential modulators of skeletal muscle metabolism and adaptation to exercise. In fact, n-3 PUFA have been proposed to enhance skeletal muscle anabolism through multiple pathways(Reference Jeromson, Gallagher and Galloway2,Reference Jeromson, Mackenzie and Doherty3) . Experimental and clinical evidence indicate that supplementation of EPA and DHA, the biologically active long-chain forms of n-3 PUFA, may increase its incorporation into skeletal muscle phospholipid membranes(Reference Gerling, Mukai and Chabowski4,Reference McGlory, Calder and Nunes5) . Accordingly, increased membrane fluidity and amino acid transport, augmented activation of the mammalian target of rapamycin (mTOR) and p70S6K signalling pathways(Reference Stillwell and Wassall6–Reference Smith, Atherton and Reeds9) and attenuation of proteolytic signalling via inhibition of NF-κB have been proposed as a result of n-3 PUFA supplementation(Reference Magee, Pearson and Allen10,Reference Magee, Pearson and Whittingham-Dowd11) , as well as improvement in neuromuscular function through increased myocyte sensitivity to acetylcholine(Reference Patten, Abeywardena and Mcmurchie12,Reference Stubbs and Smith13) . Notably, some of the evidence supporting enhanced anabolic signalling and muscle protein synthesis after n-3 PUFA supplementation comes from studies using hyperinsulinemic–hyperaminoacidemic infusion protocols, which provide highly controlled and potent amino acid and insulin stimulation. Therefore, whether these effects translate into meaningful improvements in muscle hypertrophy and performance in humans remains unclear.
In healthy adult populations, clinical findings are inconsistent. While some studies report increases in protein synthesis signalling, lean mass, anaerobic performance and reductions in pain and fatigue following n-3 PUFA supplementation(Reference Smith, Atherton and Reeds8,Reference Smith, Atherton and Reeds9,Reference Smith, Julliand and Reeds14–Reference Da Boit, Sibson and Sivasubramaniam19) , others fail to demonstrate additive benefits on muscle mass or strength(Reference Harden, Dible and Russell20–Reference Mcglory, Wardle and Macnaughton23). Differences in training status, dietary protein intake, supplementation dose and methodological rigour likely contribute to these divergent outcomes.
Despite the widespread use of n-3 PUFA supplementation among individuals seeking to increase muscle mass and strength, no study to date has systematically examined their effects in young, resistance-trained adults, while simultaneously integrating whole-body, tissue, cellular and molecular outcomes. Thus, whether n-3 PUFA supplementation confers functional benefits beyond established anabolic stimuli in this population remains an unresolved and clinically relevant question.
To address this gap, the present study aimed to investigate the effects of n-3 PUFA supplementation on muscle mass and strength in healthy adult men undergoing resistance training with adequate protein intake, using a comprehensive top-to-bottom experimental approach. This design integrated functional (muscle strength), whole-body (fat-free mass), tissue-level (muscle cross-sectional area: mCSA), cellular (muscle fibre CSA: fCSA) and molecular assessments, including intramuscular incorporation of n-3 PUFA and activation of key protein synthesis signalling pathways. We hypothesised that n-3 PUFA supplementation would increase the incorporation of n-3 PUFA into skeletal muscle tissue and enhance the activation of anabolic signalling pathways compared with placebo; however, these molecular changes would not translate into additional functional benefits, and n-3 PUFA supplementation would not further enhance resistance training-induced gains in muscle hypertrophy and strength.
Methods
Study design
This was a double-blind, randomised, placebo-controlled clinical study (UTN code: U1111-1284-7632 – Brazilian Registry of Clinical Trials). Ethical approval was obtained from the Research Ethics Committee of the State University of Campinas (CAAE: 29556819.4.0000.5404), and all participants provided written informed consent prior to participation. This manuscript is described according to the recommendations by the Consolidated Standards of Reporting Trials (CONSORT) guidelines(Reference Hopewell, Chan and Collins24) (online Supplementary Table 1).
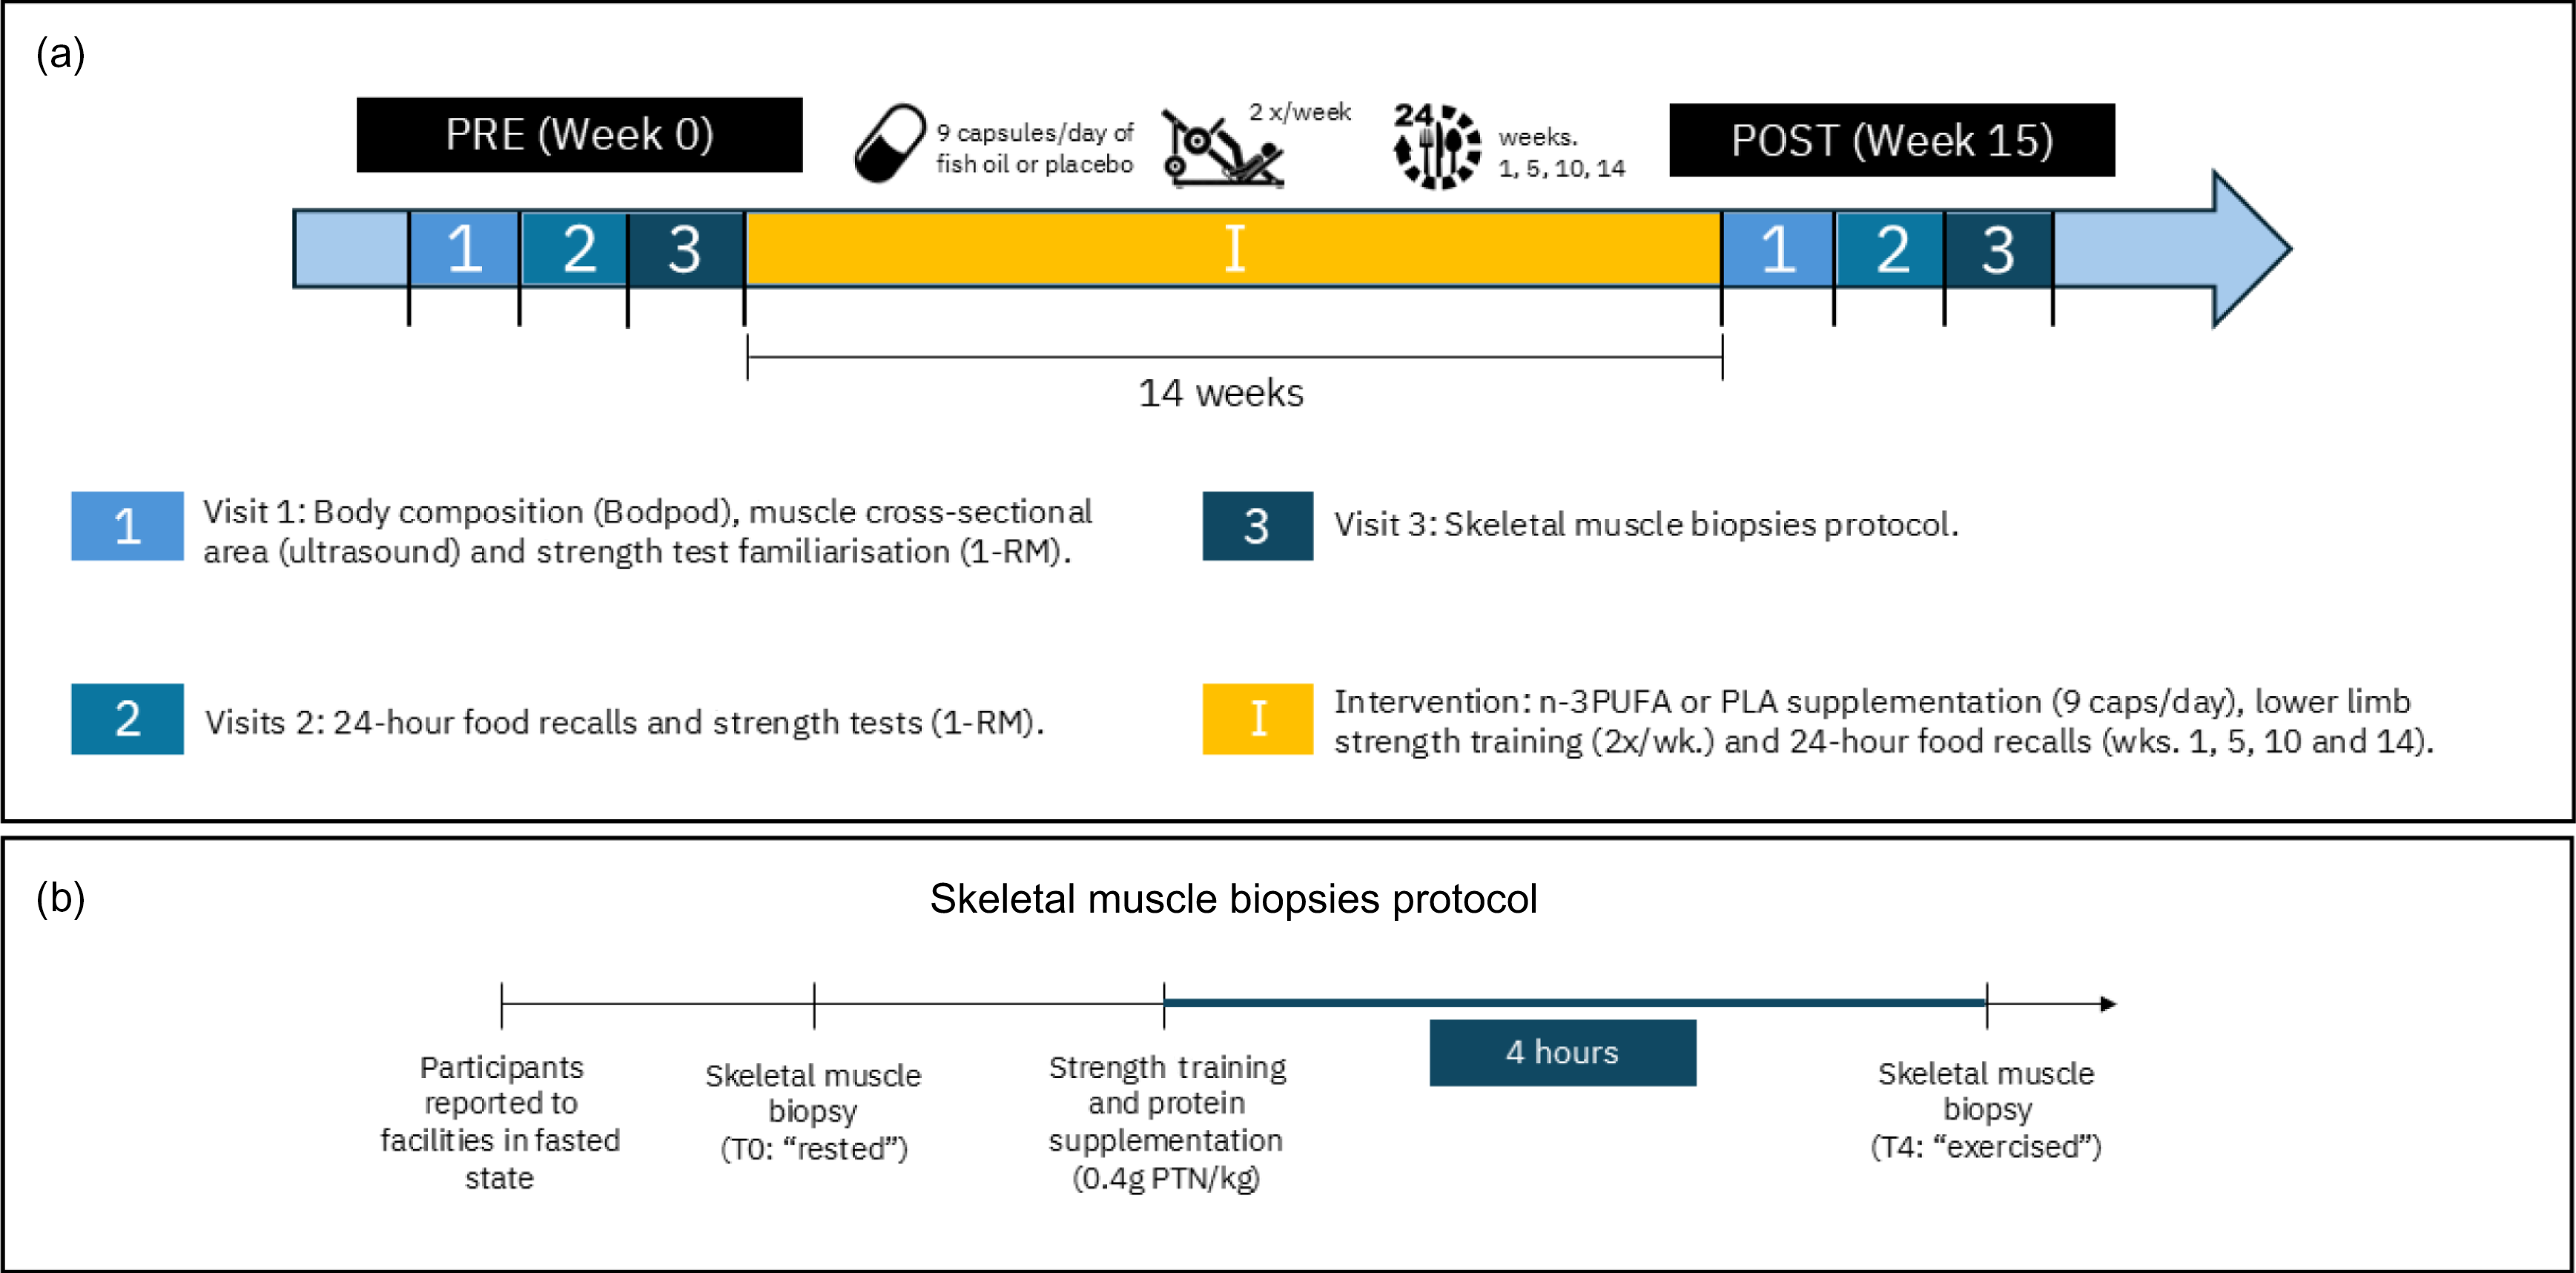
Participants were randomised (1:1) to either the n-3 PUFA supplementation group (W3) or the placebo group (PLA). At baseline (PRE) and after the 14-week intervention (POST), habitual protein intake (via multiple 24-h recalls), body composition (air displacement plethysmography), mCSA (ultrasound) and maximal dynamic strength (one-repetition maximum (1-RM) leg press) were assessed. A subsample of participants from both groups underwent vastus lateralis muscle biopsies before and after an acute resistance exercise bout to assess the incorporation of n-3 PUFA, fCSA and the activation of protein synthesis pathways. Participants performed resistance training targeting the lower limbs twice weekly, and dietary intake was monitored every 4–5 weeks throughout the intervention. An overview of the study design is presented in Figure 1.
Experimental design and biopsy protocol. (a) Overview of the study design. After baseline assessments (PRE, week 0), participants underwent 14 weeks of supervised resistance training while receiving either n-3 PUFA or placebo supplementation. Follow-up assessments were performed at POST (week 15). (b) Skeletal muscle biopsy protocol depicting sample collection at rest (T0) and 4 h after an exercise bout combined with protein ingestion (T4).BodPod, whole-body air-displacement plethysmography; 1-RM, one-repetition maximum test; PLA, placebo.

Figure 1. Long description
Population
Sample size was calculated a priori using G * Power® software (version 3.1.9.7) maximal dynamic strength assessed by 45° leg press 1-RM as the primary outcome. The calculation was based on an expected small-to-moderate effect size (Cohen’s f = 0·215), α = 0·05 and 80 % power. This effect size was selected considering previous resistance training trials in young resistance-trained men using 45° leg press 1-RM as a strength outcome, particularly the study by de Andrade et al. (Reference De Andrade, Gualano and Hevia-Larraín25). Based on these assumptions, we aimed to recruit forty-six participants in total, with twenty-three participants per group, to account for potential participant dropouts while maintaining adequate statistical power.
Forty-six healthy young adult males aged 19–40 years were recruited via advertisements and social media. Only male participants were included to reduce biological variability. Inclusion criteria were ≥ 12 months of strength training experience, a leg press 1-RM ≥ 2·5× body mass, no chronic disease or orthopaedic condition limiting exercise and habitual protein intake ≥ 1·6 g·kg-1·d-1 (based on established literature(Reference De Andrade, Gualano and Hevia-Larraín25,Reference Morton, Murphy and McKellar26) ), which was estimated at screening using a 24-h food record. Vegan and vegetarian participants were eligible if they met protein intake criteria. Exclusion criteria included prior anabolic steroid use, recent ergogenic supplement use without wash-out (> 3 months), ongoing or prior caloric restriction (< 1 year), medical contraindications to exercise or allergy to fish oil or milk protein. Recruitment materials clearly explained study procedures and potential risks.
Participants were instructed to maintain their habitual diet and lifestyle throughout the trial. Pre-existing lower-limb resistance training was suspended and replaced by the supervised study training programme, whereas other habitual activities and upper-body training were permitted. The use of other nutritional supplements containing n-3 PUFA, creatine or other ergogenic substances, was prohibited. Occasional use of medications prescribed for routine health conditions was allowed and registered. Concomitant care was similar between groups.
Only male participants were included to reduce biological variability and avoid potential confounding related to menstrual cycle phase, hormonal contraceptive use and sex hormone fluctuations. We acknowledge, however, that this design limits the generalisability of our findings to women.
Supplementation and blinding
Supplements were dispensed under a double-blind protocol. Randomisation was carried out in blocks of four to six participants and stratified by BMI, age and maximum strength. An independent researcher, not involved in assessments or analysis, managed enrollment and allocation, using a computer-generated random number list. Investigators responsible for data collection and outcome assessments were blinded to group allocation.
The W3 group received 9 g/d of fish-oil capsules (Indcaps®; 9 capsules), and the PLA group received 9 g/d of sunflower oil capsules (nine capsules). Each fish-oil capsule contained 0·696 g of n-3 PUFA (0·325 g EPA and 0·172 g DHA; total EPA + DHA 0·497 g) determined by GC/MS (online Supplementary Table 2). The daily dose (6·264 g n-3 PUFA; 4·473 g EPA + DHA) was selected based on prior evidence of skeletal muscle incorporation(Reference McGlory, Galloway and Hamilton27). Sunflower oil (PLA) is primarily composed of n-6 PUFA, with linoleic acid (18:2) and oleic acid (18:1) together accounting for about 83 % of its fatty acid profile, and only trace amounts of n-3 PUFA, including 0·05–0·1 % of ALA, and less than 0·01 % of both EPA and DHA(28,Reference Nagy, Iacob and Bodoki29) .
All participants were instructed to take the capsules with a meal (before or during), dividing the intake between breakfast (3 capsules), lunch (3 capsules) and dinner (3 capsules). Adherence was assessed by capsule count at the end of the study.
Resistance training protocol
Participants completed 14 weeks of supervised resistance training, twice a week, on non-consecutive days. Specific lower-limb exercises were performed on a 45° leg press and a leg extension machine. Both exercises were performed until the concentric failure within the appropriate range of motion. In the first 6 weeks, participants performed 3 sets of 12–15 repetitions; from the 7th to 10th weeks, 4 sets of 10–12 repetitions and in the last 4 weeks, 6 sets of 8–10 repetitions for each exercise. Loads were adjusted to ensure concentric failure within target repetition ranges, and 60 s intervals were given between sets of all resistance training sessions. All sessions were supervised by a certified trainer and logged in a spreadsheet for session adherence and total volume load calculations.
Dietary assessment
During the intervention, dietary intake was assessed using multiple 24-h food records collected in weeks 1, 5, 10 and 14 (two assessments on weekdays and one assessment on a weekend day). Dietary data were analysed with Dietbox® Pro software, referencing multiple food composition databases (TACO, IBGE, USDA and Tucunduva). Macronutrient intake was calculated for each time point. These repeated assessments were used to characterise dietary intake over time and capture expected day-to-day variability in protein intake.
Outcome measurements
Maximal dynamic strength
Maximal dynamic strength was assessed via 1-RM on the 45° leg press. After standardised warm-ups (5-minute cycling and two sets of eight repetitions at estimated loads of 50 % and 70 % of 1-RM, respectively), up to five attempts were made to determine the greatest load completed with proper technique(Reference Brown and Weir30). After a familiarisation session, two or more test sessions were conducted until the measurement stabilised (i.e. a coefficient of variation below 5 %) as previously described(Reference Rodrigues, Ferraz and Kurimori31). All participants received verbal encouragement during their attempts.
Muscle cross-sectional area
Ultrasound imaging (B-mode, 7·5 MHz; SonoAce R3) was used to measure rectus femoris and vastus lateralis mCSA in the dominant leg, following 72 h of lower-limb activity restriction. Standardised landmarks between the greater trochanter and the lateral femoral epicondyle were used, and subjects were instructed to relax their muscles as much as possible. Maximal care was taken to avoid applying pressure to the tissue at the measurement site. Images were processed in GIMP® software (GNU imaging program, 2.10.24), and the muscle area was evaluated using the ImageJ® software (Madena 3.2.5, EyePhysics), as previously described and validated(Reference Lixandrão, Ugrinowitsch and Bottaro32,Reference Damas, Phillips and Lixandrão33) .
Body composition
Body composition was determined via air-displacement plethysmography (BOD POD; Life Measurement Instruments) following standard protocols(Reference Fields, Higgins and Hunter34). Body density was calculated via pressure/volume measurements and converted to fat mass via the Siri equation(Reference Siri35). The following variables were derived from this assessment: fat mass (kg) and lean mass (kg)
Muscle biopsy and tissue preparation
Muscle samples (∼80 mg) were collected from a subsample of participants from both groups (n 14; PLA: n 7; W3: n 7), from the vastus lateralis muscle in their dominant leg, at rest (fasted) and 4 h after an acute resistance training session with whey protein ingestion (0·4 g/kg of body mass of protein). The acute resistance exercise bout performed during the biopsy trials followed the same exercise structure used in the supervised training sessions, consisting of 45° leg press and leg extension exercises. Biopsies were performed under local anesthesia using a suction needle (Bergstrom model). Samples were cleaned, removing excess blood and connective tissue. Muscle samples were quickly frozen in liquid nitrogen, except muscle fibre cross-sectional area samples, for which fibres were oriented transversely in Tissue-Tek O.C.T. Compound and frozen; first, in isopentane cooled by liquid nitrogen, and then in liquid nitrogen. Samples were stored at −80°C until analysis.
Muscle fibre cross-sectional area
Frozen tissue was sectioned at 10 µm in a cryostat (Leica, CM1850), samples were washed in phosphate-buffered saline (PBS), then submerged in PFA 4 % for 10 min and washed in PBS-T (PBS + Tween 0·1 %). Afterwards, samples were immersed in citric acid buffer solution at 95℃ for 5 min and washed in PBS-T, then blocked twice with buffer solutions (1st: PBS, 3 % bovine serum albumin-BSA, 5 % mouse serum; 2nd: PBS-T, 3 % bovine serum albumin-BSA, 5 % goat serum) for 40 min each and washed in PBS-T. Slides were incubated overnight at 4°C with primary antibody (Anti-rabbit Laminin [1:200, Sigma]), and then washed and incubated for 60 min at room temperature with secondary antibody (Alexa Fluor® 594-AffiniPure Donkey Anti-Rabbit [1:250, Thermo Fisher Scientific]) protected from light and washed again. Sudan Black B solution was applied for 1·5 min, and slides were washed with 50 % ethanol and with PBS. For mounting, the slides were covered with coverslips, using Vectashield® antifade mounting medium with 4’,6-diamidino-2-phenylindole .
Fluorescent images were captured using a Leica DMi8 automated fluorescence microscope, using 40× objective. Images were acquired using the same fluorescence channel/filter and a fixed exposure time of 2·79 s, which was based on the background signal obtained from the negative control. Camera gain was not manually adjusted by the operators and remained under the default automatic settings of the acquisition system. No post-acquisition image adjustments were applied before quantification. Imaging scales were validated using the ImageJ program, and quantification of fAST by laminin labelling was performed with MyoVision2® software(Reference Calulo Rivera, González-Seguel and Horikawa-Strakovsky36,Reference Viggars, Wen and Peterson37) , utilising the ‘exclude regions’ function to ensure random stains were not misidentified as cells.
Anabolic signalling
Phosphorylation of mTOR, p70S6K and 4E-BP1 was assessed at four timepoints: T1 (rested and fasted, pre-intervention), T2 (4 h post-exercise, pre-intervention), T3 (rested and fasted, post-intervention) and T4 (4 h post-exercise, post-intervention), and samples from seven individuals from each group were analysed. Phosphorylation levels were expressed as the ratio of phosphorylated to total protein.
Muscle proteins were extracted from 20 to 30 mg tissue, which was macerated and lysed in RIPA buffer supplemented with protease and phosphatase inhibitor cocktail, then centrifuged at 15 000 rpm for 10 min at 4°C. The supernatant was collected, and total protein concentration was quantified by the Bradford method (Bio-Rad). 40 μg of protein was loaded into a 4–20 % polyacrylamide gel for electrophoresis, with a 4 % stacking gel. After separation, proteins were transferred to a nitrocellulose membrane using a transfer buffer containing 20 % methanol and monitored using 0·5 % Ponceau S staining. Membranes were blocked for 1 h with a 5 % BSA solution in TBS-T and then incubated overnight at 4°C with the primary antibody diluted in 5 % BSA in the following concentrations: anti-mTOR 1:1000 (Cell Signaling Technology # 2972), anti-Phospho-mTOR (Ser2448) 1:1000 (Cell Signaling Technology #2971), anti-P70s6K 1:1000 (Cell Signaling Technology #9202), anti-Phospho-P70s6K (Thr389) 1:1000 (Cell Signaling Technology #9205), anti-4E-BP1 1:1000 (Cell Signaling Technology # 9452), anti-Phospho-4E-BP1 (Thr70) 1:1000 (Cell Signaling Technology #9455) anti-Glyceraldehyde 3-phosphate dehydrogenase (GAPDH) 1:1000 (Cell Signaling Technology #2118). Membranes were then incubated with secondary antibodies conjugated with peroxidase (goat anti-rabbit polyclonal; 1:10 000) for 1 h.
Protein bands were visualised using chemiluminescence (SuperSignal West Femto Chemilumininescent Substrate, Thermo Scientific®), detected using the GENESYS imaging system and quantified by densitometry using ImageJ® software(Reference Taylor, Berkelman and Yadav38). GAPDH was detected on the same membrane as each corresponding protein of interest and was used to control for loading variability. Each target protein signal was normalised to the GAPDH signal from the same sample/lane and membrane to control loading variability(Reference Bass, Wilkinson and Rankin39). Subsequently, the normalised intensity of each phosphorylated protein was divided by the normalised intensity of its respective total form to obtain the phosphorylation ratio(Reference Aldridge, Podrebarac and Greenough40).
To assess whether GAPDH signal varied systematically across experimental conditions, raw GAPDH densitometric signals were analysed across groups and timepoints for each membrane. No significant group × time interactions, main effects of group or main effects of time were observed for GAPDH signal intensity in any membrane (all P > 0·05; online Supplementary Table 3).
n-3 PUFA incorporation in muscle tissue
The lipid fractions of the muscle tissue were extracted via a modified Folch method(Reference Folch, Less and Sloane Stanley41), with samples ground in a Polytron® at maximum rotation and subjected to additional centrifugation steps for better extraction. 30 µl of BHT and 50 µl of tridecanoic fatty acid (C13:0) were added as an internal standard and homogenised in a vortex. Then, direct methylation of fatty acids was carried out(Reference Shirai, Suzuki and Wada42). 1 ml of isooctane was added and homogenised by vortexing, followed by the addition of 5 ml of saturated NaCl and vortexing again. After 5 min of rest, the supernatant was collected, dried under nitrogen gas and resuspended in 250 µl of ultrapure hexane.
The chromatographic analysis was performed in a GC coupled to a mass spectrometer (GC-MS-QP2010 Ultra; Shimadzu®), with an automatic injector (AOC-20i®). The chromatographic column was composed of Stabilwax fused silica, 100 m long, 0·25 mm internal diameter and 0·25 μm thick, from the Restek® brand. Ultrapure helium gas was used as the carrier gas at a flow rate of 1·3 ml/min. A total of 1 μl of sample was injected at a split ratio of 1:10. The injector temperature was maintained at 250°C, while the oven heating program started at 80°C, with a heating rate programmed at a ramp of 5°C/min to 175°C, followed by a heating rate of 3°C/min to 230°C, where the temperature was maintained for 20 min. The mass spectrometer followed the following conditions: ionisation voltage of 70 eV, ionisation source temperature of 200°C, full scan mode with an amplitude of 35–500 m/z and a speed of 0·2 sec per scan. Lipid quantification was expressed as μg/mg of tissue using the ratio of the sample peak area to the standard peak area.
Statistical analysis
Normality was assessed by the Shapiro–Wilk test. Student’s t tests for independent measures was performed for baseline between-group comparisons and for adherence to the experimental protocol (i.e. training and supplementation) and total volume load comparisons. Fisher’s exact test was used to compare perceived adverse effects and blinding assessment between groups.
The effects of n-3 PUFA supplementation on body composition, muscle cross-sectional area, maximal dynamic strength, muscle tissue fatty acid composition, muscle fibre morphology and anabolic signalling outcomes were analysed using mixed models for repeated measures. Group (W3 and PLA), time (PRE and POST) and the group × time interaction were included as fixed effects, and participants were included as a random effect. Model-derived least-square means were used to estimate group, time and group × time effects. An autoregressive covariance structure [AR(1)] was used to account for within-participant repeated measures, and degrees of freedom were estimated using the Kenward–Roger approximation. A Bonferroni-corrected α level of 0·0125 was used, corresponding to comparisons within each group and between groups at each time point (W3-PRE v. W3-POST; PLA-PRE v. PLA-POST; W3-PRE v. PLA-PRE; W3-POST v. PLA-POST).
Data were analysed according to the intention-to-treat principle using all available observations in the mixed models. The main effect of time was expressed as the estimated time difference (ETD; Post–Pre, collapsed across groups), and the group × time interaction was expressed as the estimated mean difference (EMD) in change between groups (EMD; ΔW3–ΔPLA). Data are presented as mean (standard deviation (sd)), least-square means (LSMeans) and 95 % CI, estimated time difference (ETD) and 95 % CI, estimated group difference (EGD; W3–PLA) and 95 % CI, or EMD and 95 % CI, as appropriate. Statistical significance was set at P < 0·05 for primary fixed effects. Analyses were conducted using SAS Studio.
Results
Participant characteristics
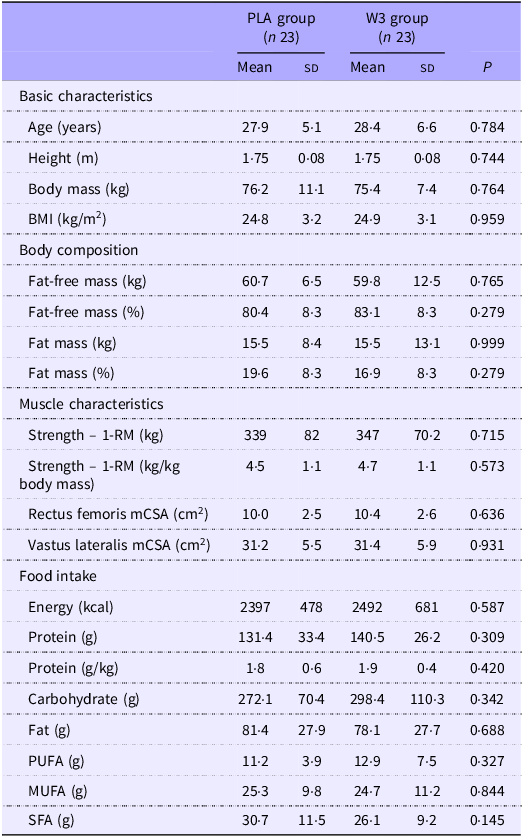
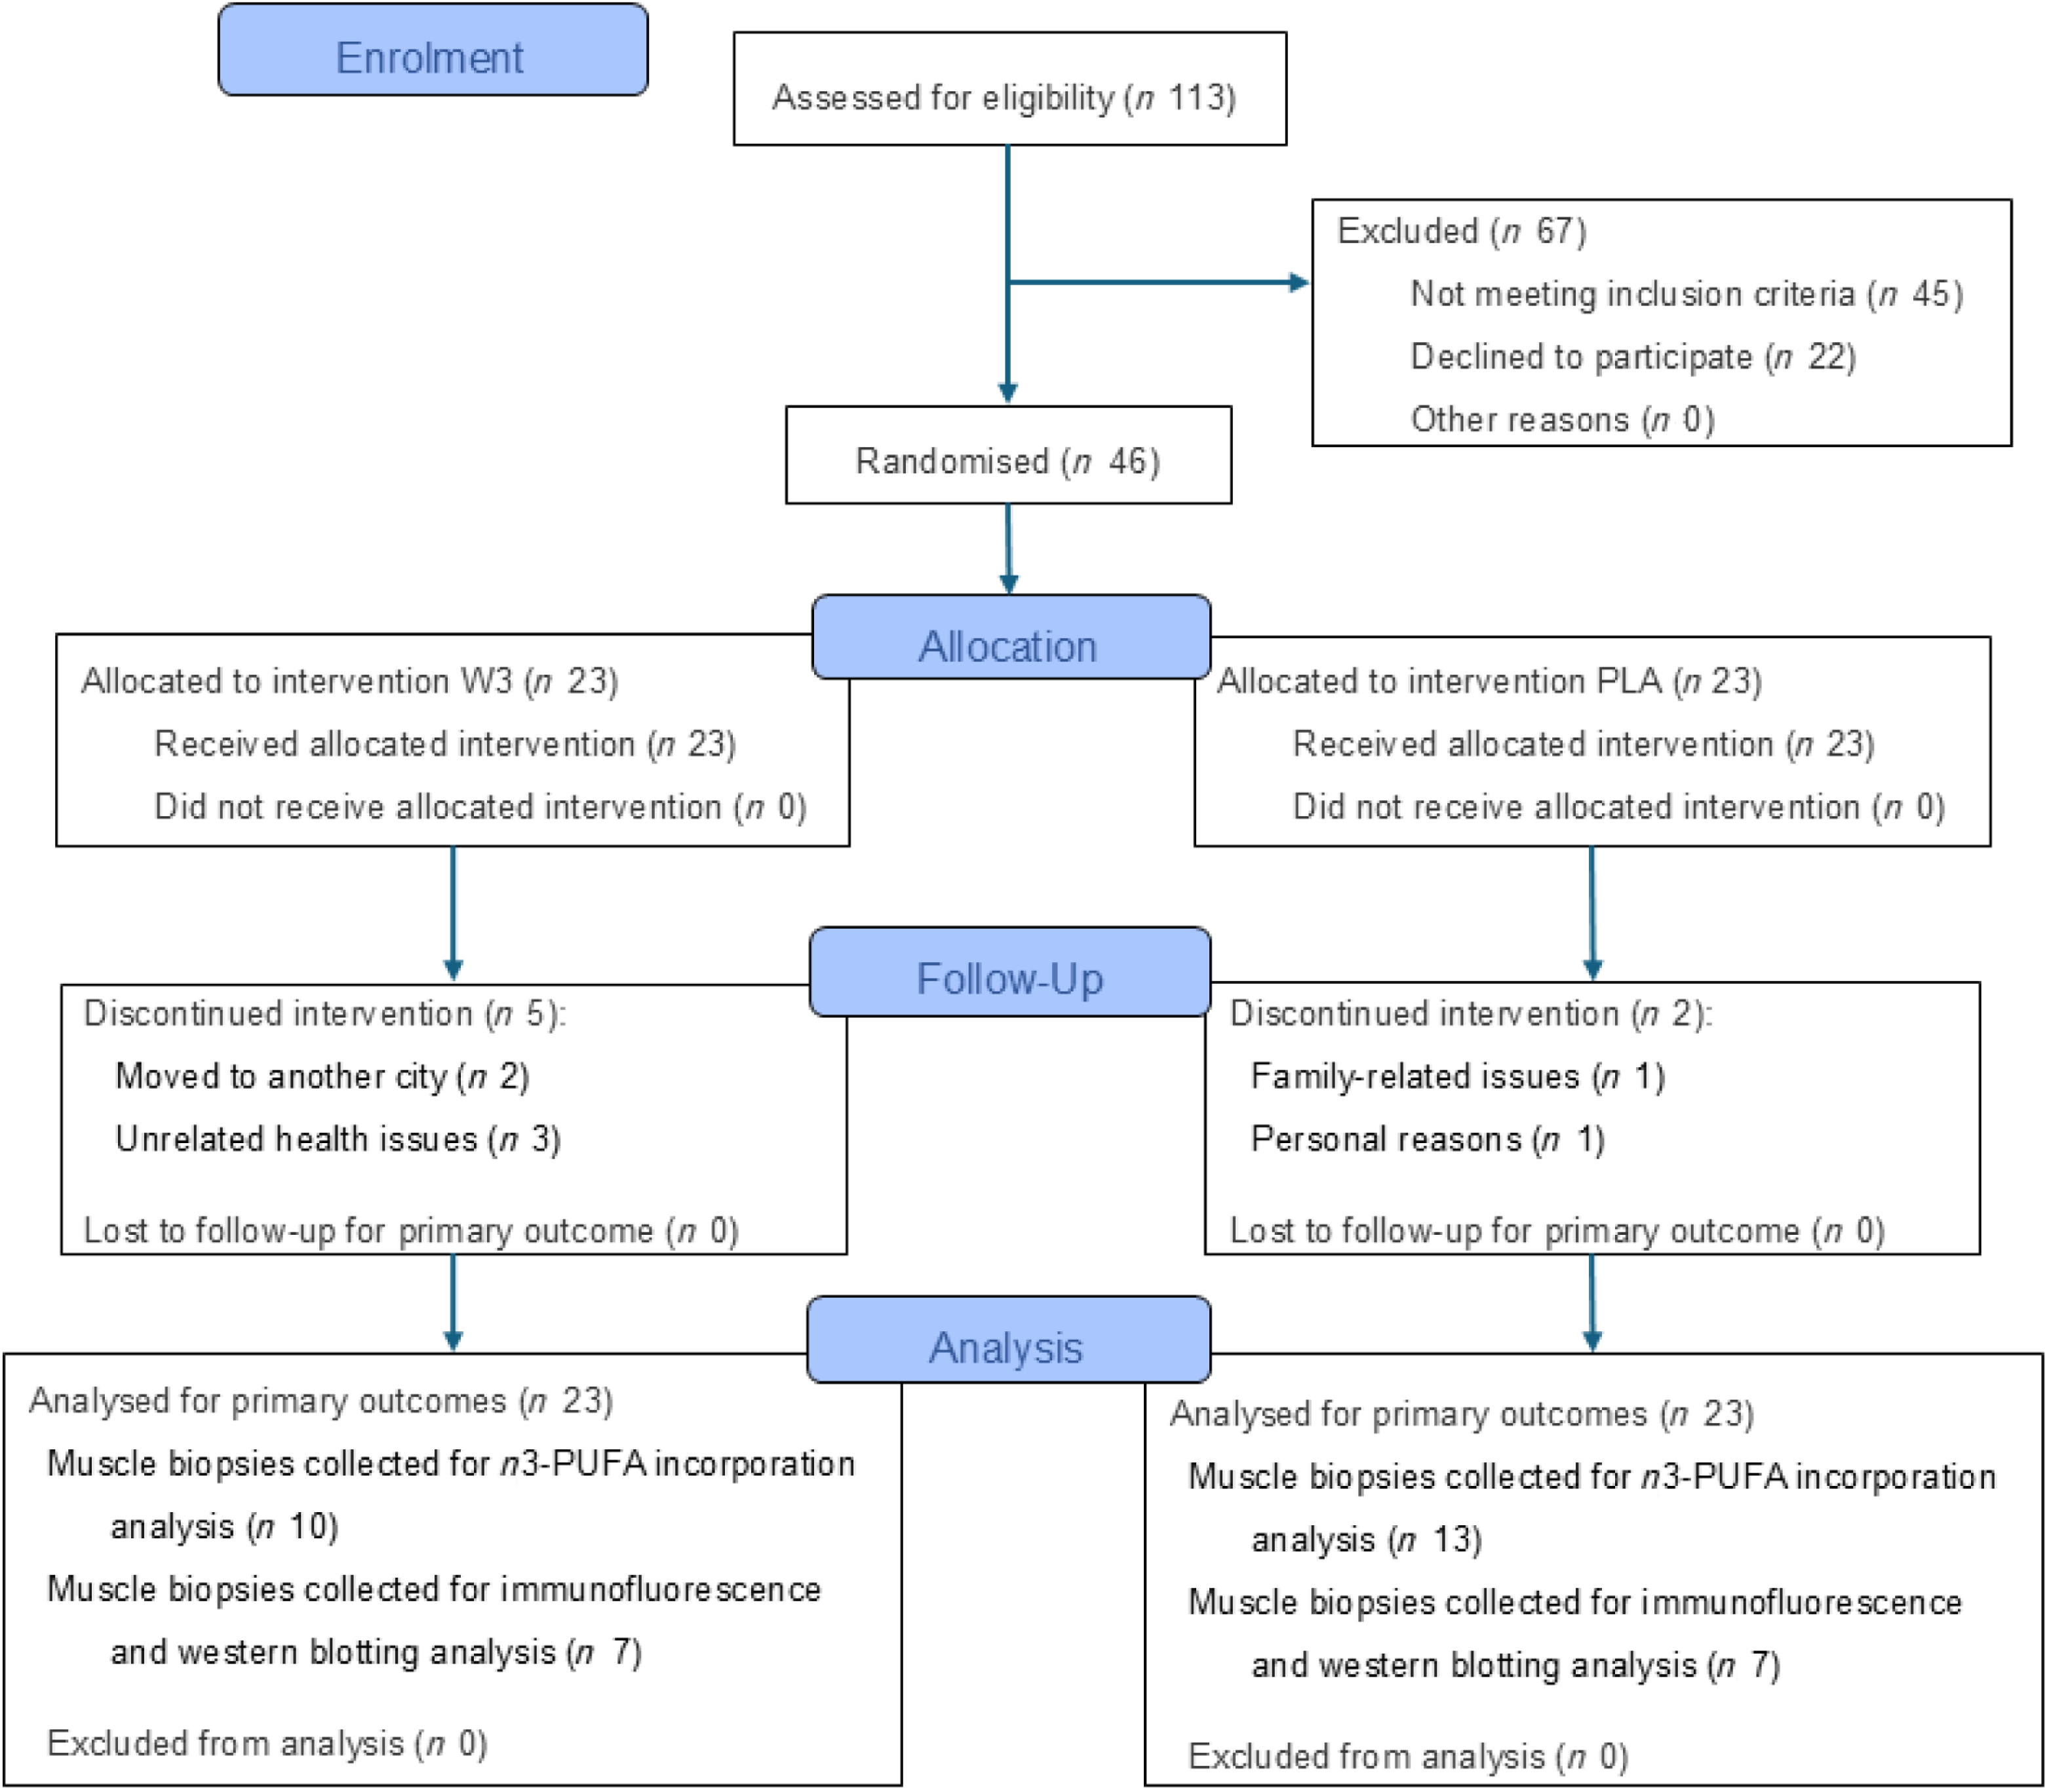
A total of 113 individuals were assessed for eligibility; sixty-seven were excluded for not meeting the inclusion criteria or declining to participate. Thus, forty-six resistance-trained healthy young adult males were enrolled in the study between January 2022 and December 2023. No statistically significant differences between groups were observed at baseline. Descriptive data and baseline between-group comparisons are presented in Table 1.
Participants’ characteristics

Table 1. Long description
Participants’ characteristics. Data presented as Mean ± Standard Deviation. Data compared using independent t-tests. Abbreviations: BMI = Body Mass Index; 1-RM = one-repetition maximum test; mCSA = Muscle cross-sectional area.
1-RM, one-repetition maximum test; mCSA, muscle cross-sectional area.
Data presented as Mean (standard deviation). Data compared using independent t tests.
During the intervention, seven participants discontinued participation: five from the W3 group (three due to health issues unrelated to trial protocol and two due to relocation) and two from the PLA group (due to personal or family-related reasons). Ultimately, thirty-nine participants completed the intervention: eighteen in the W3 group and twenty-one in the PLA group (Figure 2).
CONSORT flow diagram of participant progress through the trial. The figure depicts the number of individuals assessed for eligibility, randomied, allocated to each intervention, lost to follow-up or discontinued and included in the final analysis in each group.

Figure 2. Long description
CONSORT flow diagram of participant progress through the trial. The figure depicts the number of individuals assessed for eligibility, randomized, allocated to each intervention, lost to follow-up or discontinued, and included in the final analysis in each group.
Adherence and adverse effects
Both groups demonstrated high compliance with the protocol. Supplementation adherence was high in both groups but significantly greater in W3 (98·39 (sd 2·95) %) compared with PLA (94·37 (sd 7·93) %; P = 0·041; EGD: 4·02 %, 95 % CI: 0·01, 8·03). Some adverse events were reported. Eructation (fish burps) was reported by 22·2 % of the W3 group, whereas mild gastrointestinal alterations were reported by a small proportion of participants in both groups (PLA: 4·8 % v. W3: 5·6 %). The overall distribution of perceived adverse effects showed a trend towards a between-group difference (P = 0·054). No significant between-group difference was observed in blinding assessment (PLA: 57·1 % v. W3: 77·8 %; P = 0·161). One participant in the W3 group did not provide a guess. Online Supplementary Table 4 summarises participants’ adherence to the study protocol, perceived adverse effects and blinding assessment.
Resistance training programme attendance was also high in both groups (W3: 99·01 (sd 1·65) % and PLA: 96·77 (sd 4·78) %) (P = 0·055, EGD: 2·24 %, 95 % CI: −0·16, 4·64). There was no significant difference in total volume load between groups (P = 0·291, EGD: 44 719·0 kg, 95 % CI: −43 207·9, 132 646·0), indicating similar training load exposure during the intervention.
n-3 PUFA incorporation in muscle tissue
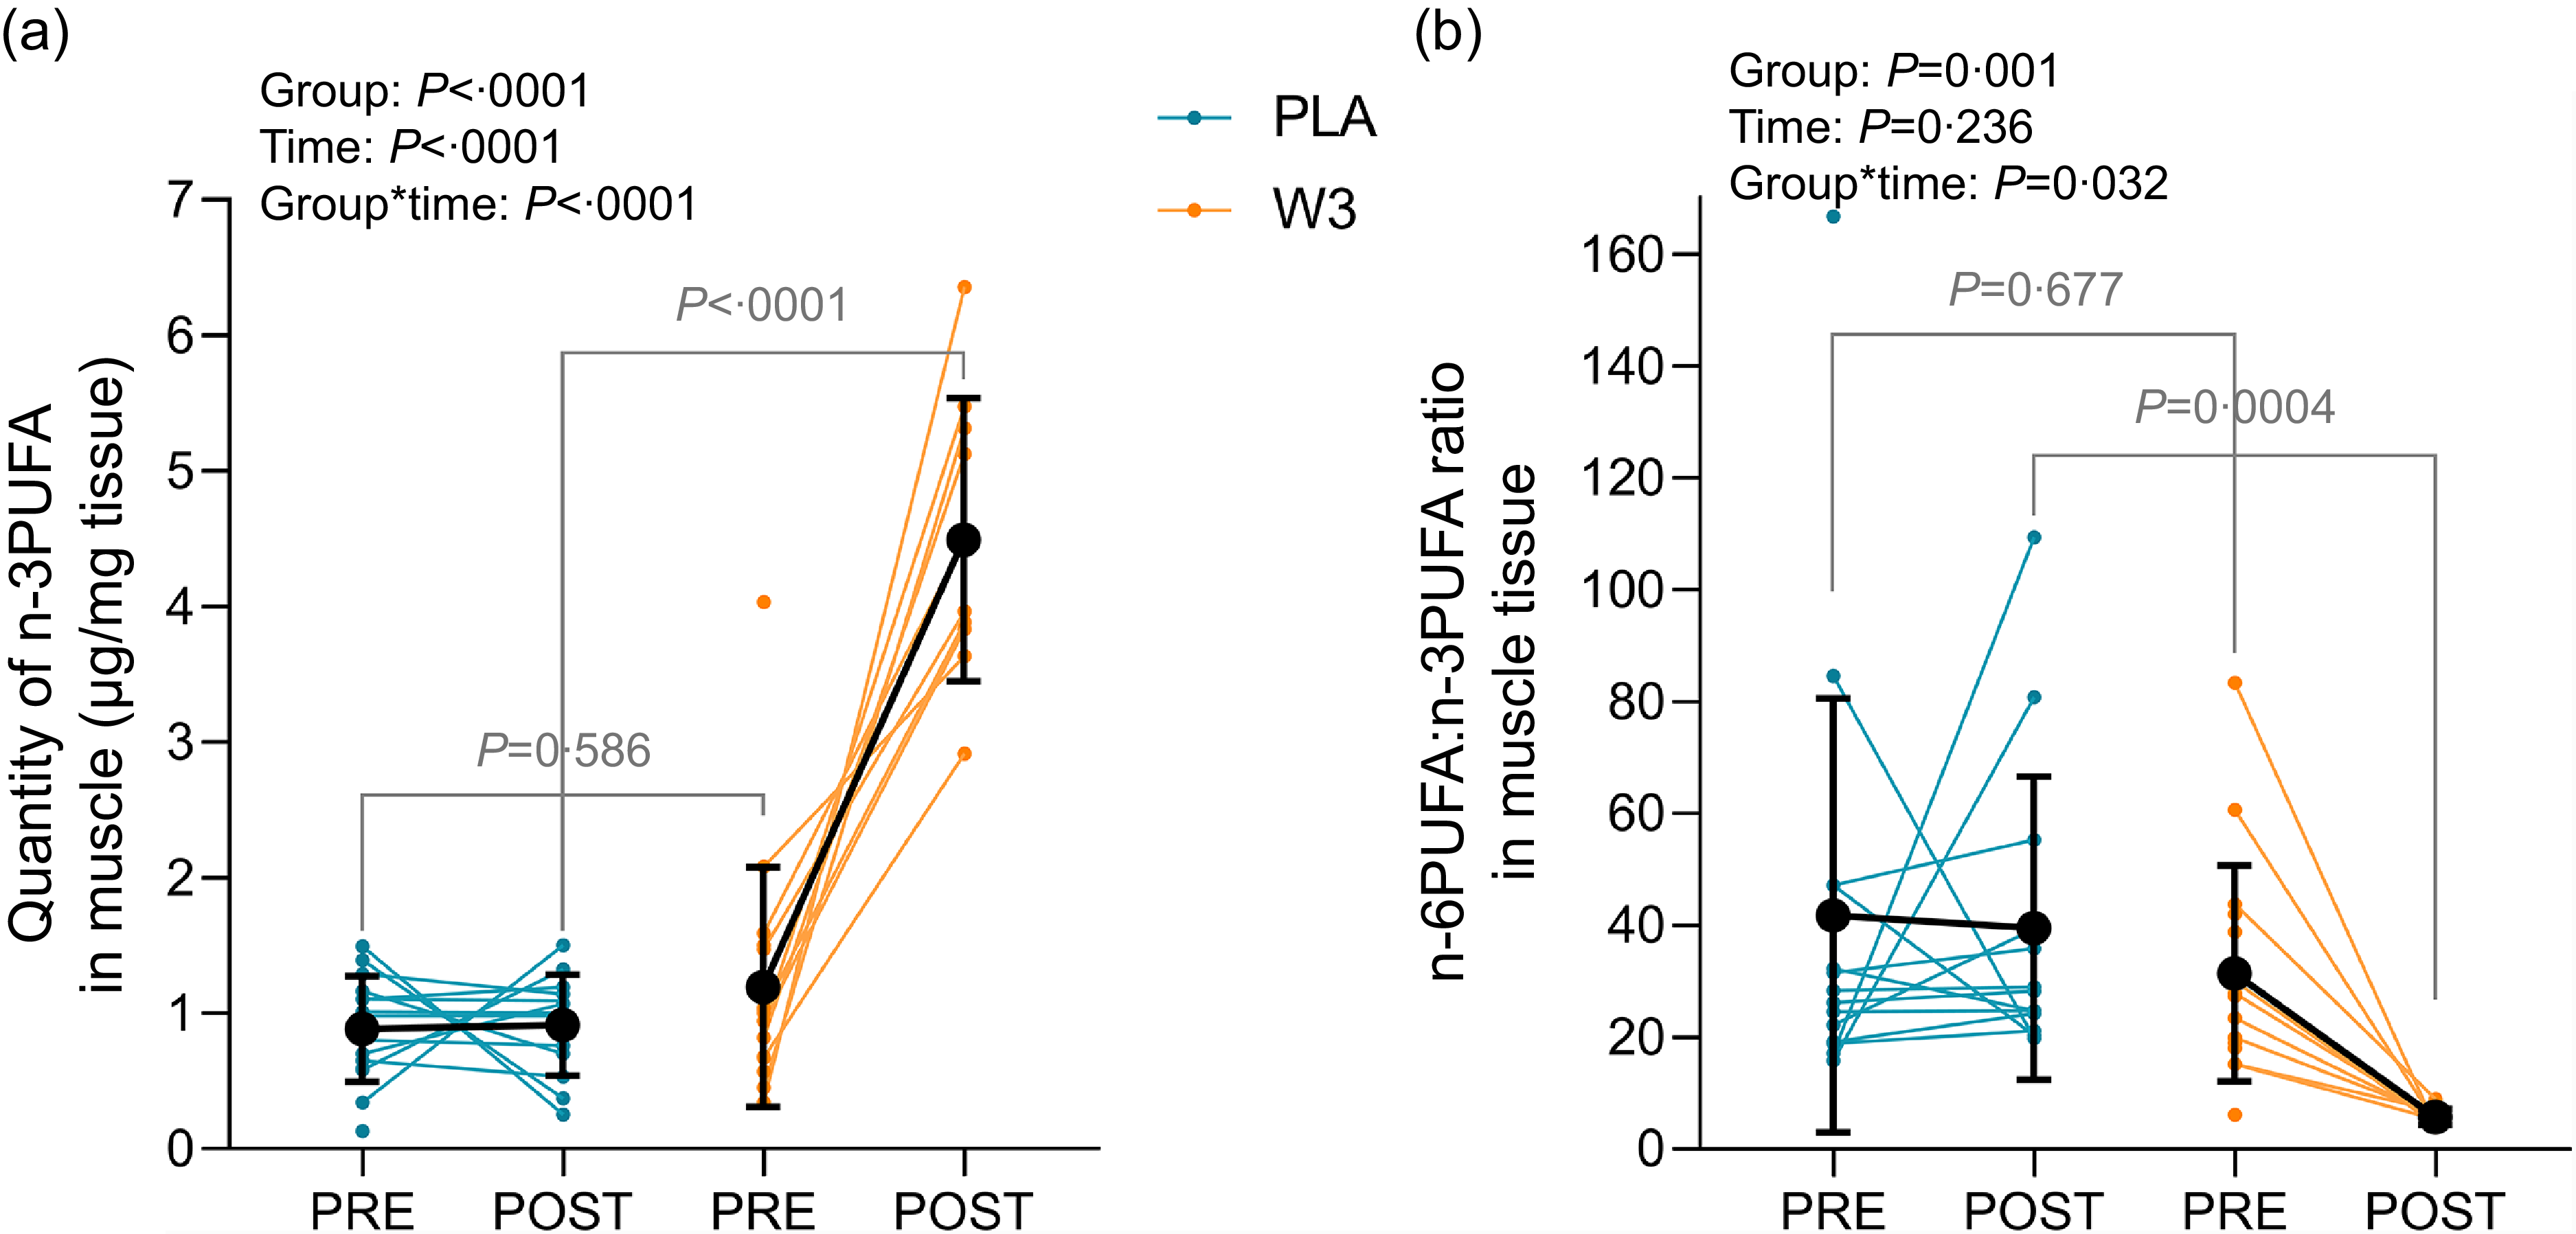
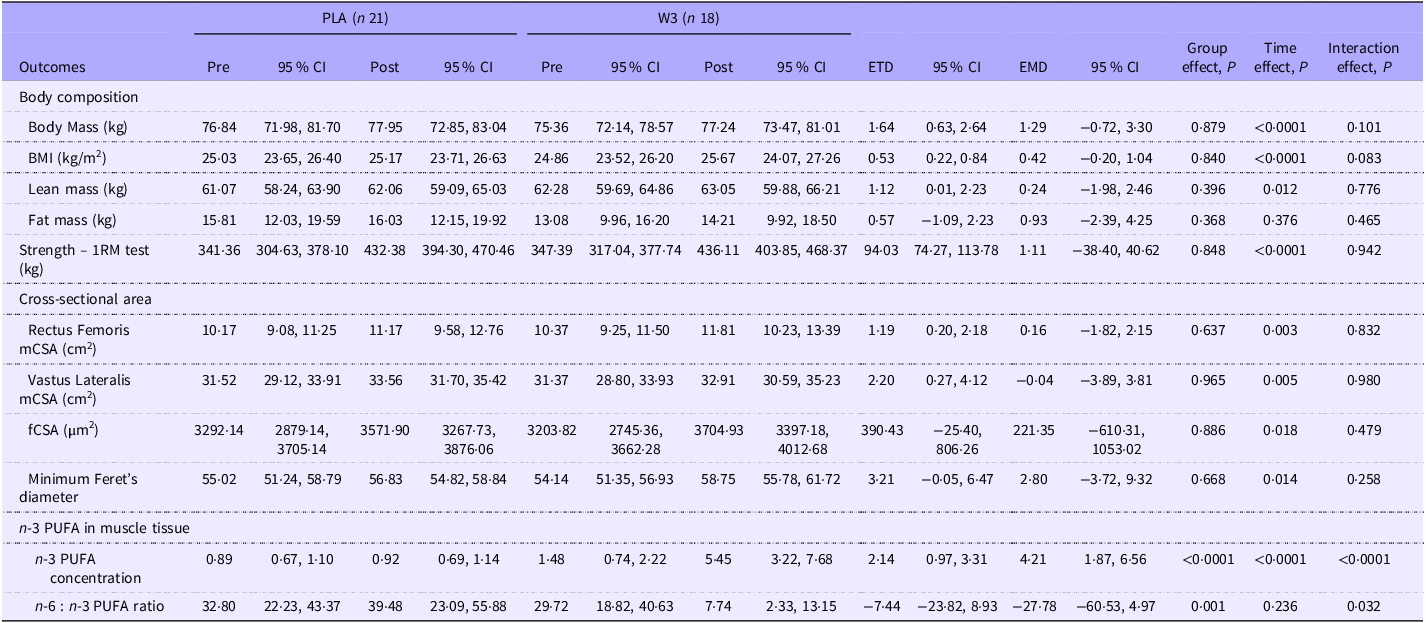
A significant incorporation of n-3 PUFA into muscle tissue was seen in W3 (+4·24 µg/mg post-intervention) but not in PLA group (+0·03 µg/mg) (P < 0·0001; interaction effect, EMD: 4·21 µg/mg, 95 % CI: 1·87, 6·56; Figure 3(a)). Consequently, n-6 to n-3 PUFA ratio was also significantly lower in W3 group after the intervention (P = 0·032, EMD: –27·78, 95 % CI: –60·53, 4·97; Figure 3(b)).
Incorporation of n-3 PUFA in skeletal muscle. A: Changes in the absolute concentration of n-3 PUFA in muscle tissue from pre- to post-intervention. B: Changes in the n-6:n-3 PUFA ratio in muscle tissue from pre- to post-intervention. Data are presented as individual responses with group means (sd). A significant group × time interaction was observed for both outcomes. Unconnected PRE data points represent participants who completed baseline testing but did not complete post-intervention assessments. These participants were retained in the intention-to-treat mixed-model analysis.

Figure 3. Long description
Incorporation of n−3 polyunsaturated fatty acids (PUFA) in skeletal muscle. A: Changes in the absolute concentration of n−3 PUFA in muscle tissue from pre- to post-intervention. B: Changes in the n−6:n−3 PUFA ratio in muscle tissue from pre- to post-intervention. Data are presented as individual responses with group means ± SD. A significant group × time interaction was observed for both outcomes. Unconnected PRE data points represent participants who completed baseline testing but did not complete post-intervention assessments. These participants were retained in the intention-to-treat mixed-model analysis.
Dietary intake
Regarding dietary assessment, participants maintained a stable intake throughout the protocol, with no significant differences between groups in energy, protein, carbohydrate, fat or PUFA intake (all P > 0·2). Protein intake varied between 1·79 and 1·96 g/kg body mass in PLA and 1·63 and 1·92 g/kg body mass in W3 group, remaining within the target range throughout the intervention, although individual variability was observed across assessment time points. PUFA ranged between 11·0 and 12·6 g in PLA and between 10·5 and 15·9 g in W3 group. Online Supplementary Figure 1 illustrates food intake during the study protocol.
Body composition
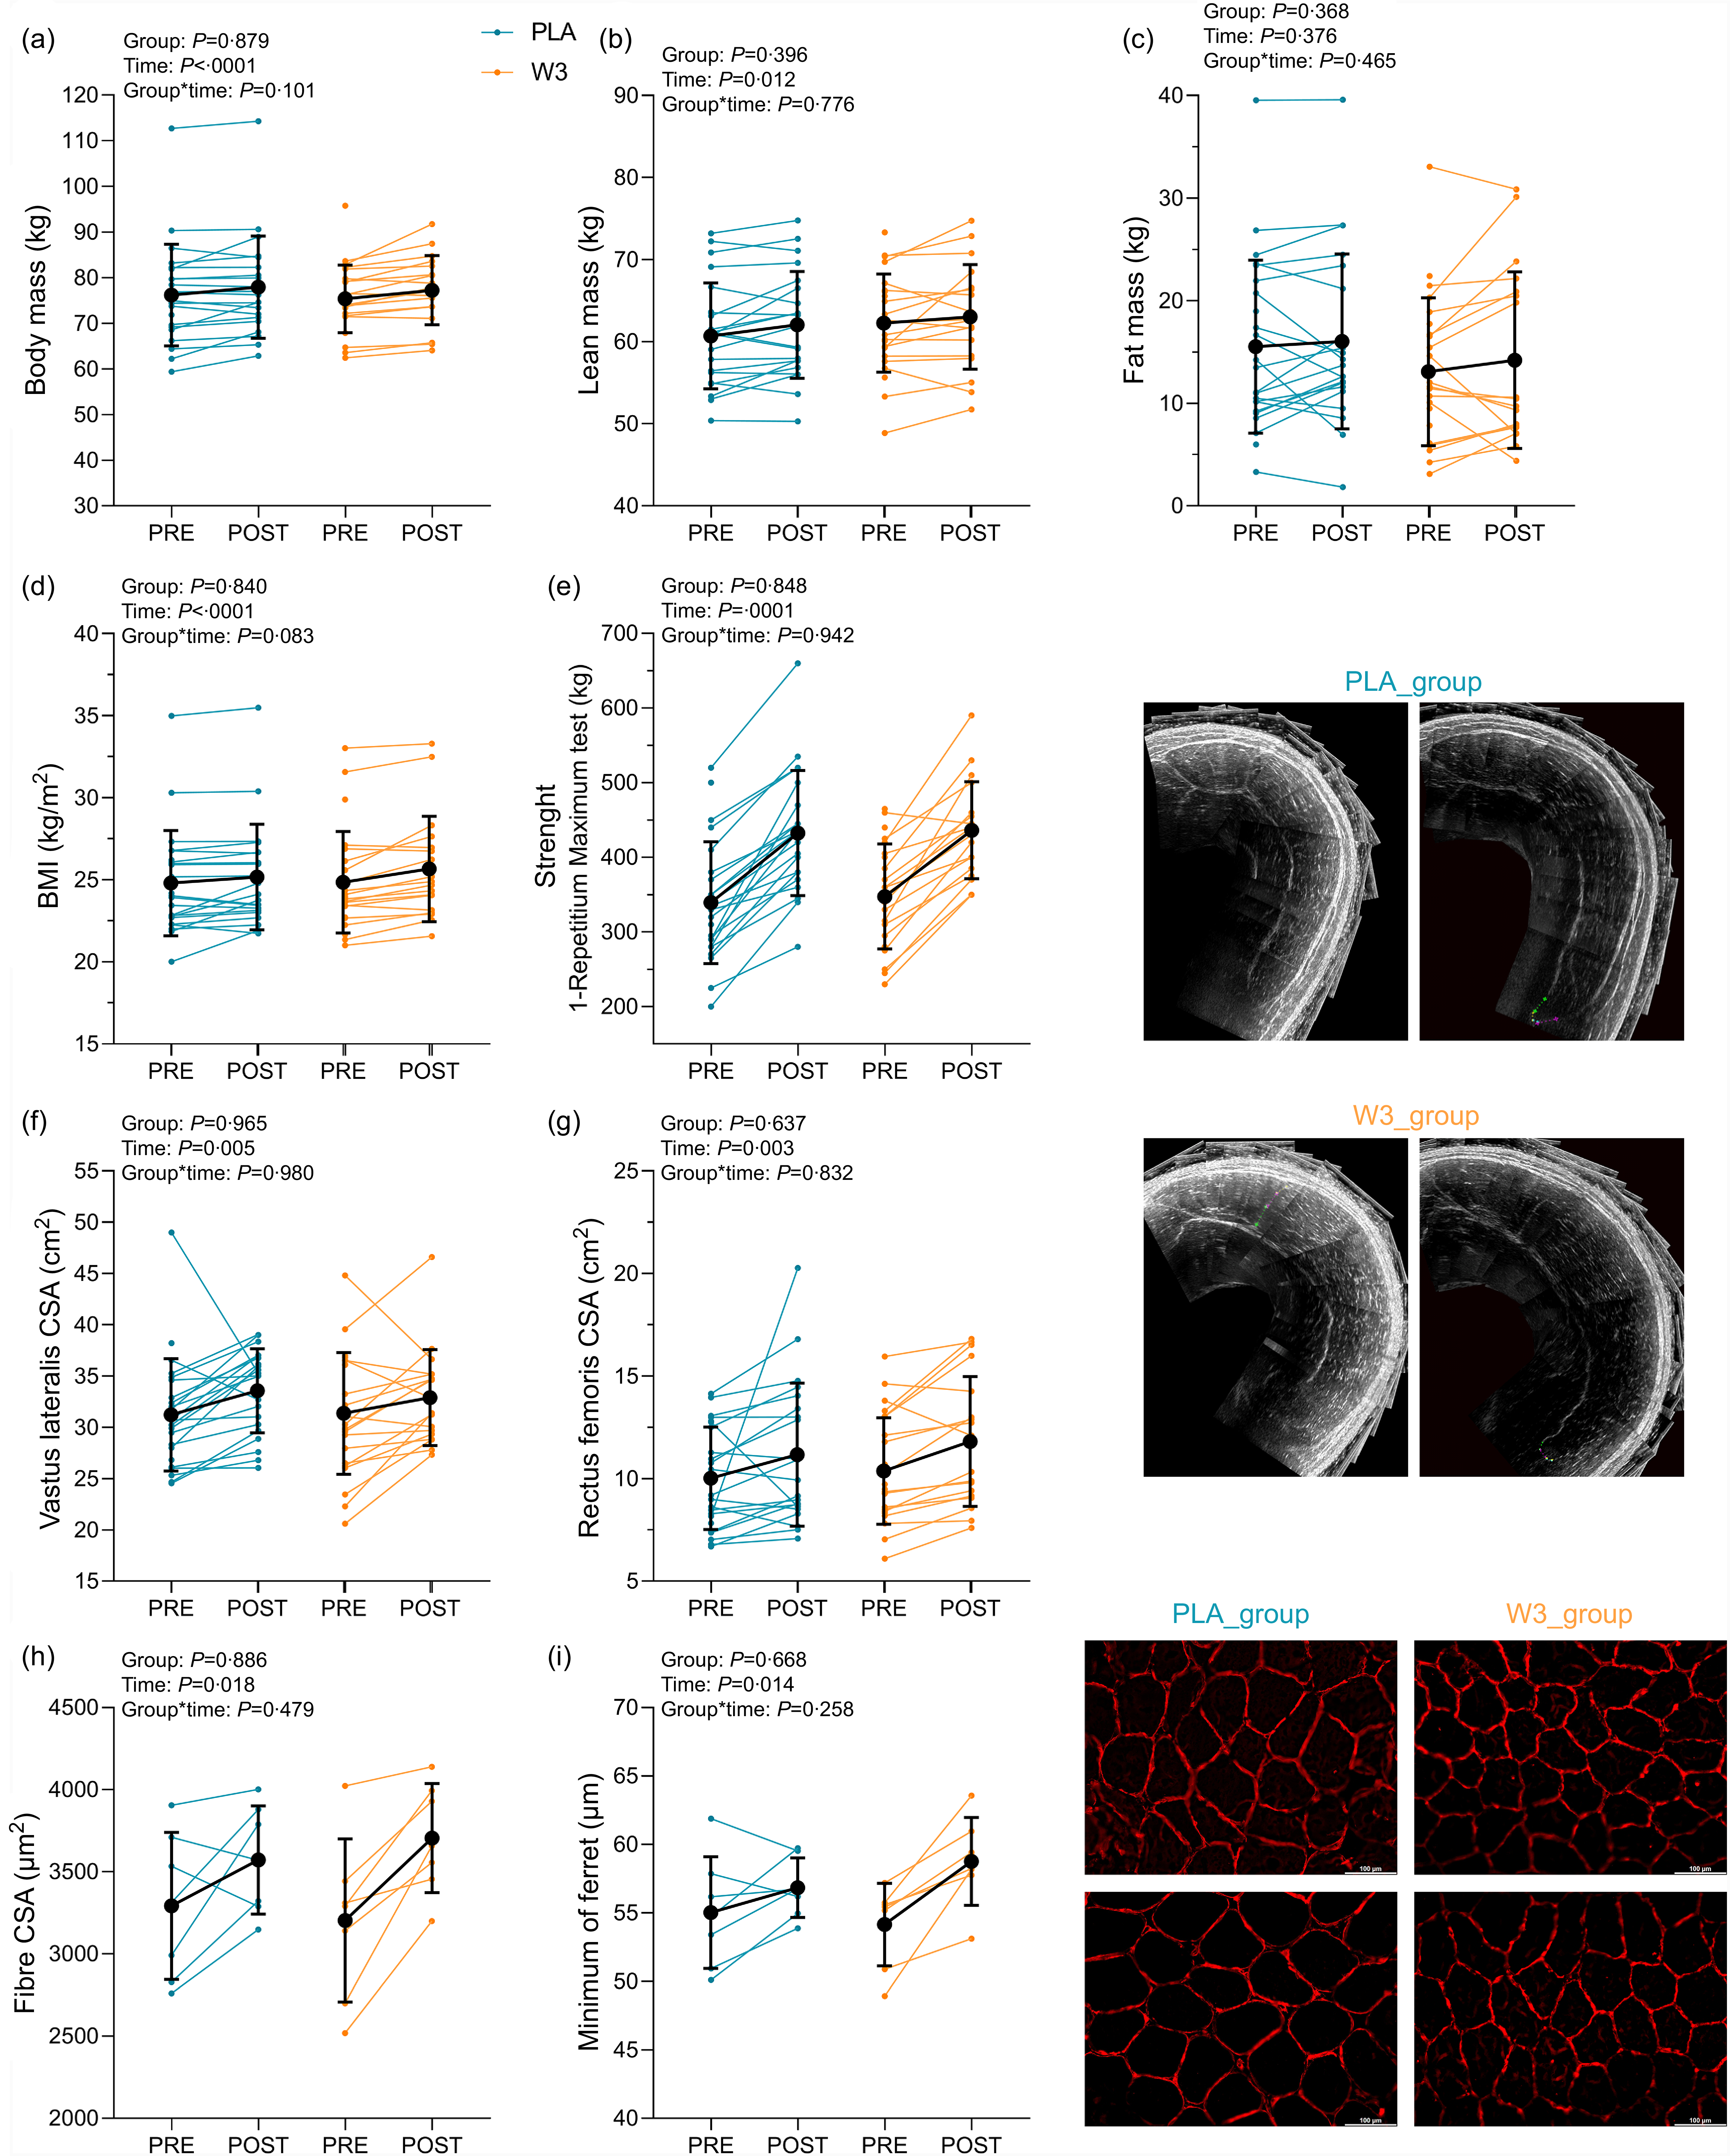
No significant group × time interaction or group effects were observed for body mass, BMI, lean mass and fat mass (all P > 0·08). A significant effect of time was observed for body mass (ETD: 1·64 kg, 95 % CI: 0·63, 2·64, P < 0·0001; Figure 4(a)), BMI (ETD: 0·53 kg/m2, 95 % CI: 0·22, 0·84, P < 0·0001; Figure 4(d)) and lean mass (ETD: 1·12 kg, 95 % CI: 0·01, 2·23, P = 0·012; Figure 4(b)), with slight increases in both groups. Fat mass did not significantly change over time (ETD: 0·57 kg, 95 % CI: –1·09, 2·23, P = 0·376; Figure 4(c)).
Changes in body composition, strength (1-RM), muscle cross-sectional area (mCSA), muscle fibre from pre- to post-intervention. (a) Body mass, (b) lean mass, (c) fat mass, (d) BMI, (e) strength, (f) mCSA of the vastus lateralis muscle, (g) mCSA of the rectus femoris muscle, (h) muscle fibre cross-sectional area (fCSA), (i) muscle fibre minimum of Ferret. Data are presented as individual responses with group means (sd). Unconnected PRE data points represent participants who completed baseline testing but did not complete post-intervention assessments. These participants were retained in the intention-to-treat mixed-model analysis. 1-RM, one-repetition maximum.

Figure 4. Long description
Changes in body composition, strength (1-RM). muscle cross-sectional area (mCSA), and muscle fiber from pre- to post-intervention. a. Body mass, b. Lean Mass, c. Fat Mass, d. BMI, e. Strength, f. mCSA of the vastus lateralis muscle, g. mCSA of the rectus femoris muscle, h. muscle fiber cross-sectional area (fCSA), i. Muscle fiber minimum of Ferret. Data are presented as individual responses with group means ± SD. Unconnected PRE data points represent participants who completed baseline testing but did not complete post-intervention assessments. These participants were retained in the intention-to-treat mixed-model analysis.
Muscle strength and hypertrophy
No significant interaction was observed for maximal dynamic strength (EMD: 1·11 kg, 95 % CI: −38·40, 40·62, P = 0·942), rectus femoris mCSA (P = 0·832), vastus lateralis mCSA (P = 0·980), fCSA (P = 0·479) or the minimum Feret’s diameter (P = 0·258).
A significant increase over time was observed in both groups for maximal dynamic strength (ETD: 94·03 kg, 95 % CI: 74·27, 113·87, P < 0·0001; Figure 4(e)), rectus femoris mCSA (ETD: 1·19 cm2, 95 % CI: 0·20, 2·18, P = 0·003; Figure 4(g)) and vastus lateralis mCSA (ETD: 2·20 cm2, 95 % CI: 0·27, 4·12, P = 0·005; Figure 4(f)). fCSA also increased significantly over time in both groups (ETD: 390·43 µm2, 95 % CI: –25·4, 806·26, P = 0·018; Figure 4(h)) and for the minimum Feret’s diameter (ETD: 3·21 µm, 95 % CI: –0·05, 6·47, P = 0·014; Figure 4(i)). Table 2 displays detailed data on changes in body composition, muscle strength, hypertrophy, and n-3 PUFA in the muscle tissue from pre- to post-intervention.
Changes in body composition, muscle strength, hypertrophy and n-3 PUFA in the muscle tissue from pre- to post-intervention

Table 2. Long description
Changes in body composition, muscle strength, hypertrophy, and n-3 PUFA in the muscle tissue from pre- to post-intervention. Data are presented as LSMeans (95%CI), ETD (95%CI), and EMD (95%CI). Abbreviations: ETD, estimated time differences; EMD, estimated mean difference; 95%CI, 95% confidence interval.
ETD, estimated time differences; EMD, estimated mean difference.
Data are presented as LSMeans (95 % CI), ETD (95 % CI) and EMD (95 % CI).
Anabolic signalling
No significant group × time interactions, main group effects or main time effects were observed for the phosphorylation ratios of mTOR, p70S6K or 4E-BP1 (all P > 0·05). Responses to acute and chronic exercise, as well as supplementation, did not differ significantly between groups. Online Supplementary Figure 2 displays the phosphorylation ratios and representative blots for each protein (Panel A: mTOR, Panel B: p70S6K, C: 4E-BP1).
Discussion
The present study aimed to evaluate the effects of n-3 PUFA supplementation on muscle mass and strength in response to a resistance training programme in healthy young men screened for adequate protein intake. Our results demonstrated that, although there was a significant incorporation of n-3 PUFA into skeletal muscle tissue in the W3 group, no additional gains were observed in fat-free mass, muscle hypertrophy, strength or anabolic signalling compared with the PLA group. These findings suggest that, in young resistance-trained men exposed to two potent anabolic stimuli (i.e. structured resistance training and broadly adequate protein intake), n-3 PUFA supplementation does not provide additional benefits for muscle hypertrophy or strength.
Previous studies have demonstrated that dietary protein intake is a critical modulator of muscle hypertrophy in response to resistance training, and protein intakes around ∼1·6 g/kg/d are generally considered sufficient to maximise training adaptations in healthy adult men(Reference Morton, Murphy and McKellar26). In the present study, participants in both groups maintained a high protein intake throughout the intervention (∼1·6–1·9 g/kg/d), although individual variability was observed across time points. Our findings are consistent with McGlory et al. (2016), who reported no additive effect of 8-week n-3 PUFA supplementation on muscle protein synthesis in healthy young men following a single session of resistance exercise and protein ingestion(Reference Mcglory, Wardle and Macnaughton23). In contrast, the positive anabolic responses reported by Smith et al. were observed under hyperaminoacidemic-hyperinsulinemic clamp conditions, which provide a highly controlled and potent amino acid and insulin stimulus(Reference Smith, Atherton and Reeds8). Therefore, n-3 PUFA may influence anabolic sensitivity under specific experimentally stimulated conditions, but this does not necessarily translate into additional hypertrophic or strength gains in physiological feeding and resistance exercise contexts.
Indeed, some evidence supporting the anabolic potential of n-3 PUFA comes from studies in older adults or clinical populations, which may present higher degrees of anabolic resistance(Reference Breen and Phillips43,Reference Morton, Traylor and Weijs44) . For instance, Smith et al. (2015) showed that 6 months of n-3 PUFA supplementation increased thigh muscle volume and maximal strength in older adults(Reference Smith, Julliand and Reeds14). Similarly, Da Boit et al. (2017) observed improvements in muscle quality and strength in older women who received fish oil supplementation during resistance exercise training(Reference Da Boit, Sibson and Sivasubramaniam19). These findings suggest that n-3 PUFA may be more effective when muscle tissue is exposed to impaired anabolic sensitivity. Therefore, our findings indicate that n-3 PUFA do not appear to provide additional benefit in healthy, resistance-trained young men undergoing structured training with broadly adequate protein intake. However, future trials should directly examine whether women, older adults or individuals exposed to disuse or anabolic resistance respond differently to n-3 PUFA supplementation.
The use of a single-sex cohort also warrants specific consideration. Although the inclusion of only men was an a priori methodological decision to reduce biological variability, it limits the generalisability of our findings to women. This is relevant because some studies have suggested that skeletal muscle responses to n-3 PUFA supplementation may differ according to biological sex. For example, Da Boit et al. reported that fish-oil supplementation combined with resistance exercise training improved muscle quality and function in older women, whereas similar benefits were not observed in older men(Reference Da Boit, Sibson and Sivasubramaniam19). However, this finding should be interpreted cautiously, as this study has been identified as having important risk-of-bias concerns and exerting a disproportionate influence on pooled estimates of strength(Reference Santo André, Esteves and Barreto45,Reference Nunes, D’Souza and Steen46) . Therefore, rather than providing definitive evidence of a sex-specific effect, these data should be viewed as hypothesis-generating. Other evidence suggests that sex may be relevant in specific contexts, such as McGlory et al. that showed attenuation of muscle disuse atrophy in young women with n-3 PUFA supplementation(Reference Mcglory, Gorissen and Kamal47). And Pufahl et al. reported that EPA + DHA supplementation influenced fatty acid composition in a sex- and tissue-dependent manner(Reference Pufahl, Smart and Bureau48). Thus, it remains possible that women could respond differently to n-3 PUFA supplementation than the men studied here. Future well-controlled trials should directly examine whether biological sex modifies the effects of n-3 PUFA supplementation on muscle hypertrophy, strength, tissue fatty acid incorporation and anabolic signalling during resistance training.
Furthermore, a 2022 systematic review and meta-analysis focused on older adults, indicated that n-3 PUFA supplementation may improve lower-body strength and sit-to-stand performance, but not fat-free mass, upper-body strength or walking speed. However, after excluding studies with a high risk of bias, n-3 PUFA supplementation was no longer sufficient to improve lower-body strength or sit-to-stand performance(Reference Cornish, Cordingley and Shaw49). Similarly, our previous systematic review and meta-analysis, with adults and older adults, found no significant effects on muscle mass or function and only a minimal effect on strength, which was largely driven by a single study with important risk-of-bias concerns (Da Boit et al., 2017)(Reference Santo André, Esteves and Barreto45). More recently, an overview of reviews concluded that evidence remains insufficient to support a meaningful effect of n-3 PUFA supplementation on strength, lean body mass, mobility or physical function across both healthy and clinical populations(Reference Nunes, D’Souza and Steen46). Collectively, these findings suggest that the apparent benefits of n-3 PUFA supplementation are likely context-dependent and may be overestimated when based on studies with less rigorous control of training, diet or bias.
From a mechanistic perspective, n-3 PUFA are incorporated into skeletal muscle phospholipid membranes and have been proposed to alter membrane fluidity, lipid raft organisation, receptor function and nutrient transport(Reference Gerling, Mukai and Chabowski4,Reference McGlory, Calder and Nunes5) . These membrane-level changes could influence insulin- and amino acid-sensitive pathways upstream of mTORC1, including Akt–mTOR–S6K1 signalling. However, this mechanism is unlikely to be linear or universal and appear more pronounced when combined with amino acid or insulin stimulation than at rest(Reference Blaauw, Calder and Martindale50). In the present study, the robust increase in skeletal muscle n-3 PUFA concentrations confirms that the supplementation protocol was biologically effective and that lack of efficacy cannot be attributed to poor adherence or insufficient tissue incorporation. However, this incorporation did not translate into greater phosphorylation of mTOR, p70S6K or 4E-BP1. This dissociation suggests that incorporation of n-3 PUFA into whole muscle tissue is not, by itself, sufficient to amplify anabolic signalling when resistance exercise and protein intake already provide strong anabolic stimuli. It is also possible that the relevant effects of n-3 PUFA depend on specific membrane compartments or stimulation conditions that were not captured by whole-tissue fatty acid analysis and the selected signalling time point.
The inflammatory status of the target population may also influence the likelihood of observing skeletal muscle benefits from n-3 PUFA supplementation. n-3 PUFA are recognised for their anti-inflammatory properties, including attenuation of NF-κB signalling and reduced production of pro-inflammatory mediators(Reference Therdyothin, Phiphopthatsanee and Isanejad51). These mechanisms may be particularly relevant in contexts characterised by elevated inflammation or catabolic signalling, such as ageing or clinical conditions. By reducing inflammatory signalling and potentially lowering muscle protein breakdown, n-3 PUFA could theoretically support anabolic processes in these populations(Reference Smith, Julliand and Reeds14,Reference Da Boit, Sibson and Sivasubramaniam19) . In contrast, the participants in the present study were healthy, young, resistance-trained men, a population expected to have relatively low baseline inflammation and preserved anabolic responsiveness. Therefore, although inflammatory markers were not measured, it is plausible that an anti-inflammatory mechanism had limited opportunity to influence muscle adaptation in the present context.
A key strength of the present study is that it provides a rigorous test of whether n-3 PUFA supplementation adds to the effects of established anabolic stimuli. Many previous trials have been limited by incomplete control for key confounding variables, such as total energy intake, dietary protein intake, PUFA intake and participants’ physical activity. In contrast, the present randomised, double-blind, placebo-controlled trial employed rigorous monitoring of dietary intake and training adherence, both of which were consistently high across groups, thus minimising potential sources of bias. Additionally, our study featured a relatively long intervention period and a significantly elevated n-3 PUFA dosage, an approach intended to address the inconclusive findings of previous studies that may have been underdosed. By administering such a substantial dose of both EPA and DHA, we ensured our methodology was a robust test for the existence of an effect, aligning with previous recommendations for achieving measurable physiological effects(Reference Nunes, D’Souza and Steen46). A further strength of our protocol lies in its comprehensive assessment of molecular, morphological and functional parameters, allowing for a multidimensional analysis of muscle adaptation.
However, this study is not without limitations. Although supplementation adherence was high in both groups, a small but statistically significant between-group difference was observed. Nevertheless, adherence exceeded 94 % in both arms, and the W3 group demonstrated marked incorporation of n-3 PUFA into skeletal muscle tissue, supporting the biological effectiveness of the supplementation protocol. In addition, our chromatographic analysis was performed using whole muscle tissue rather than isolated membrane fractions; therefore, the specific subcellular localisation of n-3 PUFA incorporation could not be determined. Future studies using membrane-specific analyses are warranted to clarify whether incorporation into the membrane is necessary for modulating anabolic signalling and muscle adaptations. While non-study upper-body training and habitual physical activity were not formally quantified, participants were instructed to maintain their usual lifestyle habits throughout the intervention, and the randomised design likely minimised systematic between-group differences. Similarly, while dietary EPA and DHA intake from habitual food consumption was not specifically quantified, total PUFA intake did not differ between groups, and the high supplementation dose together with the substantial increase in muscle n-3 PUFA content make it unlikely that differences in background dietary intake influence the results. Finally, since this study was conducted in healthy, young adult males with adequate protein intake, our findings may not be generalisable to other populations, such as older adults, women or clinical groups with anabolic resistance or compromised nutritional status, in whom n-3 PUFA supplementation may exert different physiological effects.
Conclusion
In conclusion, our findings indicate that n-3 PUFA supplementation does not enhance muscle hypertrophy, strength gains or anabolic signalling healthy young adult men screened for adequate habitual protein intake undergoing resistance training. Future studies should explore the impact of such supplementation in populations with impaired anabolic responses or during periods of disuse or caloric restriction.
Supplementary material
For supplementary material/s referred to in this article, please visit https://doi.org/10.1017/S0007114526107910
Acknowledgements
The authors thank study participants for their time and commitment, as well as the School of Physical Education and Sports of the University of São Paulo, for hosting this study.
This work was supported by the São Paulo State Research Support Foundation, Grant Numbers 2022/02229-4 (H. S. A.), 2022/05145-6 (W. R. P.), 2024/16418-9 (A. L. V.), 2023/02076-6 (I. A. D.) and the Brazilian Federal Agency for Support and Evaluation of Graduate Education (CAPES, financial code 001). The authors also acknowledge the University of Campinas’ Fund for Support of Teaching, Research, and Extension (FAEPEX). M. O. B. and D. R. S. N. received grants from Programa Institucional de Bolsas de Iniciação Científica (Pibic – CNPq). G. B. C. and G. B. M. received grants from CAPES (88887.852229/2023-00 and 88887.495476/2020-00). H. R. and F. B. B. were supported by grants from Conselho Nacional de Pesquisa e Desenvolvimento (CNPq, 166622/202-6 and 306954/2022-2).
H. S. A.: Conceptualisation-Lead, Data curation-Lead, Formal analysis-Lead, Funding acquisition-Lead, Investigation-Lead, Methodology-Equal, Project administration-Lead, Writing – original draft-Lead; W. R. P.: Formal analysis-Supporting, Funding acquisition-Supporting, Investigation-Equal, Writing – review & editing-Equal; G. B. C.: Investigation-Equal, Project administration-Equal, Writing – review & editing-Equal; M. O. B.: Formal analysis-Equal, Investigation-Equal, Writing – review & editing-Equal; J. P. M.: Formal analysis-Equal, Investigation-Equal; D. R. d. S. N.: Formal analysis-Equal, Investigation-Equal, Project administration-Supporting; A. L. V.: Formal analysis-Equal, Investigation-Equal, Writing – review & editing-Equal; I. A. D.: Formal analysis-Equal, Investigation-Equal, Writing – review & editing-Equal; G. B. M.: Data curation-Equal, Investigation-Equal, Writing – review & editing-Equal; L. A. R. C.: Investigation-Equal, Writing – review & editing-Equal; A. J. P.: Formal analysis-Equal, Supervision-Equal, Validation-Equal, Writing – review & editing-Equal; G. G. A.: Supervision-Equal, Validation-Equal, Writing – review & editing-Equal; I. L. B.: Resources-Equal, Supervision-Equal, Visualisation-Equal, Writing – review & editing-Equal; H. R.: Conceptualisation-Equal, Funding acquisition-Equal, Methodology-Equal, Resources-Equal, Software-Equal, Supervision-Equal, Validation-Equal, Writing – review & editing-Equal; F. B. B.: Conceptualisation-Equal, Formal analysis-Equal, Funding acquisition-Equal, Resources-Equal, Supervision-Lead, Validation-Equal, Visualisation-Equal, Writing – review & editing-Lead. All authors read and approved the final manuscript and agree with the order of presentation of the authors.
The authors declare no conflicts of interest.
The experimental data and the results supporting the findings of this study are available in the Repositório de Dados de Pesquisa da Unicamp, V1, under the identifier https://doi.org/10.25824/redu/L54QG7.