I. INTRODUCTION
The development of microwave absorbing materials requires control over material properties such as the conductivity, complex permittivity, and permeability.Reference Lakshmi, John, Mathew, Joseph and George1 Conducting polymers have attracted much attention in recent years due to their potential applications in various hi-tech aspects such as electrochemical display, sensor, catalysis, redox capacitor, electromagnetic shielding, as well as in secondary batteries.Reference Singh, Kumar, Amita and Dhawan2, Reference Yang, Gung, Shih, Hung and Wu3 Among all the conducing polymers, polyaniline (PANI) has been studied extensively in recent years because of its easy synthesis and environmental stability. PANI as a microwave absorbing material has an electrical loss that will help to improve the microwave absorption property and widen the absorption bandwidth.Reference Ting, Jau and Yu4 To compensate these defects, the integration of magnetic materials and conducing polymers have attracted increased interests in microwave absorption properties.Reference Du, Du, Li, Wang, Wang, Wang, Xu and Han5 The composite materials have potential applications in microwave absorption because of new and often unusual electromagnetic properties.Reference Jianjun, Yuping, Jia, Hui, Shunhua and Weiping6–Reference Guerin, Varadan and Varadan10
To get an effective absorption, microwave components as electric and magnetic field when perpendicular to each other required to cancel out both the electric and magnetic fields when materials exposed to microwave, i.e., reduction of radar cross section.Reference Guerin, Varadan and Varadan10 The radar absorption materials (RAMs) are prepared with the compounds having high loss energy. The excellent RAMs show the microwave absorbing properties over a wide frequency range, and the materials should be lightweight and thin.Reference Mandal and Das11 However, titanates, especially PbTiO3, are photocatalytic materials with advantages of low density, high specific surface area, superior delivering ability, low price, and facility to mold.Reference Yu12 Meanwhile, titanate is an excellent wave transmitting material, which can widen the frequency bandwidth of microwave absorber. The use of embedding nanoparticles in polymer matrix is a convenient method of preparing composite. The microwave absorbing properties of the composite can be tuned by adding a metal oxide in the microwave absorber.Reference Li, Zhang and Li13 Recently, work has been carried out to investigate the effect of operating conditions on the mechanical properties of TiO2 composite coatings.Reference Kumar, Singh, Saini, Khatoon and Dhawan14 However, reports on dielectric studies and the microwave absorbing properties of these composites are scarce. Abbas et al. reported that dielectric absorbers based on BaTiO3 and PANI composites have been successfully prepared in polyurethane resin. The complex relative permittivity spectra and their relationship with microwave absorbing properties were investigated, and it was found that absorption properties of the composites are greatly improved with increasing percentages of PANI–BaTiO3 composites. The absorber RAM-III with BaTiO3 and PANI ratio (25:75) has shown a maximum reflection loss (RL) of −15 dB at 10 GHz with a bandwidth of 3 GHz in a sample thickness of less than 3.0 mm. This bandwidth is higher than about 1 GHz normally.Reference Ting, Jau and Yu4
In the present case, synthesis of PANI–PbTiO3 composites with different weight percentages (10, 20, 30, 40, and 50 wt%) have been carried out by in situ polymerization technique by using sodium dodecyl benzene sulfonoic acid (SDBSA) as a surfactant and ammonium persulfate as an oxidant. The prepared composites were characterized by Fourier transmission infrared (FTIR) spectroscopy. Structural morphology and structural analysis studies have been carried out by x-ray diffraction (XRD) and scanning electron microscopy (SEM). The electrical conductivity was carried out by the two-probe method and microwave absorption properties of PANI/PbTiO3 composites by using Vector Network Analyzer (VNA).
II. EXPERIMENTAL
A. Materials and synthesis
Aniline, ammonium persulfate, SDBSA, and HCl were used of analytical reagent (AR) grade. Lead titanate (PbTiO3) is commercially procured from Sigma-Aldrich (Bangalore, India) and preheated at 120 °C before use.
B. Synthesis of PANI
0.1 mol of aniline was dissolved in 1 M HCl to form aniline hydrochloride. The above solution is then refluxed with 1 mL of SDBSA, which acts as a surfactant, for 3 h at ice temperature. To this reaction mixture, 0.1 M of ammonium persulfate [(NH4)2S2O8], which acts as an oxidant, was added slowly with continuous stirring for 6 h at 0–5 °C. The precipitate powder recovered was vacuum filtered and washed with water and acetone to remove the ammonium persulfate and unreacted monomers from the solution. Finally, the resultant precipitate was dried in an oven for 24 h to achieve a constant weight.Reference He, Fang, Wang and Pang15
C. Synthesis of PANI/PbTiO3 composites
1 mol of aniline was dissolved in 1 M HCl to form aniline hydrochloride. Lead titanate (PbTiO3) was added to aniline hydrochloride solution with vigorous stirring to keep the lead titanate suspended in the solution. The above suspended solution is mixed with 1 mL of SDBSA and stirred for 3 h at ice temperature. To this reaction mixture, 0.1 M of ammonium persulfate [(NH4)2S2O8], which acts as an oxidant, was added slowly with continuous stirring for 4–6 h at 0–5 °C. The precipitate powder recovered was vacuum filtered and washed with water and acetone. Finally, the resultant precipitate was dried in an oven for 24 h to achieve a constant weight. Similarly, five different PANI–PbTiO3 composites with different weight percentages of PbTiO3(10, 20, 30, 40, and 50 wt%) in PANI have been synthesized.Reference Abbas, Dixit, Chatterjee and Goel16
The FTIR spectra of all the samples were recorded on Perkin Elmer (Model—783) spectrophotometer (Redwood City, CA) in KBr medium. The XRD pattern for these composites were recorded with Cu Kα radiation of wave length λ = 1.5420 Å in the 2θ range 8–90°. The powder morphology of PANI and its composites are sintered in the form of pellets and are investigated using Philips XL30 ESEM scanning electron microscope (London, UK).
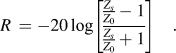
To measure the permeability and permittivity of these samples, rectangular wave guides are used. The samples are fitted into the cross section of the wave guide sample holder without any air gap. The scattering parameter was measured using an Agilent 8722 ES VNA (Agilent Technologies India, New Delhi, India). The complex permittivity and permeability are calculated from scattering parameters using the Nicholson–Rose method. RL is calculated using the following equation:
 $${{Z_s } \over {Z_0 }} = \sqrt {{{{\rm{\mu }}^* } \over {{\rm{\varepsilon }}^* }}} \tanh \left[ {j{{2{\rm{\pi }}} \over c}\sqrt {{\rm{\mu }}^* {\rm{\varepsilon }}^* } \,\,fd} \right]\quad,$$
 $$R\, = - 20\log \left[ {{{{{Z_s } \over {Z_0 }} - 1} \over {{{Z_s } \over {Z_0 }} + 1}}} \right]\quad.$$
Here, Z 0 is the impedance in air, Zs is the impedance in the material, μ* is the complex permeability, ε* is the complex permittivity, c is the velocity of light, f is the frequency, d is the thickness of the absorber, and R is the RL in decibel.
III. RESULTS AND DISCUSSION
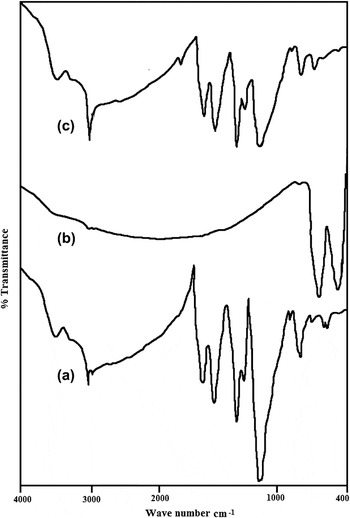
The FTIR spectra of pure PANI, pure PbTiO3, and PANI–PbTiO3 composites are shown in Figs. 1(a)–1(c). Figure 1(a) shows the FTIR spectra of pure PANI. The important characteristic peaks of PANI appeared at 1603 and 1561 cm−1 corresponding to C = C stretching of quinine ring, 1480 cm−1 due to C = C stretching of benzenoid ring, 1302 cm−1 due to C–N stretching, 1140 cm−1 due to C–O–C stretching of excess oxidant, 1020 cm−1 due to S–O vibration, 801 and 734 cm−1 due to C–H vibration of para coupling benzenoid and benzene rings, C–H bending at 684 cm−1, 592 cm−1 corresponds to aromatic ring, and 472 cm−1 is stretching at out of the plane. Figure 1(b) shows the FTIR spectra of pure PbTiO3. It is observed from this figure that a broad peak is appeared at 575 cm−1, which is due to the Ti–O vibration, and another at 717 cm−1, which is a characteristic feature of PbTiO3. Another absorption peak is also observed at 2005 cm−1, which can be attributed due to carbonate ion impurities.Reference Roy, Anilkumar and Ambika Prasad17
The FTIR spectra of (a) PANI, (b) PbTiO3, and (c) 50 wt% of PANI/PbTiO3 composites.

Figure 1(c) shows the FTIR spectra of PANI–PbTiO3 composites for 50 wt% of PbTiO3 in PANI where the important peaks are observed; peak at 587 cm−1 corresponds to Ti–O vibration, peak at 802 cm−1 is due to C–H vibration of para coupled benzene ring, peak at 1142 cm−1 is due to C–O stretching, peak at 1302 cm−1 is due to C–O–C stretching (C–N stretching), peak at 1478 cm−1 is due to CH2 bending, peak at 1560 cm−1 is due to C = C quinoid ring, and peak at 2923 cm−1 is due to C–H stretching, indicating the presence of PbTiO3 in PANI. On comparing the major intense peaks observed in FTIR spectra of pure PANI, pure PbTiO3, and PANI–PbTiO3 composites, it is noticed that intensity peaks observed in PANI–PbTiO3 composites do not show much resemblance to that of the either PANI or PbTiO3. Hence, it reveals that there is a homogeneous mixing of PbTiO3 in PANI, which results into a new composite whose characteristics are not much similar to that of either PANI or PbTiO3.
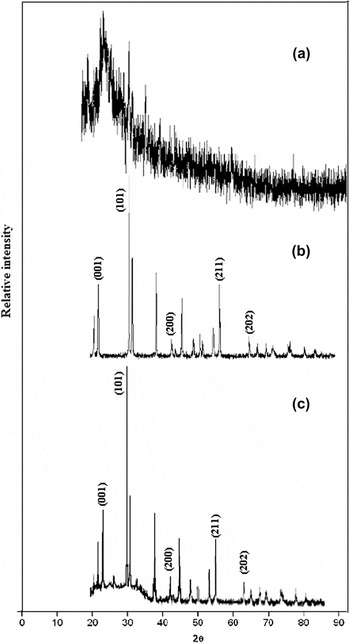
The XRD spectrum of pure PANI is shown in Fig. 2(a) where a broad reflection Bragg angle 2θ value of 25.53° corresponding to (200) diffraction planes of ES-I structure of pure PANI is observed.Reference Roy, Anilkumar and Ambika Prasad18Figure 2(b) shows the XRD spectrum of pure PbTiO3. It is observed from this figure that PbTiO3 shows an orthorhombic symmetry with reflection peaks at 2θ values of 21.43°, 31.45°, 46.55°, 57.25°, and 65.69°, which correspond to diffraction planes at (001), (101), (200), (211), and (202), respectively. Figure 2(c) shows the XRD spectrum of PANI–PbTiO3 50 wt% composites. Thus, XRD results suggest that PbTiO3 retains its crystalline morphology in the composite with polymer matrices prepared at room temperature, although they were completely coated by PANI matrix.
The XRD patterns of (a) PANI, (b) PbTiO3, and (c) 50 wt% of PANI/PbTiO3 composites.

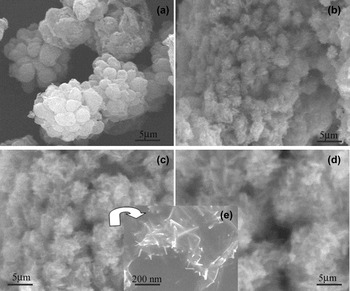
Figure 3(a) shows SEM image of pure PANI, which is found to be agglomerated and spherical in shape to form a bunch. Further careful observations reveal that each granule is truss with the PANI fibers. The one-dimensional (1D) growth of the polymer fibers were suppressed by a surfactant SDBSA, so growth takes place in a zero-dimensional path. The average grain size was calculated by linear intercept method and it was 1.3 μm. Figures 3(b)–3(d) show the SEM images of 10, 30, and 50 wt% of PANI–PbTiO3 composites. It is observed from the images that the nucleation growth starts in one dimension for all the weight percentages, which indicates that no effect of surfactant is there when we add the metal oxide at higher percentages. The length of the composite fibers increases with increase in weight percentage of lead titanate in the PANI. The average grain size of 10, 30, and 50 wt% of PANI–PbTiO3 composites were calculated by using linear intercept method and it was 0.63, 1.72, and 2.3 μm, respectively. Figure (e) shows the SEM image of 30 wt% is taken in higher resolution image in dimethyl sulfoxide and sonicated the solution for 10 min to get homogenous distribution of particles without any agglomeration of polymer fibers. The above prepared composites solution is drop casted over cover glass, dried at room temperature, and then subjected to SEM. It is observed that the composites are formed a short needle-like structure of about 200 nm in length.
The SEM images of (a) PANI; (b–d) 10, 30, and 50 wt% of PANI/PbTiO3 composites; and (e) high resolution of 30 wt% PANI composites.

IV. MICROWAVE PROPERTIES
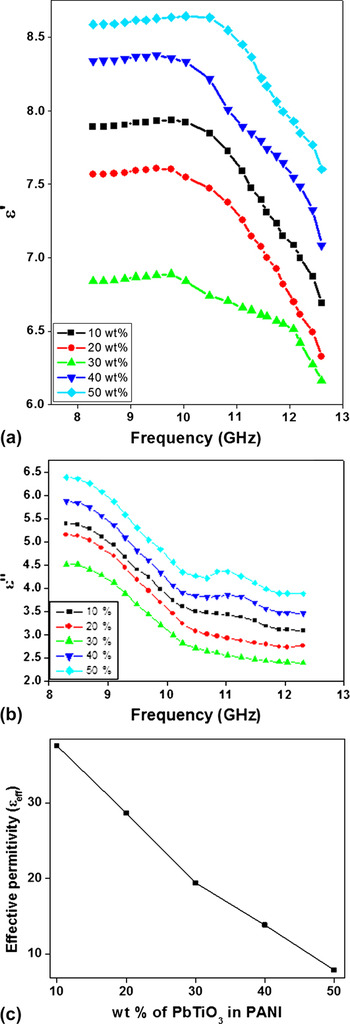
The real part of permittivity (εʹ) and imaginary part of permittivity (εʹʹ) versus X-band frequency are shown in Figs. 4(a) and 4(b). From all PANI/PbTiO3 composites graphs, permittivity value is decreased with an increase in frequency. In these composites, strong polarization occurs due to the presence of polaron/bipolaron and other bound charges, which leads to high values of εʹ and εʹʹ at lower frequencies. With the increase in frequency, the dipoles present in the system cannot reorient themselves along with the applied electric field; as a result, dielectric constant decreases.Reference Ting, Jau and Yu4 Also, oxide particles effective anisotropy, i.e., shape anisotropy rotation of domain, may become more difficult. Furthermore, the particle size of composites is in the range of nanometers in one dimension. The surface area, number of limp bond atoms, and unsaturated coordination on the surface are all improved. These variations lead to the interface polarization and multiple scattering, which are useful for the absorption of large number of microwaves. Among all composites, 30 wt% of PANI–PbTiO3 composites show lowest real and imaginary permittivity values, i.e., 6.57 and 8.3, respectively, and for other composites, real value varies from 6.51 to 7.57, whereas imaginary permittivity changes from 9.13 to 12.94 and also up to 10 GHz.
(a) and (b) show variation of ε′ and ε″ with X-band frequency for PANI/PbTiO3 composites at different weight percentages and (c) shows variation of εeff with different weight percentages.

Usually, the permittivity of multiphase materials decreases with applied frequency.Reference Yusoff, Abdullah, Ahmad, Jusoh and Mansor19 It is know that an incident wave is not sensitivity to particles or structures that are smaller than a sensing wave length, so in multiphase porous composites, materials can be treated as an effective medium. The effective permittivity of multiphase composites materials can be determined by the Maxwell–Garnett theory:
 $${\rm{\varepsilon }}_{e{\rm{ff}}}^{{\rm{MG}}} = {\rm{\varepsilon }}_1 {{({\rm{\varepsilon }}_2 + 2{\rm{\varepsilon }}_1 ) + 2f({\rm{\varepsilon }}_2 - {\rm{\varepsilon }}_1 )} \over {({\rm{\varepsilon }}_2 + 2{\rm{\varepsilon }}_1 ) - f({\rm{\varepsilon }}_2 - {\rm{\varepsilon }}_1 )}}\quad,$$
where ε1 and ε2 are the permittivities of the oxide and polymer, respectively, and f corresponds to the volume fraction of the guest in the effective medium. Figure 4(c) shows the effective permittivity of different weight percentages of PbTiO3 doped in PANI composites. It is observed that εeff value decreases with increase in lead titanium oxide in PANI. Among all weight percentages, 50 wt% of PANI–PbTiO3 composite shows lowest permittivity value of 7.19. The real part of permittivity values are low as compared to effective permittivity, which may be due to intermolecular distance of needle-shaped composites, which helps the electrons to flow easily, as well as due to PbTiO3 material, which exhibits high resistivity. The characteristic feature of PbTiO3 is that Pb2+ and O2− ions form a FCC lattice with Ti4+ ions fitting octahedral interstices. At room temperature, there are possible minimum energy positions for Ti4+ ions, which are off-cantered and therefore give rise to permanent electric dipoles.Reference Roy, Anilkumar and Ambika Prasad17 Similarly, the conducting PANI in its emeraldine base form when protonated by HCl acid solution possesses permanent electric dipoles. Therefore, in both the cases, orientation (dipolar) polarization is the dominant polarization and the associated relaxation phenomenon constitutes a loss mechanism. This constitutes a heterogeneous system and interfacial polarization, which is another important polarization process, and hence, associated relaxation will give rise to a low permittivity.Reference Wing, Wang and Halloran20
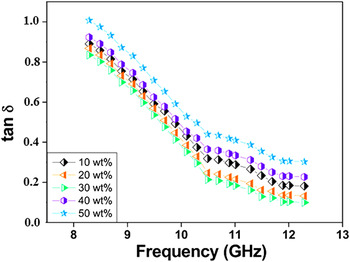
The behavior of loss factor (tanδ) for PANI–PbTiO3 composites at different weight percentages (10, 20, 30, 40, and 50 wt%) in the frequency range of 8.0–13.0 GHz is shown in Fig. 5. The loss factor value of PANI–PbTiO3 composites decreases with increase in frequency. The energy loss in the dielectric is due to viscous force on the movements of dipoles. The lead titanate particles interact with the 1D PANI fibers, and the motion of moving dipoles is restricted as doping levels are increased in PANI. Thus, dielectric loss is expected to decrease due to the interaction of PbTiO3 with the PANI fibers as observed in the present experiment. In all weight percentages, 30 wt% of PANI/PbTiO3 composites shows 0.93 of low tangent loss value and decrease up to 0.37 with increase in frequencies.
The variation of tanδ with X-band frequency for PANI/PbTiO3 composites at different weight percentages.

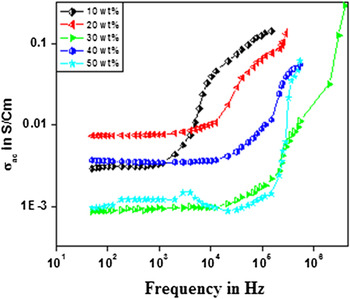
The variation of σac conductivity of PANI–PbTiO3 composites at different weight percentages as a function of X-band frequency is shown in Fig. 6. Among all weight percentages, 30 wt% PANI–PbTiO3 composites show high conductivity due to the space charge polarization, i.e., positive charges are displaced along the field and negative charges shift in the opposite direction that creates an internal electric field, which partly compensates the external field inside the composites. However, 10, 20, 40, and 50 wt% of PANI–PbTiO3 composites show conductivity due to dipole polarization where the rotations of dipoles between two equivalent equilibrium positions are involved.Reference Roy, Anilkumar and Ambika Prasad21 It is thus a spontaneous alignment of dipoles in one of the equilibrium positions that give rise to the nonlinear polarization behavior of these composites. Therefore, the conductivity of these composites is less than that of 30 wt% of composite.
The variation of σac as a function of X-band frequency of PANI/PbTiO3 composites at different weight percentages.

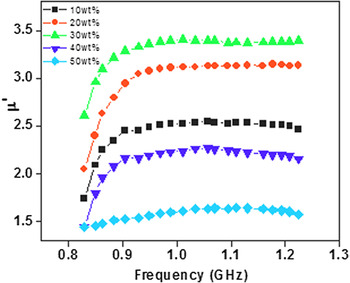
The frequency dependence of complex permeability with different PbTiO3 contents in PANI is plotted in Fig. 7. The real part of permeability (μʹ) of PANI/PbTiO3 composites is almost constant at 9 GHz in the measuring frequency range. The initial permeability value increases with increasing the content up to 30 wt% of PbTiO3 in PANI matrix. The critical concentration of 30 wt% of the PANI-PbTiO3 composites enhance the microwave absorption. The permeability (μ′) comes from the cooperative effect of domain wall resonance and spin rotational resonance of PbTiO3. As a result, at lower frequency, μ′ increases and exhibits only a maximum value of 0.87 at the resonance frequency of 9–11 GHz with the 30 wt% PbTiO3 in PANI matrix.
The variation of complex permeability of PANI–PbTiO3 composites.

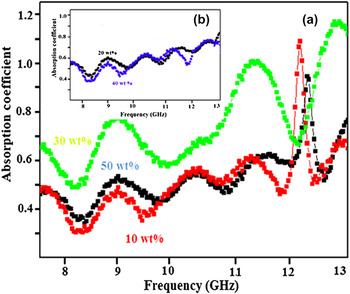
Variation of absorption coefficient of the PANI/PbTiO3 composites for different weight percentages at X-band frequency are shown in Figs. 8(a) and 8(b). The absorption coefficient increases with increase in PbTiO3 weight percentages in PANI. The behavior of electromagnetic absorption critically depends on dielectric properties of the materials that are represented by relative permittivity and permeability.Reference Roy, Anilkumar and Ambika Prasad17 PANI–PbTiO3 composites are nonmagnetic particles-doped organic compounds without any addition of magnetic fillers like ferrite or carbonyl iron. Thus, microwave absorption of these composites is utterly attributed to the dielectric constant of the composites. The PANI–PbTiO3 composites of 30 wt% show highest value of 1.89 compared to other composites.Reference Yan, Wang, Han, Ren, Liu and Li22, Reference Ohlan, Singh, Chandra and Dhawan23 The composites of other PbTiO3 in PANI are low may be due to the Maxwell–Wagner–Sillars (MWS) effect.Reference Tabellout24
The dependence of the frequency of the absorption coefficient of the PANI/PbTiO3 composites.

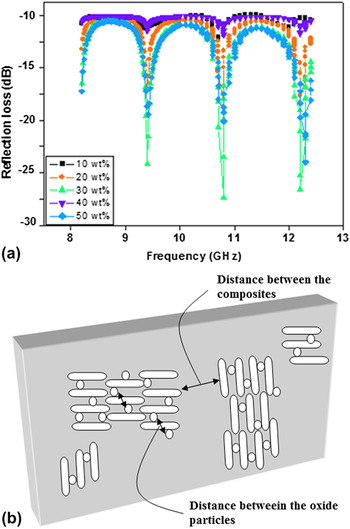
Figure 9(a) shows frequency dependence of the RL of the PANI/PbTiO3 composites with increase in different weight percentages of lead titanate in PANI matrix in the frequency range of 8–13 GHz. Among all composites, the 30 wt% of PANI-PbTiO3 composites shows high microwave absorption below 10dB and the broad absorption peaks of the frequency from 8 to 13 GHz followed by other composites. However, the maximum RL peak for a 30 wt% of PANI/PbTiO3 composites is 28.6 dB at 10.8 GHz is observed and this is may be due to minimal reflection loss of the microwave energy at 30 wt% of concentration in PANI matrix. The dopant percentage in the polymer matrix is an important parameter affecting the intensity and position of the frequency at the point of maximum RL.Reference Yang, Gung, Shih, Hung and Wu25 Moreover, PANI/PbTiO3 composites of 30 wt% are formed in a small discontinuous spikes structured revels from the SEM images. are SEM images. The PbTiO3 is a nonmagnetic materials but it increases nonmagnetic material but increases the real part of permittivity and permeability of the composites, as a results the gap between two particles in conducting matrix increases as shown in Fig. 9(b) and could reduce the eddy current loss through increasing electric resistivity as an important reason bringing about the excellent microwave absorption.Reference Guo, Duan, Liu, Chen and Liu26
(a) shows the dependence of the frequency of the RL of the PANI/PbTiO3 composites. (b) shows the model of PbTiO3 particles distribution in PANI matrix.

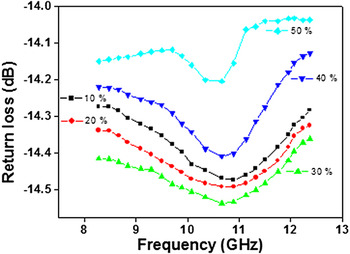
Figure 10 shows the variation in return loss of PANI/PbTiO3 composites as a function of X-band frequency. The return loss of all composites initially decrease with increase in frequency after 10 GHz, and the return loss increases as a function of frequency at X-band. Initial decrease may be due to all types of polarization in the samples, and when frequency reaches to nearby 11 GHz, polarization stops and again it starts with sweeping the higher frequencies. Among all composites, 30 wt% of PANI/PbTiO3 composites shows low return loss of −8.76 dB and increases up to −9.31 dB with increasing frequency.
The dependence of the frequency of the return loss of the PANI/PbTiO3 composites.

V. CONCLUSION
PbTiO3-doped PANI composites have been synthesized by in situ oxidative polymerization technique using SDBSA as a surfactant and ammonium persulfate as an oxidant. The prepared composites for structural analysis were characterized by FTIR, XRD, and SEM. FTIR spectra show important peaks, which are observed at 587 cm−1 that corresponds to Ti–O vibration, 802 cm−1 due to C–H vibration of para coupled benzene ring, 1142 cm−1 for C–O stretching, 1302 cm−1 is due to C–O–C stretching (C–N stretching), 1478 cm−1 for CH2 bending, 1560 cm−1 for C = C quinoid ring, and 2923 cm−1 for C–H stretching, indicating the presence of PbTiO3 in PANI. XRD studies reveal that PbTiO3 retains its crystalline morphology in the composite with polymer matrices prepared at room temperature, although they were completely coated by PANI matrix. The SEM images of 10, 30, and 50 wt% of PANI/PbTiO3 composites show that the nucleation growth starts in one dimension for all the composites and indicate that no effect of surfactant is there when we add the metal oxide at higher percentages. The complex permittivity (εʹ) and imaginary part of complex permittivity (εʹʹ) studies at X-band frequency reveal that the permittivity decreases with increase in frequency and may be the dipoles present in the system, which cannot reorient themselves along with the applied electric field as a result of dielectric constant decrease. Among all composites, 30 wt% of PANI–PbTiO3 composites shows 0.93 of low tangent loss value and decreases up to 0.37 with increase in frequencies. The permeability (μ′) increases with increase in X-band frequencies and exhibits a maximum value of 0.87 at resonance frequency of 9–11 GHz with 30 wt% of PbTiO3 in PANI matrix. The absorption coefficient of PANI–PbTiO3 composites of 30 wt% shows highest value of 1.89 compared to other composites. The composites of other PbTiO3 in PANI are low and may be due to the MWS effect. RL peak of 30 wt% PANI–PbTiO3 composites is 28.6 dB at 10.8 GHz, which may be attributed to the maximum reflection of the microwave power for the particular doping concentration.