

Introduction
Systematic reviews attempt to summarise available research on a topic in a way that is methodical and informative to researchers, practitioners and other decision makers. Cochrane systematic reviews (CSRs) set out to provide the highest quality systematic review which, in turn, produces the most reliable findings. This article discusses systematic reviews and the data analytic techniques that are employed, foremost amongst these is meta-analysis, as demonstrated by reference to a recently conducted CSR relating to a brain impairment population.
Historical Context of the Cochrane Systematic Review
The Cochrane Collaboration began with the opening of the first Cochrane Centre in Oxford, UK and subsequently the first Cochrane Colloquium in the early 1990s. The leading force behind the Cochrane Collaboration was Sir Iain Chalmers, an obstetrician and gynaecologist who has dedicated much of his career to the promotion of evidence-based medicine. Chalmers came to realise that some of the interventions that he had been trained to deliver did more harm than good and resulted in prolonged suffering and unnecessary deaths (Hawkes, Reference Hawkes2014). Chalmers questioned the evidence for common interventions. He was influenced by Archie Cochrane's work in the 1970s which called for the promotion of the randomised controlled trial (RCT) and the registering and reporting of all RCTs of an intervention or clinical problem in order to best inform medical practice (The Cochrane Collaboration, 2013).
The hallmarks of the Cochrane Collaboration are:
-
1. Reviews are usually based on RCTs in order to reduce the possibility of biases influencing research outcomes.
-
2. All the available RCTs and quasi-RCTs on a particular subject are catalogued into one central database known as CENTRAL.
-
3. There is recognition that not all studies are published but will still have important findings which impact on the conclusions that can be drawn about a particular treatment. Therefore, it is important to search exhaustively for any research relevant to the topic. This includes a Grey Literature search. Grey Literature relates to research activity which is not necessarily available in standard publications. It might be found in registries of trials, the proceedings of funding bodies and other sources that are not formally published. Greynet International (www.greynet.org) provides an avenue to search for Grey Literature or alternatively authors of systematic reviews need to identify likely sources of Grey Literature (e.g., funding announcements).
-
4. Information is critically evaluated and is in a format accessible to clinicians, researchers and also consumers of interventions.
-
5. The Cochrane Collaboration promotes the inclusion of research findings, and encourages collaborations of researchers, from all over the world. The search is not limited to any particular language.
-
6. CSRs are published electronically in order to provide the most current and accessible reviews.
-
7. The Cochrane Collaboration relies mainly on unpaid work to compile the reviews.
-
8. CSRs use of a variety of statistical techniques in order to analyse data yielded by the reviews. Where multiple sources of data exist, this introduces the possibility of using meta-analysis to better understand the available studies and the effects of interventions.
Development of Meta-analytic Techniques
In parallel to the invention of the systematic review, the 1970s saw the pioneering of meta-analysis as a data analytic technique for managing the data identified in a systematic review. The term ‘meta-analysis’ was first attributed to Gene Glass in 1976 (Shadish, Reference Shadish2015). Glass, working simultaneously with other researchers in psychology (Frank Schmidt and Robert Rosenthal), was interested in data analytic methods that would enable the synthesis of data from multiple studies across interventions or clinical problems. These researchers recognised that there was a need for the integration of research findings across studies which would take into account biases related to the methodological quality of the primary studies (Shadish & Lecy, Reference Shadish and Lecy2015).
Glass defined meta-analysis as the analysis of summary statistics from studies rather than the analysis of raw data. In a discussion of the origins of meta-analysis, Glass (Reference Glass2015, p. 223) reflected on how he had used meta-analysis ‘to do battle’ against Hans Eysenck, whose 1965 review of the psychotherapy outcome literature had criticised the effectiveness of psychotherapy. When Glass inspected Eysenck's methodology he found several sources of biases and this inspired him to develop an objective data analytic method that would prove Eysenck's findings wrong.
From the 1970s, there was at first a trickle and then a flood of meta-analytic studies. It follows that with the advent of meta-analytic studies in the social sciences and the push towards evidence-based medicine from key figures such as Archie Cochrane, the conditions were set for the development of the systematic review as an influential research methodology and for the proliferation of the CSR. As of the 20th anniversary of the Cochrane Collaboration in 2013 there were more than 5,000 published CSRs and nearly 28,000 researchers across 120 countries had participated in the authoring of a CSR (The Cochrane Collaboration, 2013).
Systematic Reviews in the Field of Brain Impairment
The brain impairment literature was greatly influenced by the publication of the first systematic review of cognitive rehabilitation by Keith Cicerone and colleagues in 2000 (Cicerone et al., Reference Cicerone, Dahlberg, Kalmar, Langenbahn, Malec, Bergquist and Morse2000). While it was limited in its sources, using only one database (Medline), it did yield 171 studies which ranged in levels of evidence from ‘class 1’ trials of RCTs through to ‘class 3’ case reports or case series. Cicerone formed a panel of experts who reviewed the literature systematically resulting in recommendations for clinical practice across three grades of evidence. This group subsequently published updates in order to provide more current information (Cicerone et al., Reference Cicerone, Dahlberg, Malec, Langenbahn, Felicetti, Kneipp and Catanese2005; Reference Cicerone, Langenbahn, Braden, Malec, Kalmar, Fraas and Ashman2011). A subsequent meta-analysis of this data by Rohling, Faust, Beverly and Demakis (Reference Rohling, Faust, Beverly and Demakis2009) showed a small effect in favour of some interventions for TBI and stroke patients.
The development of the systematic review occurred in parallel with the shift towards evaluating evidence from RCTs and a growing skepticism in accepting results as published. This is seen today in the adoption of standards such as CONSORT (Consolidated Standards of Reporting Trial). Beginning in the 1990s (The Standards of Reporting Trials Group, 1994) and with updates since then, CONSORT set out to specify standards for the reporting of RCTs. When designing studies researchers can use the CONSORT guidelines to ensure that their study is of the highest possible methodological quality. Critically, there is a recognition within the CONSORT statement, that an RCT is a scientific experiment which needs to specify its design and methods a priori (Moher et al., Reference Moher, Hopewell, Schulz, Montori, Gøtzsche, Devereaux and Altman2010). There are also extensions to CONSORT for a range of designs (e.g., cluster or N-of-1 trials) and interventions (e.g., non-pharmacological).
The need to integrate an array of research findings has led to the invention of topic- or discipline-specific databases. This includes simple collections of studies that can be a way in which proponents of particular therapeutic approaches establish a research tradition, such as the list of RCTs of Acceptance and Commitment Therapy (ACT) maintained on the website of the Association for Contextual Behavioural Science (Hayes, Reference Hayes2017). Two examples of specialist field-driven databases of studies are PEDro, the physiotherapy evidence database and PsycBITE, the psychological database for brain impairment treatment efficiency. These databases aim to provide researchers and clinicians with ready access to relevant research findings which are curated to include a reliable judgment on the quality of the evidence. These databases are distinguished from other collections by involving a collaboration of clinicians and researchers who undertake a quality rating of the available evidence which is then available in a searchable database with open access. There are also databases for interventions in speech pathology (speechBITE), occupational therapy (OTseeker) and across broader health care disciplines (e.g., The Joanna Briggs Institute, EBM Online – evidence-based medicine). These databases are important avenues for knowledge translation from researchers to practising clinicians and may influence policy decision making, such as the Centre for Reviews and Dissemination (CRD) database which disseminates research to policy-makers in the UK National Health Service. The advantage of the online, collaborative style databases such as PsycBITE is that they are regularly updated and provide a more current knowledge base (Tate et al., Reference Tate, Moseley, Perdices, McDonald, Togher, Schultz and Winders2006) although it can be difficult securing the continuing funding required to maintain these databases.
A search of PsycBITE shows 789 systematic reviews that have been published in the field of brain impairment (search conducted 1 September 2017). The depth and quality of these reviews does vary with some of them preliminary ‘scoping reviews’ to CSRs. A search of the Cochrane Database of Systematic Reviews (search conducted 1 September 2017) with the search term ‘Brain Impairment’ returns 1,125 CSRs, applicable to a wide range of neurological conditions treated with pharmacological and non-pharmacological. CSRs tend to be affected by a relatively low number of available studies partially because they tend to be limited to RCTs, which are difficult to conduct in this population. Reasons why include difficulty recruiting and maintaining sufficient samples and the problem that any treatment provided is just one factor influencing the behaviour, mood, cognition or participation of people with brain impairment in amongst a variety of lifestyle factors. As an example McDonald et al. (Reference McDonald, Tate, Togher, Bornhofen, Long, Gertler and Bowen2008) undertook a social skills training program with TBI participants. There was substantial dropout during the baseline assessment phase, treatment and lengthy follow up phases. It was difficult to establish a meaningful control condition and at the conclusion of treatment it was unclear whether change on the key outcome variables was due to participation in the group or other factors (e.g., change in social circumstances).
The Process of Conducting a Cochrane Systematic Review
Systematic reviews set out to summarise the evidence relevant to a specific clinical question using a transparent, a priori protocol-driven approach. Compared to a literature review, a systematic review has: clearly defined objectives; predefined eligibility criteria; explicit, reproducible methodology; systematic search of sources; assessment of the validity of included studies and systematic synthesis and presentation of findings (Lockwood, Sfetcu, & Oh, Reference Lockwood, Sfetcu and Oh2011). By comparison with other systematic reviews, CSRs tend towards higher levels of evidence by recommending the inclusion of only RCTs. As such they sacrifice inclusiveness of a variety of studies and methodologies in order to produce more reliable findings. Ultimately, a CSR may have fewer studies to draw upon however the true size and direction of the treatment effect will be clearer because there is an integration not just of findings but also the methodological strength of the primary studies contributing to these findings. As an example, there are several non-CSRs of treatments for emotional problems following acquired brain injury that attempt to integrate various research methodologies or clinical problems by applying less stringent inclusion criteria. The compromise for less stringent inclusion criteria is greater heterogeneity of studies and therefore less definitive conclusions about the effectiveness of a particular intervention for a specific clinical problem (e.g., Alderfer, Arciniegas, & Silver, Reference Alderfer, Arciniegas and Silver2005; Fann, Hart, & Schomer, Reference Fann, Hart and Schomer2009; Waldron, Casserly, & O'Sullivan, Reference Waldron, Casserly and O'Sullivan2013). The authors of these systematic reviews may argue that including a broader pool of studies increases the clinical relevance of the review.
The Cochrane Collaboration sets strict criteria for the process of undertaking a CSR. Primarily, this is a collaborative process which starts with registering a topic area and title with one of the interest groups of the Collaboration. This process highlights the involvement of the Cochrane Collaboration in the development of each CSR. This is important to ensure that there is no overlap between review topics and that the Collaboration has confidence that the research team will be able to complete the review. Once the title is accepted the stage of protocol development begins. The protocol sets out all of the methodology by which the review will be conducted.
A rigorously conducted systematic review will establish a set of inclusion/exclusion criteria to determine those studies most relevant to the research aims and will not vary from those criteria. These criteria will lead to a search output along a continuum with either a broad array of varied primary studies or, in a more selective review, a group of primary studies that are strictly focused on the study aims and are of greater methodological quality.
The Cochrane Collaboration's strict criteria include the a priori establishment of a protocol for the undertaking of the CSR. This comprises the stated rationale for doing the review, sets out the search method by which the review will be conducted and how the data will be extracted and analysed. Herein we discuss Gertler, Tate and Cameron's (Reference Gertler, Tate and Cameron2015) CSR of non-pharmacological interventions for depression following traumatic brain injury (TBI) in children and adults, henceforth referred to as GTC. This review received substantial support from the Cochrane Injuries Group and assistance from the Australasian Cochrane Centre including workshops for the author on writing a protocol and completing the review.
The study search for GTC included an exhaustive search string of relevant electronic databases which yielded over 2,000 records which were then considered for inclusion by two authors. In keeping with Archie Cochrane's assertion that not all relevant studies are available from standard publications, more than 14,000 records were screened from other sources (journals and conferences that typically related to the review topic). Of these records, almost all were excluded leaving just three studies that met inclusion criteria. A grey literature search identified three upcoming studies and the publication of the CSR was delayed until data from these studies was available. This left a total of six studies meeting inclusion criteria. These studies were then subjected to analysis using the Cochrane ‘Risk of bias’ tool (Higgins & Green, Reference Higgins and Green2011).
Risk of bias assessment refers to an analysis of the threat posed to the conclusions of the study by systematic sources of bias. The Cochrane ‘Risk of Bias’ (referred to as RoB) assessment includes seven evidence-based domains which are: the randomness of participant allocation to groups; the concealment of allocation to groups; blinding of participants and personnel; blinding of outcome assessment; incomplete outcome data; selective report of outcomes and other identified sources of systematic biases. Review authors provide a judgment of the presence of low, high or unclear RoB for each domain.
Data Analytic Techniques used in a Cochrane Systematic Review
CSRs can include a variety of data analytic techniques. These can be categorised into analyses which tell us about the nature of individual primary studies, and techniques that combine data from primary studies in order to make a more reliable conclusion about a treatment question. Specifically, whether a treatment is effective and whether it can be recommended. Conclusions about the reported effectiveness of a treatment must be tempered with an initial analysis of the reliability of the primary study, from which the conclusions are drawn.
Each primary study identified for a CSR is subjected to standardisation of the measure of treatment effect thus producing an ‘effect size’ or a standardised mean of the effect of the intervention. This is done in order to allow easier comparison between studies and as a pre-cursor to meta-analysis. In GTC this was the standardised mean difference (SMD) and 95% confidence interval for continuous data, such as the results of a questionnaire. SMD is the difference in mean outcome between groups (i.e., the difference between intervention and control), divided by the standard deviation of that outcome measure across all the participants in the study, both intervention and control participants (Higgins & Green, Reference Higgins and Green2011) as per the formula below:
 $$\begin{equation*}
{{\rm{SMD}}} =\frac{{{\rm{Difference}}\;{\rm{in}}\;{\rm{mean}}\;{\rm{outcome}}\;{\rm{between}}\;{\rm{the}}\;{\rm{groups}}}}{{{\rm{Standard}}\;{\rm{deviation}}\;{\rm{of}}\;{\rm{outcome}}\;{\rm{amongst}}\;{\rm{participants}}}}
\end{equation*}$$
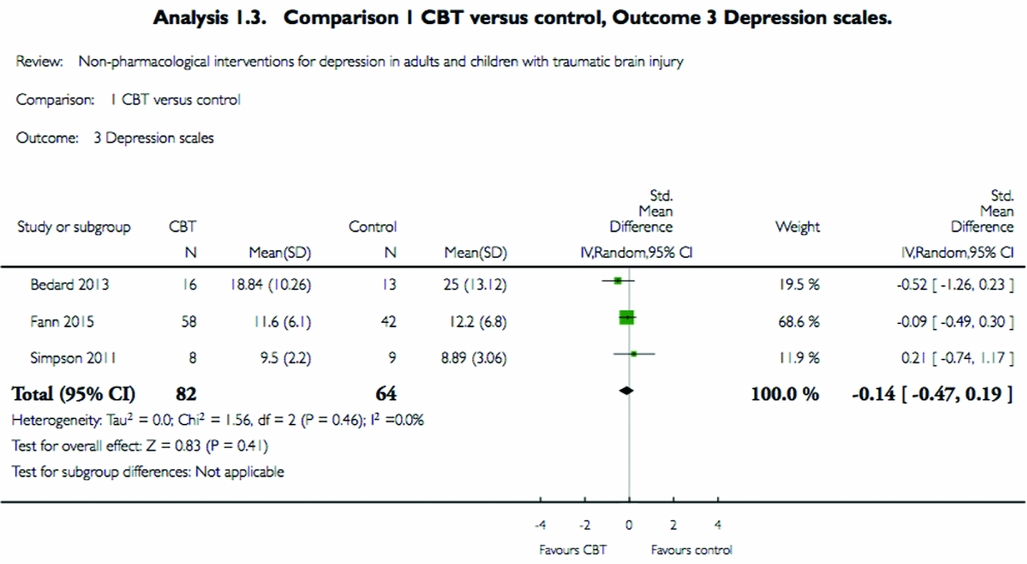
The SMD method assumes that the variation in standard deviation of outcomes reflects variation in the outcome measure. Therefore, SMD reduces the influence of different outcome measures being used across studies. This method is also known as Hedges’ (adjusted) g. Figure 1 shows the reported mean and standard deviation of each study and what the SMD is once transformed including a 95% confidence interval. As can be seen the SMD varied between a moderate effect in favour of intervention for ‘Bedard, 2013’ to a slight effect against for ‘Simpson, 2011’.
Example of meta-analysis of three studies for one comparison in Gertler, Tate, and Cameron (Reference Gertler, Tate and Cameron2015).

Likewise, there is an effect size measure for dichotomous outcomes which in GTC was the risk ratio (RR) method. The dichotomous outcome was diagnostic status. The authors were interested in whether participants had a diagnosis of depression prior to enrolment in the study and what was the rate of recovery from diagnosis in the intervention group compared to the control group, or the relative rate of recovery between two active treatments. ‘Risk’ refers to the likelihood of a particular outcome such as the likelihood that participants receiving an intervention will no longer fulfil the diagnostic criteria for depression. The RR is effectively the rate of recovery in the experimental (intervention) group divided by the rate of recovery in the control group (Higgins &Green, Reference Higgins and Green2011).
Applying Meta-analysis to a Systematic Review
The availability of studies for comparison will vary depending on the type of intervention and the target clinical problem. Brain impairment studies are relatively obscure and our research group has found relatively few studies when undertaking other CSRs (Lane-Brown & Tate, Reference Lane-Brown and Tate2009; Soo &Tate, Reference Soo and Tate2007). It can be difficult to undertake RCTs because of the intensive resources required and individual studies are often under-powered because of low numbers of participants and high dropout rates. Meta-analysis provides an opportunity to combine similar studies to boost numbers and statistical power. It might also be that different studies draw different conclusions about a treatment effect and so combining the results in a meta-analysis might shed some light on these disagreements (Higgins & Green, Reference Higgins and Green2011).
The first consideration when conducting a meta-analysis is to determine the homogeneity of the collection of studies or, conversely, to consider if heterogeneity of selected studies will preclude meta-analysis. Higgins and Green (Reference Higgins and Green2011) describe variation between studies to do with participants, interventions and outcomes as ‘clinical diversity.’ In GTC, six studies were selected for inclusion in the review. Four studies included an evaluation of a psychological therapy and the other two were evaluations of separate and distinct physical interventions. Because of the disparity in the modes of treatment (psychological vs. physical) not all studies could be included in the same meta-analysis. Four studies used psychological interventions and three of these were a comparison between a psychological treatment and a control condition, whereas the remaining study was a comparison between two psychological treatments. It was decided that a study which compared two potentially active treatments was both clinically and methodologically distinct. Therefore, only those three studies that compared a psychological treatment with a control condition could be meaningfully combined in a meta-analysis.
A further consideration was the appropriateness of the main outcome measure. In the topic area covered in GTC, there are two main categories of treatment outcome, either the participants’ score on a symptom measure of depression, or the participants’ diagnostic status (diagnosed or not diagnosed with a depressive condition). Of the three studies in consideration for meta-analysis all three used a score on a symptom questionnaire as a main outcome measure and had a similar design. Despite all three using different depression questionnaires as outcome measures it is possible to compare outcomes if we know some statistical information about the outcomes measures, i.e., the mean and standard deviation of the main outcomes. With growing awareness of standards such as CONSORT this information is usually reported however there are occasions where this information does not appear in a publication and it is necessary to search for this information or contact the study authors (e.g., Hoffman et al., Reference Hoffman, Bell, Powell, Behr, Dunn, Dikmen and Bombardier2010).
There is also statistical heterogeneity which may apply. Statistical heterogeneity may occur when there is very little or no overlap in the confidence interval of effect between the measures. Cochrane reviews include the Chi-squared statistic as a measure of heterogeneity. Chi-squared asks whether the observed differences between study outcomes are compatible with chance alone. The threshold for significance is set at p < .10 (Higgins & Green, Reference Higgins and Green2011). The Chi-squared result is then further assessed using the I2 test of inconsistency which takes into account the degrees of freedom of the meta-analysis (how many studies are included). An I2 of below 30% indicates an unimportant level of inconsistency. Higher levels might indicate a level of inconsistency which would preclude meta-analysis (Higgins & Green, Reference Higgins and Green2011). As can be seen in Figure 1 there was overlap in the forest plot of SMD and 95% confidence intervals in GTC.
Once we have established that we have a suite of comparable studies we can combine these in a meta-analysis. The Cochrane Collaboration makes this straightforward by including data analytic software in its proprietary Review Manager (RevMan) software package which is used to write the review.
Figure 1 above shows an example of a forest plot for a meta-analysis in GTC. This is a comparison of treatment vs. control or alternative treatment, just for one specific outcome measure, in this case it is for depression symptom scales. Figure 1 shows the SMD with 95% confidence interval for each study, which demonstrates the studies falling either side of an effect. It also shows the combined SMD with 95% confidence interval for the meta-analysis across the three studies, which shows a very slight effect in favour of CBT interventions (SMD = −0.14) but a 95% confidence interval that shows that CBT could be moderately effective ranging to the control condition being mildly more effective.
Figure 1 indicates that the meta-analysis was conducted using the ‘inverse-variance’ (IV) method. Using the IV method studies that have greater variance are given lower weighting in the meta-analysis. The IV method thereby seeks to reduce the effect of studies with greater variance on the overall meta-analysis. The equation for this calculation is found in the Cochrane Handbook (Higgins & Green, Reference Higgins and Green2011).
Data Assumptions and what to Look for in Meta-analysis
A notable feature of the GTC meta-analysis is that it uses a ‘random effects’ model as opposed to a ‘fixed effects’ model. In fixed-effects meta-analysis there is an assumption made that each study in the meta-analysis reflects the true effect of the intervention and that any variation between studies is solely due to chance. The fixed effects model asks, ‘what is the best estimate of the treatment effect?’ In a random effects analysis this assumption is not made but rather there is an assumption that each study follows a distribution of effect due to some source of heterogeneity across studies (Higgins & Green, Reference Higgins and Green2011). This is usually a fair assumption to make when combining studies which use similar but not identical samples, modes and dosages of interventions and outcome measures. The random effects model asks, ‘what is the average intervention effect?’ The random effects model comes with some potential pitfalls which are discussed below.
The calculation for SMD is the cornerstone of the meta-analysis. In a CSR, the SMD is first calculated for each study and this takes into account the variability of the outcome measure from that study's sample. If the study has a small number of participants, or a sample which is unusual in any way, then this would likely skew the findings. Cochrane attempts to minimise the impact of studies with high variability by assigning them less weight by recommending the IV method (the greater the variance the lower the weighting in the analysis). One of the key assumptions of meta-analysis is that study results which are pooled take into account the variance of each study when combined in the analysis and when this ‘variability in variability’ is not accounted for then this will lead to a less reliable conclusion. For example, Waldron, Casserly, and O'Sullivan (Reference Waldron, Casserly and O'Sullivan2013) merely averaged across the effect size estimate for each study to arrive at an average effect size from which positive conclusions were drawn about the effect of the intervention. The average effect size assumes that each study should be accorded equal weighting, despite the fact that some studies have a much greater variability in outcome than others. This is problematic because, as demonstrated by the wide 95% confidence interval in GTC, there can be highly variable outcomes ranging from moderate support for intervention to mild support for no intervention.
Even with the use of a ‘random-effects’ model, if the weighted average of the meta-analysis is given without context it might belie the heterogeneity of the studies included in the meta-analysis. The confidence interval is only an estimate around the mean and even with a small confidence interval this might not reflect the existence of outlier studies (Higgins & Green, Reference Higgins and Green2011). To account for this RevMan includes a measure of ‘tau-squared’ which is an estimate of between study variance. This statistic is referred to in the output chart for GTC in Figure 1 along with other tests of inconsistency. An elevated tau-squared (tau2 > 1) would indicate substantial heterogeneity which might indicate an invalid meta-analysis.
Readers should be aware, when considering the results of a meta-analysis, of the existence of other unreported sources of bias. One important risk of bias which is neglected in CSRs is the risk of bias represented by unequal groups at baseline. In meta-analysis, the relative effect and confidence interval is based on a comparison between groups following an intervention, however there are often studies in which the groups are not similar at baseline on the main outcome measures or significant demographic variables, for example, time since injury. If groups are not similar at baseline then it can be assumed that this would bias the response to intervention. This is a particular problem in small group studies where it is expected that differences in mean baseline score on outcome measures would be magnified. This is a source of systematic bias that could influence meta-analysis findings when there is a handful of studies included. While the Cochrane Collaboration has an accepted ‘risk-of-bias’ tool, this does not consider differences in baseline. By way of comparison the PEDro-P scale, as used by databases such as PEDro and PsycBITE, includes an item that considers whether participants are equivalent at baseline on prognostic indicators and outcome measures.
One method for examining sources of bias, which is applicable to larger meta-analyses involving more than about 10 studies, is the use of a funnel plot. Sterne et al. (Reference Sterne, Sutton, Ioannidis, Terrin, Jones, Lau and Higgins2011) defined a funnel plot as a scatter plot of effect estimates from individual studies against a measure of each study's size or precision as an indication of statistical power. The studies are then plotted along a vertical axis with the most powerful studies plotted at the top and the effect estimates from smaller studies scattered around the bottom of the plot. The effect estimates should congregate around a central line which is the weighted average effect produced by the meta-analysis. The resultant plot should resemble an inverted funnel. If no bias is present then a triangle centred on the fixed-effect estimate and extending 1.96 standard errors either side will include 95% of studies (Sterne et al., Reference Sterne, Sutton, Ioannidis, Terrin, Jones, Lau and Higgins2011). When the studies are plotted, the lack of a funnel shape, particularly on the side representing studies that demonstrate a lack of effectiveness, might indicate the presence of publication bias or another element of systematic bias.
Publication bias occurs when studies with contrary findings do not appear in the literature, presumably due to pressure to publish findings in support of an intervention. CSRs attempt to address publication bias by including a grey literature search and in GTC there was in fact the uncovering of relevant studies that had been logged in a trials registry but not completed. Sterne et al. (Reference Sterne, Sutton, Ioannidis, Terrin, Jones, Lau and Higgins2011) provide options for a statistical test which might indicate a lack of funnel plot symmetry and discuss reasons why this might occur. It is important to question the existence of publication bias, especially considering that most researchers investigating a certain technique may be strong proponents of one particular approach or authors may strike opposition to reporting a null finding.
GRADE Analysis
The primary purpose of a systematic review is to collate all of the relevant research on a topic or intervention. If possible, the selected studies can be combined in a meta-analysis. CSRs go beyond this by excluding lower quality evidence (e.g., non-randomised group studies) and taking into account the quality of the identified studies in reaching conclusions and recommendations. This is demonstrated in a CSR by the use of ‘summary of findings’ tables that include a GRADE analysis. GRADE is an acronym for Grades of Recommendation, Assessment, Development and Evaluation Working Group which comprised representatives from 20 global health organisations.
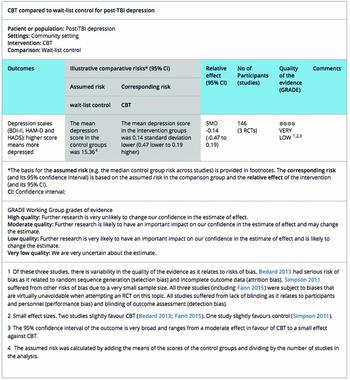
To conduct a GRADE analysis, authors of systematic review can access specialised GRADEPRO software via the GRADE website (www.gradeworkinggroup.org). As can be seen in Figure 2, the GRADE analysis takes into account the relative effect of the meta-analysis and integrates the quality of evidence which is derived from the risk of bias of each study. GRADE analyses also include a consideration of the risks of the intervention to the consumer. As can be seen from the screenshot of the main comparison in GTC the quality of the evidence is rated as ‘very low’. The superscript endnotes indicate the reasons for this quality grade and in the case of GTC this was due to substantial differences in risk of biases between the selected studies, the small effect size and the very broad 95% confidence interval of the effect.
GRADE Summary of Findings Table from Gertler, Tate, and Cameron (Reference Gertler, Tate and Cameron2015).

Beyond Cochrane Reviews
Just as the quality of studies varies so does the quality of systematic reviews. This has led onto the development of ‘systematic reviews of systematic reviews’ which appraises available reviews on a topic and can guide decision making when there is contrasting evidence (Smith, Devane, Begley, & Clarke, Reference Smith, Devane, Begley and Clarke2011). Resulting from this is ‘meta-analysis of meta-analyses’ in which past meta-analyses may be re-analysed to form updated conclusions (Anker, Reinhart, & Feeley, Reference Anker, Reinhart and Feeley2010).
Finally, Cochrane and other systematic reviews are a primary source of evidence in the development of clinical practice guidelines such as the ‘guidelines produced by the UK National Institute for Health and Clinical Excellence (NICE)’. Evidence from Cochrane and other systematic reviews may then have an influence on policy setting and the development of clinical services. The Cochrane Collaboration maintains a database of systematic reviews that have been quality assessed (referred to as ‘DARE’) and this can also be used by decision makers with questions about specific interventions when a CSR has not yet been undertaken.
Concluding Comments
Systematic reviews developed as a way to integrate studies on a topic. Simultaneously, meta-analysis developed as a statistical method to combine treatment effects from various studies into an overall estimate of treatment effect. In keeping with the trend towards the production of higher-quality research, CSRs were developed as the gold-standard in systematic review. CSRs employ a variety of data-analytic techniques including meta-analysis. The quality of meta-analyses can vary and in a CSR weighting is given to studies based on statistical variability. Using a GRADE analysis, CSRs consider the results of the meta-analysis in the context of risk of biases in order to provide a reliable picture of treatment outcomes for a particular intervention or clinical problem. As such, CSRs provide useful guidance for clinicians, researchers, consumers and policy-makers.
Financial Support
This research received no specific grant from any funding agency, commercial or not-for-profit sectors.
Conflict of Interest
None.
Ethical Standards
The authors assert that all procedures contributing to this work comply with the ethical standards of the relevant national and institutional committees on human experimentation and with the Helsinki Declaration of 1975, as revised in 2008.