


One of the most important and enduring topics in political science is the influence of business on politics. Scholars have examined how businesses secure preferential government policies, often at the expense of society as a whole (e.g., Baumgartner and Leech Reference Baumgartner and Leech1998; Lindblom Reference Lindblom1977; Schattschneider Reference Schattschneider1960; Schlozman and Tierney Reference Schlozman and Tierney1986; Wilson Reference Wilson1974).
A large body of research has explored how firms influence policymaking via lobbying (for an overview, see Drutman Reference Drutman2015).Footnote 1 In this article, we investigate a less-studied way in which firms influence government. Firms sometimes engage in private regulation; they voluntarily go beyond the requirements of current law (e.g., Potoski and Prakash Reference Potoski and Prakash2005; Prakash Reference Prakash2000a; Prakash and Potoski Reference Prakash and Potoski2006; Vogel Reference Vogel2005, Reference Vogel2008). Firms may, for example, change their business operations by cutting back on pollution and developing green products that are not mandated by regulations. They may take these steps unilaterally or coordinate with other players in their industry.
Some scholars claim that firms overcomply with existing regulations as a strategy to preempt new legislation, avoid stiff enforcement, mollify interest groups, and prevent public protests (e.g., Baron Reference Baron2014; Fooks et al. Reference Fooks, Gilmore, Collin, Holden and Lee2013; Kinderman Reference Kinderman2012; Lyon and Maxwell Reference Lyon and Maxwell2004; Maxwell, Lyon, and Hackett Reference Maxwell, Lyon and Hackett2000; Werner Reference Werner2012). By exceeding the requirements of status quo regulations, firms may dissuade key actors in the policymaking process—government officials, interest groups, and the mass public—from demanding more stringent regulations.
For instance, in the aftermath of gas leaks by Union Carbide plants in Bhopal, India, in 1984 and Institute, West Virginia in 1985, the Chemical Manufacturers Association (CMA) introduced the Community Awareness and Emergency Responses Program, a voluntary effort that exceeded government requirements. The CMA then launched the Responsible Care program, which laid out guiding principles and codes of conduct related to chemical safety. These voluntary measures may have forestalled harsh regulations against the chemical industry (Prakash Reference Prakash2000b). Another example is the 1995 German Declaration on Global Warming Prevention, through which BDI, a federation of German industries, voluntarily committed to reduce CO2 emissions. The German government responded by shelving plans for an energy tax (Delmas and Montes-Sancho Reference Delmas and Montes-Sancho2010).
This article investigates whether and under what conditions private regulations can preempt public regulations. Our research focuses on voluntary environmental programs (VEPs), in which firms go beyond the requirements of current environmental law.Footnote 2 We examine environmental regulation not only because it is substantively important, but also because there is a robust literature on VEPs to which this article contributes (Potoski and Prakash Reference Potoski and Prakash2013). Moreover, environmental policy is a multifaceted domain, encompassing a wide range of policy issues. Finally, the costs of environmental self-regulations can vary significantly, opening opportunities to compare substantial efforts versus less meaningful ones.Footnote 3
There is surprisingly little research about whether VEPs bring political benefits for firms. A few scholars have studied whether VEPs cause government officials to curtail the enforcement of existing regulations. Innes and Sam (Reference Innes and Sam2008), for example, analyzed participation in the EPA’s 33/50 program, a voluntary agreement between firms and the U.S. government to reduce the release of 17 chemical pollutants. They found that participating firms experienced significant reductions in government inspections.Footnote 4 By contrast, no studies to our knowledge have quantified the effect of VEPs on support for passing new regulations. Do VEPs actually succeed in dampening support for regulations? Do the effects vary by the type of VEP and the audience evaluating the programs? What are the broader implications for corporate power?
To address these questions, we conducted experiments involving three key groups in the United States that often demand environmental regulations: ordinary citizens, environmental activists, and government officials.Footnote 5 Our activist samples included affiliates of the Audubon Society (one of the largest environmental organizations in the United States) and people who had previously signed an environmental petition demanding government regulations to address climate change. Our sample of government officials included legislators, executives, regulators, and staff at all levels of government.
We randomized information about VEPs and measured how this information affected support for more stringent policies. We found that VEPs dissuaded all three groups from calling for stiffer environmental regulations. However, the magnitude of the effect depended critically on the percentage of companies within an industry that joined the voluntary effort. When only half the firms took voluntary action, a scenario we call narrow participation, their efforts typically did not affect support for regulation. When nearly all firms within an industry participated (broad participation), by contrast, the impact on policy preferences was substantial. Hence, the breadth of participation by firms is fundamental to understanding the relationship between private and public regulations.
We also distinguish deep reforms, in which VEPs go well beyond current requirements, from shallow reforms, which involve only modest steps beyond the status quo. In our experiments, environmental activists responded more strongly to deep reforms than to shallow ones, but government officials and the public did not. Moreover, among all three groups, shallow actions substantially depressed support for government regulation, as long as the firms taking voluntary action succeeded in getting their peers to join. Thus, even shallow corporate actions can preempt support for government regulations, a finding with potentially troublesome implications for social welfare.
This article advances our understanding of the role of corporations in politics by providing, to our knowledge, the first micro-level empirical evidence that self-regulation has a causal effect on support for government regulation. Our analysis also contributes to the extensive literature on the formation of public preferences (Druckman and Lupia Reference Druckman and Lupia2000). Prior research has documented the persuasive impact of parties (Bullock Reference Bullock2011), politicians (Carmines and Kuklinski Reference Carmines, Kuklinski, Ferejohn and Kuklinski1990), the media (Iyengar and Kinder Reference Iyengar and Kinder1987), advocacy groups (Arceneaux and Kolodny Reference Arceneaux and Kolodny2009), and courts (Bartels and Mutz Reference Bartels and Mutz2009). There has been less work about the persuasive power of corporations [though see Walker’s (Reference Walker2014) study of corporate grassroot campaigns subsidized by firms and organized by public affairs consultants]. We show how corporations not only lead citizens to act on existing preferences (e.g., Kollman Reference Kollman1998; Smith Reference Smith2000) but also persuade people to change their policy attitudes.
The article is organized as follows. We first review the existing literature and present a series of competing theoretical predictions that motivate our empirical inquiry. We then describe our sampling procedures, experimental design, and statistical model. Finally, we analyze how our unique samples of environmental activists, ordinary citizens, and government officials responded to VEPs. We conclude by discussing the implications of our findings for the study of corporate influence, government regulation, and environmental politics.
PREVIOUS LITERATURE AND TESTABLE HYPOTHESES
We extend previous research in political science about the strategic interplay between corporations and other political actors. Werner (Reference Werner2012), for example, found that firms engage in self-regulation and other forms of corporate social responsibility in response to shifts in public opinion and threats from activists and regulators. Werner’s work shows how political threats affect the behavior of firms. In this article, we explore the reverse relationship: how the actions of firms—and specifically their efforts at self-regulation—affect the political threat environment by transforming the preferences of politicians, activists, and the mass public.Footnote 6
We also build on prior research about coordination among firms. Precisely because private regulation is costly, firms might be tempted to free-ride on the self-restraint of other firms without moderating their own activities. As Potoski and Prakash (Reference Potoski and Prakash2005, Reference Potoski and Prakash2013) explain, firms can overcome this collective action problem by creating club goods, i.e., benefits that can be withheld from firms that do not participate in the VEPs. We investigate whether such VEPs preempt support for public regulation, and how the responses of key stakeholder groups depend on the size of the “green club,” i.e., the fraction of firms that join VEPs.
Finally, an extensive literature on ethical consumerism (e.g., Devinney, Auger, and Eckhardt Reference Devinney, Auger and Eckhardt2010; Hainmueller, Hiscox, and Sequeira Reference Hainmueller, Hiscox and Sequeira2015) explores whether self-regulation makes people more likely to purchase a company’s products and services. We expand on this work by examining whether self-regulation influences people not only as customers but also as citizens and activists.
The Overall Effect of VEPs
To theorize about how VEPs might affect support for regulations, consider a one-dimensional policy space with less restrictive regulations on the left and more restrictive regulations on the right. Let p represent a policy that would substantially increase environmental regulations on firms, relative to the status quo, q. Suppose firms engaged in a less-intense voluntary environmental program, v, such that q < v < p. How would v affect support for raising government regulations from q to p?
It is not obvious how VEPs would affect the policy preferences of ordinary citizens, interest groups, and government officials. On the one hand, VEPs could decrease demand for environmental regulations. If people believe that v is a significant step in the direction of p, VEPs could reduce support for switching to p by persuading people that the environmental problem has been partially, albeit incompletely, solved. This is perhaps the standard mechanism in the literature through which VEPs could preempt government regulations (e.g., Maxwell, Lyon, and Hackett Reference Maxwell, Lyon and Hackett2000; Glachant Reference Glachant2007; Fleckinger and Galchant Reference Fleckinger and Glachant2011). Moreover, once firms have invested in technologies that partially solve an environmental problem, citizens may be reluctant to demand stiffer standards that would destroy the value of the firms’ investments. Lutz, Lyon, and Maxwell (Reference Lutz, Lyon and Maxwell2000) argue that leading firms can strategically lock in weaker regulations compared to counterfactual government regulations. Furthermore, if part of the motivation to impose regulations stems from a desire to punish nonrepentant firms that are causing environmental problems, the admission of responsibility and the contrition implied by VEPs could lead observers to forgive companies and relax their punitive zeal (Gilbert, James, and Shogren Reference Gilbert, James and Shogren2018). Finally, private regulation may reduce incentives for politicians to spend effort crafting legislation if they cannot claim credit for achieving a change in the status quo (Reference Druckman and ValdesDruckman and Valdes, forthcoming).
On the other hand, VEPs could increase demand for environmental regulations. Observers could interpret VEPs as proof that environmental problems are real and that firms can afford to behave more responsibly. Denicolò (Reference Denicolò2008) argues that self-regulation could have such a signaling function. VEPs also might raise the aspirations of citizens, activists, and officials, leading to demands for more action (Bendor et al. Reference Bendor, Diermeier, Siegel and Ting2011). If so, some firms might use VEPs as part of a conscious strategy for promoting—rather than avoiding—stiffer regulation (Urpelainen Reference Urpelainen2011). Large firms, in particular, may engage in corporate environmentalism and then lobby for government to impose the same standards on other firms. In this way, the voluntary actions of environmental leaders could lead to involuntary regulations against environmental laggards (Barrett Reference Barrett1991; Denicolò Reference Denicolò2008).Footnote 7 Consistent with the possibility that VEPs could make environmental regulation more likely, research suggests that interest groups may treat self-regulating firms as “soft targets” that are susceptible to activist pressure (Baron and Diermeier Reference Baron and Diermeier2007; Baron, Harjoto, and Jo Reference Baron, Harjoto and Jo2011; King and McDonnell Reference King, McDonnell, Tsutsui and Lim2015). If enough individual firms within in industry engage in VEPs, it is conceivable that activists would then regard the entire industry as a soft target for regulation.
There is a third possibility, however: VEPs could have no effect on the demand for environmental regulation. Several mechanisms could contribute to a null result. For instance, observers might doubt that firms would honor their promises to launch VEPs and sustain the programs when market pressures change. Observers know that, promises notwithstanding, firms could delay implementation, cancel their plans, or restrain their behavior for a time, only to roll back their efforts at some point in the future. Indeed, VEPs are almost never binding, contributing to suspicion about their effects on the environment and social welfare (Glachant Reference Glachant2007). If people do not trust firms to implement and sustain their environmental programs, VEPs may do little to dampen enthusiasm for government regulations. Finally, VEPs may not influence support for regulation if people perceive VEPs as cynical attempts at “greenwashing” (Delmas and Burbano Reference Delmas and Burbano2011; Lyon and Maxwell Reference Lyon and Maxwell2011; Delmas and Montes-Sancho Reference Delmas and Montes-Sancho2010).
Even when corporate initiatives are perceived as credible, though, they might be too weak to affect demand for government regulation. Environmental activists, in particular, often prefer extreme measures that companies would not be willing to undertake voluntarily. These activists presumably would not be mollified by corporate actions that fall short of their desired goals.Footnote 8 For related reasons, VEPs might not convince ordinary citizens and government officials to change their views. If opinion is highly polarized, with some people demanding extremely stringent environmental regulations and the remainder opposing any new regulations regardless of voluntary corporate environmentalism, then intermediate steps by corporations might not sway members of either camp.
Finally, VEPs could prove inconsequential in the aggregate because the responses of different groups could cancel each other out. In heterogeneous societies, VEPs could increase support for regulation among some people while reducing support among others. Wherever these two groups are of roughly equal size, VEPs could change the attitudes of many individuals without affecting opinion overall.
For all these reasons, it is not obvious whether VEPs would increase, decrease, or have no effect on support for regulation. This is ultimately an empirical question, which we address through experiments.
The Effects of Breadth and Depth
If VEPs affect attitudes toward government regulation, will some VEPs move opinion more than others? To explore this possibility, we distinguish two key dimensions of VEPs: breadth and depth. Breadth refers to the percentage of companies within an industry that are taking voluntary initiatives to protect the environment. Broad initiatives involve most or all firms in an industry, whereas narrow initiatives engage a smaller set of players. Prominent examples of industry-wide efforts to self-regulate include the CMA’s Responsible Care program described above and the Motion Picture Association of America’s film rating system, which provides content information for parents in the absence of explicit government rules or censorship. Our second dimension, depth, captures the amount of voluntary effort individual firms are exerting. Deep reforms go far beyond the requirements of current law, whereas shallow reforms represent smaller departures from the status quo. We anticipate that opinions about regulation will shift more sharply in response to broad and/or deep initiatives than in response to narrow and/or shallow ones.
Which dimension should be more important for explaining attitudes toward regulation? In other words, would attitudes respond more strongly if participation expanded from narrow to broad, or if effort increased from shallow to deep? There are several reasons why breadth might dominate. First, government regulations vary in strength, but they almost always apply to all firms in an industry. For this reason, citizens may view narrow corporate initiatives as unacceptable substitutes for government regulations. Second, if participation is narrow, observers might worry about adverse selection, in which the worst polluters opt out, leaving participation to firms that were green before the initiative began. Third, if participation is narrow, participating firms might backtrack in the future to avoid suffering a competitive disadvantage vis-à-vis nonparticipating firms. These hypotheses provide insight into what makes regulations legitimate, and why self-regulation may be considered a potential substitute only when all companies within in an industry are subject to regulation. For these reasons, we expect breadth to prove more consequential than depth.
To arbitrate between these competing perspectives, we designed a series of experiments, which we administered to three groups of actors: environmental activists, the mass public, and government officials. In the remaining sections, we describe our experimental design, formalize our hypotheses, explicate our sampling procedures, and present our findings.
EXPERIMENTAL DESIGN AND STATISTICAL MODEL
We used survey experiments to investigate whether VEPs would decrease, increase, or have no effect on support for government regulations.Footnote 9 Our experiments focused on six environmental issues: plastic packaging for foods and beverages; genetically modified foods (GMOs); new-generation insecticides called neonicotinoids; bird deaths due to wind turbines; overfishing of bluefin tuna; and fuel efficiency standards for automobiles.Footnote 10 In our studies of environmental activists and government officials, each participant was randomly assigned to consider three issues; in our studies involving the mass public, each participant saw two issues.
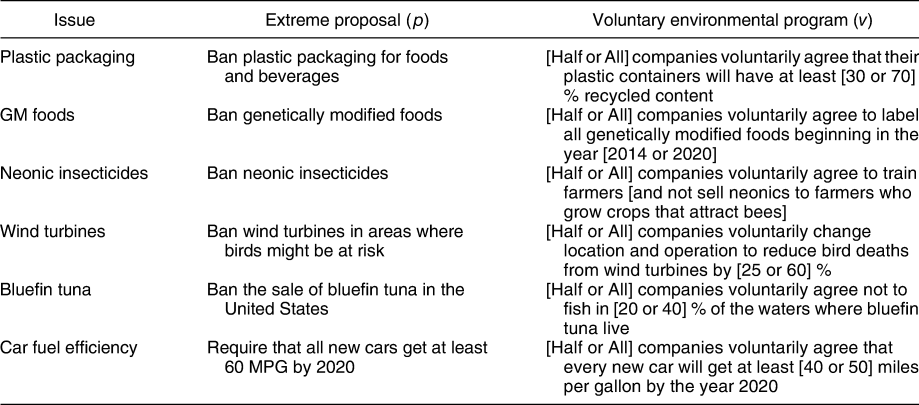
For each issue, we first described the environmental problem without mentioning a VEP and measured support for extreme government regulations. We then presented hypothetical scenarios in which firms were engaging in VEPs, and remeasured the same respondents’ support for extreme regulations. The scenarios varied along two dimensions, each with two levels: the breadth of participation by companies within the industry (broad versus narrow), and the depth of measures that participating firms were taking to protect the environment (deep versus shallow). For each issue, Table 1 compares the extreme regulatory proposal (p) to the less-stringent VEPs (v).Footnote 11
Extreme Proposals (p) and VEPs (v)

We randomized these dimensions independently, resulting in four types of VEPs: broad and deep, broad and shallow, narrow and deep, and narrow and shallow. Each respondent considered two of the four VEP scenarios. Thus, each respondent expressed their preferences in a baseline scenario that did not mention voluntary action, and in two of the four conditions in which firms were voluntarily protecting the environment. Figure 1 displays our randomization scheme and the measures we elicited.
Randomization Protocol
Note: After introducing an issue, we measured support for regulation in a baseline scenario that did not mention VEPs. We then assigned the respondent to one of four tracks. Each track measured support for regulation under two distinct scenarios in which firms were engaging in a VEP.

To illustrate these procedures, we describe our protocol for plastic packaging (the full question wordings for all six issues can be found in the Supplementary Material). We introduced the issue by explaining, “Some people think the U.S. government should ban plastic containers for prepackaged foods and drinks. They say the production and disposal of plastic containers hurts the environment. Other people think the government should not ban plastic containers for prepackaged foods and drinks. They say a ban would impose high costs on businesses and consumers by significantly increasing the price of food.”
We then asked, “Do you think the government should or should not ban plastic containers for prepackaged foods and drinks?” The response options were should ban, should not ban, or don’t know. We also administered a follow-up question that measured how strongly respondents felt about their answer: very strongly, somewhat strongly, or not strongly at all. These questions revealed the respondent’s baseline level of support for extreme government regulations. We used the answers to construct a seven-point scale that ranged from zero (very strongly opposed a ban) to 100 (very strongly supported a ban). Respondents who said “don’t know” were scored at the midpoint, 50.Footnote 12
Next, we randomly presented one of four scenarios in which companies were taking voluntary action to recycle plastic. Thus, respondents read about a situation in which a VEP was either deep or shallow and participation was either broad or narrow. We operationalized a VEP as deep if companies committed to use containers with at least 70% recycled content, but shallow if they committed to use only 30% recycled content.Footnote 13 In scenarios with broad voluntary action, all food and beverage manufacturers changed their practices; in scenarios with narrow voluntary action, on the other hand, only half of the manufacturers made the shift.
The deep and broad scenario read: “Companies sometimes take voluntary steps to protect the environment; they do more than what the government requires. Suppose that all food and beverage manufacturers voluntarily increase their efforts to recycle plastic, by making sure their plastic containers have at least 70% recycled content. If all food and beverage manufacturers make this change without being required by the government, do you think the government should or should not ban plastic containers for prepackaged foods and drinks?” The other scenarios were similar, but we substituted 30% for 70%, replaced “all manufacturers” with “half of the manufacturers,” or both.
We analyzed data from the experiment by estimating the following OLS regression model:
 $${Y_i} = \alpha + {\beta _1}{\rm{B}}{{\rm{D}}_i} + {\beta _2}{\rm{B}}{{\rm{S}}_i} + {\beta _3}{\rm{N}}{{\rm{D}}_i} + {\beta _4}{\rm{N}}{{\rm{S}}_i} + {\varepsilon _i}\hbox,$$
where i indexes respondent-issue observations; Y i represents support for stringent environmental regulations on a scale from 0 to 100; BDi, BSi, NDi, and NSi are dummy variables representing the four treatment conditions (broad and deep, broad and shallow, narrow and deep, and narrow and shallow); and εi is a normally distributed stochastic error. For some analyses, we pooled data from all respondents and environmental issues; for other analyses, we estimated equation (1) for each issue or category of respondents. As noted earlier, each participant opined on several issues, and on any given issue they answered questions about three scenarios (the baseline and two treatments). To correct for interpersonal correlation, we clustered standard errors by respondent.
Using equation (1), we estimated the effects of voluntary corporate action on support for regulations. The constant term, α, represents support for government regulations in the baseline condition without VEPs, and the βs quantify how each type of VEP changes opinion relative to the baseline. We can formally state the null hypotheses as follows:
H10: Broad and deep VEPs do not affect support for regulations (β1 = 0)
H20: Broad and shallow VEPs do not affect support for regulations (β2 = 0)
H30: Narrow and deep VEPs do not affect support for regulations (β3 = 0)
H40: Narrow and shallow VEPs do not affect support for regulations (β4 = 0)
By combining parameters, we were able to estimate conditional effects, as well, and assess the relative strength of breadth vs. depth. The effect of broad VEPs conditional on deep action was β1 − β3, whereas the effect of broad VEPs conditional on shallow action was β2 − β4. Likewise, the effect of deep VEPs conditional on broad participation was β1 − β2, whereas the effect of deep VEPs conditional on narrow participation was β3 − β4. We can formally state the null hypotheses as follows:
H50: Breadth has no effect when VEPs are deep (β1 − β3 = 0)
H60: Breadth has no effect when VEPs are shallow (β2 − β4 = 0)
H70: Depth has no effect when VEPs are broad (β1 − β2 = 0)
H80: Depth has no effect when VEPs are narrow (β3 − β4 = 0)
Our research design involved repeated measures, which increased statistical power relative to a between-subjects design. Experiments with repeated measures do, however, create the potential for instrument reactivity since “making measurements can produce change on its own, regardless of any intervention” (de Vaus Reference de Vaus2001, 63). To address this concern, we conducted follow-up studies based on a modified version of the Solomon four-group design, in which we elicited repeated measures from some respondents, but not others. We found little evidence of instrument reactivity, and the use of repeated measures did not affect our conclusions about the efficacy of VEPs.Footnote 14
SAMPLING PROCEDURES: ENVIRONMENTAL ACTIVISTS, MASS PUBLIC, AND GOVERNMENT OFFICIALS
Regulatory policy is a product of a democratic process that weighs the preferences of interest groups, the mass public, and government officials. We studied how VEPs affect these distinct groups by administering experiments to two samples of environmental activists, a sample of ordinary citizens, and two samples of government officials.Footnote 15 We obtained the first activist sample in collaboration with The Audubon Society (hereafter, Audubon), one of the largest environmental organizations in the United States. In October 2013, Audubon sent email invitations to a random sample of people who satisfied at least one of the following criteria: they were dues-paying members of Audubon and subscribers to Audubon magazine; they had donated money to Audubon in the past; or they had signed up to receive emails alerting them to take political action—such as signing petitions and contacting politicians—on environmental issues. A total of 2,374 Audubon affiliates completed the survey between October and December 2013.Footnote 16
We obtained a second activist sample by cosponsoring an environmental petition on Care2, a social networking website that was founded in 1998 and grew to become one of the most popular hosts for petitions about environmental issues. The petition, which appeared on the Care2 website in July 2013, urged members of Congress to take strong and swift action on climate change. Each signatory typed their name, email address, and mailing address. After harvesting contact information from each signatory, we emailed them in February 2014 to complete a survey, which contained our embedded experiments. Of the 10,710 people we emailed, 1,722 completed our questionnaire. These people represent our second sample of environmental activists.
We also administered experiments to a sample of 1,708 adults in the United States. Survey Sampling International, a professional polling firm, provided the respondents, who were interviewed in April 2014. To further enhance the representativeness of the sample, we constructed post-stratification weights to match U.S. Census benchmarks for gender, age, education, and race, and to match the Pew Research Center’s benchmarks for political party affiliation (Pew Research Center 2015).Footnote 17
Finally, we administered experiments to two samples of government officials. For these special samples, we acquired contact information for more than 60,000 government officials from the firm KnowWho, including legislators and executives at all levels of government, and legislative staffers and regulators at the federal and the state levels. From this large list, we drew a random sample of 10,200 officials, whom we emailed in August–October 2015 to request participation in a study. A total of 923 officials completed this first study. We contacted a second random sample of 10,397 officials in October 2016, resulting in an additional 608 completed interviews.
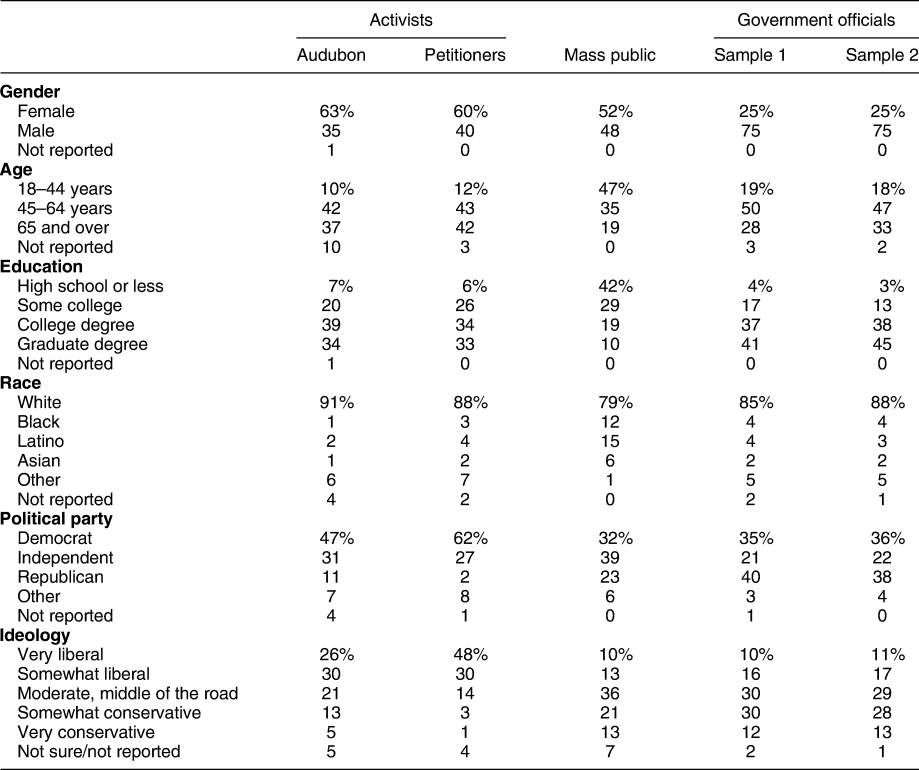
Before analyzing how these groups responded to our experimental manipulations, we profile each group. As expected, environmental activists (both Audubon affiliates and petition signatories) differed from the mass public on many demographic dimensions. Table 2 shows that activists were older and more educated than the mass public, and more likely to be female and white. Activists were also more toward the left wing of the political spectrum. Approximately 47% of Audubon affiliates and 62% of petition signatories declared themselves to be Democrats, whereas only 32% of the mass sample identified with the Democratic Party. Likewise, 56% of Audubon affiliates and 78% of petitioners professed to be somewhat or very liberal. Among the mass public, the analogous statistic was only 23%.
Demographic Variables, by Sample

Note: Sample sizes were 2,374 for Audubon affiliates; 1,722 for petition signatories; 1,708 for the mass public; and 923 and 608 for government officials. Percentages for race sum to more than 100% because respondents could check more than one racial category.
Table 2 also shows that our samples of government officials differed from the public in predictable ways. Compared to ordinary citizens, the government officials in our studies were more likely to be male, middle-aged, and white. The officials were also more educated than the typical American; more than 40% of the officials in our study had graduate degrees, and an additional 37–38% had completed college. Despite these differences, our government samples reflected the political diversity of the country as a whole. Democrats, Independents, and Republicans were well represented in our samples, as were leaders of all ideological stripes.
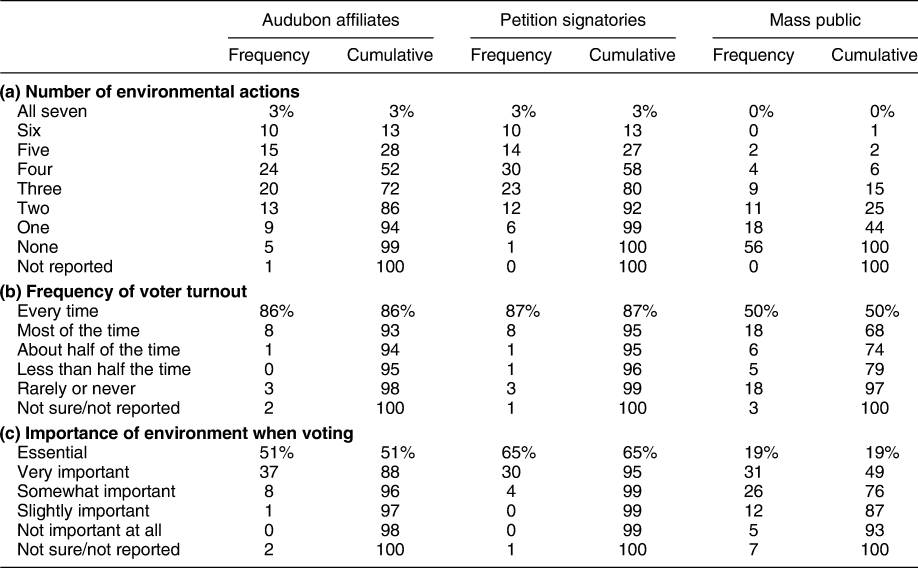
As we anticipated, Audubon affiliates and environmental petitioners were extremely active in environmental politics. We asked which of the following seven actions (if any) respondents had taken on an environmental or conservation issue: attended a rally, boycotted a product, contacted a politician, donated money, organized a protest, signed a petition, or volunteered time. As Table 3a shows, a majority of Audubon affiliates and petition signatories had done at least four of the seven activities, and over a quarter had completed at least five. Practically all respondents in these groups had taken at least one concrete action in support of an environmental cause.
Environmental Activism, by Sample

Note: Table 3a shows how many of the following a respondent had done on an environmental issue: attended a rally, boycotted a product, contacted a politician, donated money, organized a protest, signed a petition, or volunteered time. Table 3b presents answers to the question, “About how often do you vote in national elections—that is, for President, Senator, or Representative?” Table 3c shows answers to the question, “Generally speaking, when deciding whom to vote for in a national election, how important to you is the candidate’s position on environmental issues?” N = 2,374 for Audubon affiliates, 1,722 for petition signatories, and 1,708 for the mass public.
We also measured willingness to express environmental preferences during elections by asking, “About how often do you vote in national elections—that is, for President, Senator, or Representative?” As Table 3b shows, at least 86% of Audubon affiliates and petition signatories reported voting every time, and an additional 8% said most of the time. Furthermore, we asked, “Generally speaking, when deciding whom to vote for in a national election, how important to you is the candidate’s position on environmental issues?” Among Audubon affiliates, 51% answered that environmental issues were essential, and an additional 37% said that the environment was a very important voting criterion. Petition signatories assigned an even higher political priority to environmental issues: 65% regarded the candidate’s environmental stance as essential, and another 30% deemed it very important (Table 3c).
Levels of environmental activism were considerably lower among ordinary citizens. Most had not taken any of the seven measures we listed, and only 25% had participated in two or more. Moreover, only half of ordinary citizens reported voting all the time, less than half regarded the environmental stances of politicians as very important, and only 19% indicated that environmental issues were essential to their vote. Our samples enabled us to test whether ordinary citizens were more or less responsive to VEPs than people who were deeply engaged in environmental activism.
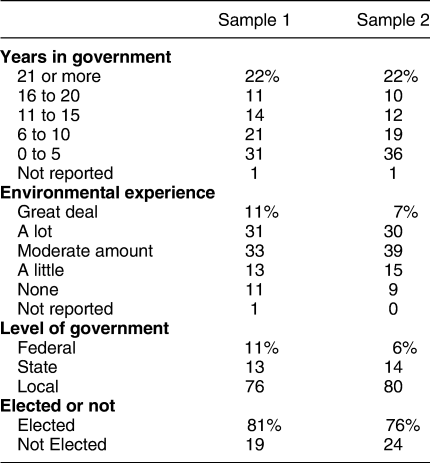
Although we did not ask officials whether they had boycotted products, staged protests, or engaged in other forms of environmental activism, we did inquire about their political and environmental experience. Table 4 shows that around two-thirds of our respondents had been working in government for more than five years, and roughly one-third had been in office for more than 15 years. The table also summarizes how officials responded to the question, “How much experience do you have working on environmental issues?” The median member of our sample was moderately experienced, and 37–42% reported having either a lot or a great deal of experience on environmental issues. More than three quarters of our respondents were elected, and most held positions in local government, although the sample also included significant shares of officials at the state and federal levels.
Political Experience of Government Officials

Note: N = 923 for sample 1 and 608 for sample 2.
EFFECT OF VEPS ON ACTIVISTS AND CITIZENS
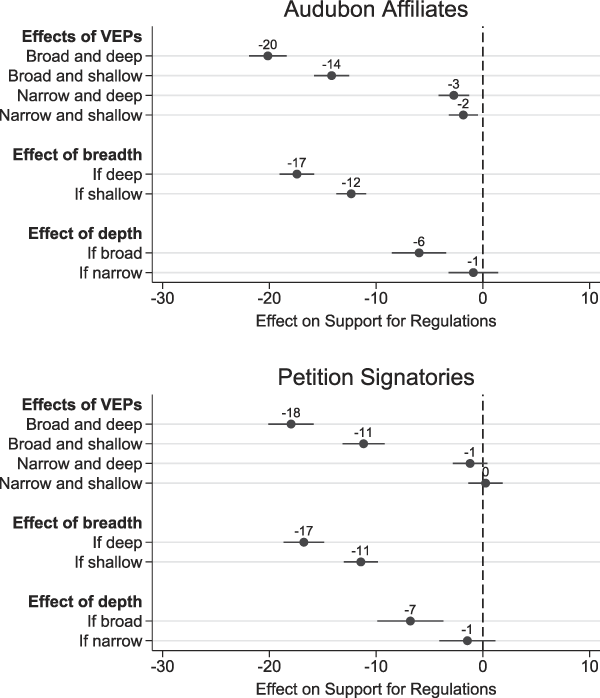
Having described our unique samples, we now analyze how VEPs affected support for government regulation among activists and citizens. Figure 2 presents the effects on Audubon affiliates (top graph) and petition signatories (bottom graph) when we pooled all six issues. Within each graph, the first four dots (corresponding to hypotheses H10 through H40) represent the average effects of VEPs on support for regulation, relative to the baseline condition in which no voluntary action was mentioned. The remaining dots (corresponding to hypotheses H50 through H80) summarize the effects of broad VEPs conditional on whether corporate efforts were deep or shallow, and the effects of deep VEPs conditional on whether corporate efforts were broad or narrow. In these plots and all others, the thin horizontal lines represent 95% confidence intervals. Given the large sample sizes, nearly all effects were statistically significant at p < 0.05 (two-tailed). Therefore, in the discussion below, we focus on substantive effect sizes and only note when an effect was not statistically significant.
Effects of VEPs on Environmental Activists
Note: Effects are defined as changes in support for regulations on a 100-point scale, relative to a baseline score when no VEP was mentioned. The baseline score was 69 for Audubon affiliates and 76 for petition signers. The Audubon graph is based on 21,214 observations, and the petitioners' graph is based on 15,440 observations. The Bonferroni method was used to adjust confidence intervals for multiple comparisons.

We found that voluntary corporate action sapped support for regulation among Audubon affiliates, especially when a broad swath of the industry participated. Broad and deep VEPs reduced support for regulations by 20 points, a substantively large change relative to the baseline of 69 points when no corporate action was mentioned. Broad but shallow actions were also consequential; they depressed support for regulations by 14 points, on average, across the six issues in our experiment. The impact of shallow measures on activists is surprising and potentially troubling. If even shallow measures suppress the desire for regulation, VEPs may not be as environmentally beneficial as businesses and some scholars have suggested.
When only half the firms in an industry participated, the effects of VEPs on Audubon affiliates were more modest. Enthusiasm for regulations fell by only three points when firms engaged in narrow and deep VEPs, and dropped by only two points when firms undertook narrow and shallow VEPs. Although both effects were statistically significant owing to the large sample, they represented small movements on our 100-point scale. Overall, Audubon affiliates were far more willing to relax their regulatory demands when all firms participated in the environmental effort than when only half undertook voluntary environmental initiatives.Footnote 18
Moreover, the effects of breadth depended on depth. When firms in an industry were taking deep voluntary action, support for regulation was 17 points lower if all firms joined than if only half did. When voluntary action was shallow, however, breadth proved less consequential: moving from narrow to broad participation reduced regulatory sentiment by 12 points, rather than 17. These conditional effects, with confidence intervals, appear in Figure 2 under the labels “Effect of breadth: if deep,” and “Effect of breadth: if shallow.”
Likewise, the effects of depth depended on breadth. When all members of an industry were undertaking voluntary action, the regulatory impulse was six points weaker if efforts were deep than if they were shallow. When only half the firms were acting voluntarily, though, respondents did not perceive deep action as significantly better than shallow action; the effect of depth given narrow VEPs was only one point and statistically insignificant.
We replicated these findings with a different sample of environmental activists, who had signed an environmental petition to Congress (bottom half of Figure 2). Among petitioners, baseline support for regulation was 76 out of 100 when we presented environmental issues without mentioning autonomous corporate action. Compared to this baseline, enthusiasm for regulation was 18 points lower when firms displayed broad and deep voluntary initiatives and 11 points lower when firms displayed broad but shallow voluntary initiatives. Again, the influence of even shallow measures on activists exposes the environmental downsides of VEPs.
Petitioners, much like Audubon affiliates, were less impressed by VEPs that engaged only half the firms in an industry. Narrow but deep actions moved the regulatory needle by only one point, a statistically insignificant and substantively miniscule shift. Moreover, the effect of narrow and shallow activities was approximately zero and statistically insignificant.
Finally, our study of petitioners confirmed that the effects of breadth depended on depth, and vice versa. The marginal effect of breadth was 17 points given deep initiatives, compared with 11 points given shallow initiatives. Likewise, respondents perceived a bigger difference between deep and shallow behavior when efforts involved the entire industry (seven points) than when efforts were confined to only half the industry (only one point and statistically insignificant).
In summary, our studies of Audubon affiliates and petition signatories showed that voluntary corporate action reduced support for government regulation among activists, especially when nearly all members of an industry joined the voluntary effort. This finding was not preordained. As emphasized earlier, activists could have responded with indifference, or they could have demanded even stricter standards in the wake of corporate action.
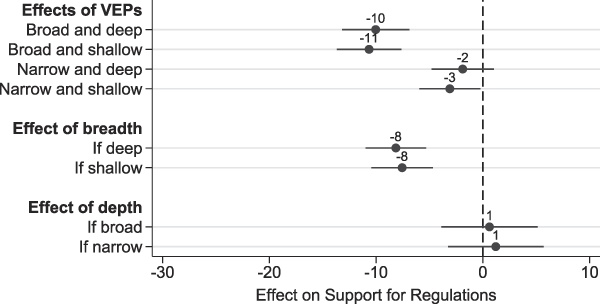
Would the mass public respond similarly? To find out, we administered the same experiment to a representative sample of adults in the United States. Figure 3 presents our findings, again averaging across all six environmental issues. When we did not mention voluntary corporate action, support for regulations was 50 points out of 100, lower than the baseline rate among the activist samples. Relative to this baseline, regulatory sentiment fell by 10–11 points when voluntary corporate environmentalism was broad, versus only 2–3 points when voluntary corporate environmentalism was narrow. In this fundamental sense, ordinary citizens behaved like activists: reacting strongly when all firms pitched in but barely budging when only half contributed.
Effects of VEPs on the Mass Public
Note: Effects are defined as changes in support for regulations, relative to a baseline score of 50 when no VEP was mentioned. The graph is based on 10,242 observations, distributed equally across six environmental issues. The Bonferroni method was used to adjust confidence intervals for multiple comparisons.

In two ways, however, the responses of ordinary citizens differed from those of activists. First, ordinary citizens did not perceive a distinction between deep and shallow VEPs; they reacted just as favorably to minor changes as to major ones.Footnote 19 Thus, corporations could use even minor measures to alter public preferences, thereby thwarting government regulations that might have done more to protect the environment. Second, ordinary citizens were less responsive to treatment. Broad and deep voluntary initiatives moved public opinion by only 10 points, for example, but the same corporate actions shifted activist opinion by 18–20 points.Footnote 20 Overall, though, our experiments confirmed that VEPs lowered support for regulation among both ordinary citizens and environmental activists, while also revealing differences in the responsiveness of the two groups.
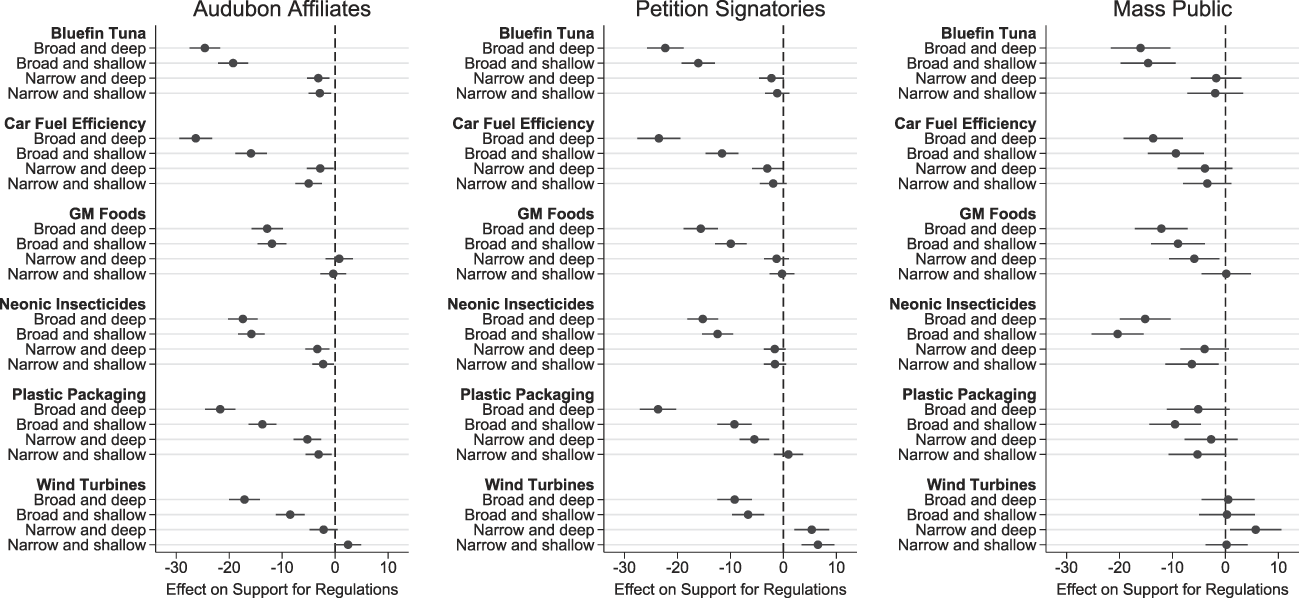
Having pooled data from all six issues to infer the average effects of VEPs on support for regulation, we now explore whether the effects differ by issue.Footnote 21 The left panel of Figure 4 shows the responses of Audubon affiliates.Footnote 22 Regardless of whether the scenario involved bluefin tuna, car fuel efficiency, genetically modified foods, neonicotinoid insecticides, plastic packaging, or wind turbines, broad VEPs reduced support for government regulations. The effects were larger for some issues than for others, but broad and deep voluntary action always moved attitudes by at least 13 points, and on half of the issues the estimated effects exceeded 20 points. Broad but shallow efforts also proved consequential, albeit to a lesser degree: they moved the dependent variable by 8–19 points, depending on the issue.
Effects of VEPs on Activists and the Mass Public, by Issue
Note: Effects were calculated relative to baselines in which no VEP was mentioned.

The effects of narrow VEPs were small by comparison, typically changing the opinions of Audubon affiliates by only 2–3 points on the 100-point scale. Moreover, on one issue, wind turbines, narrow and shallow voluntary action efforts apparently backfired, making Audubon affiliates more willing to ban wind turbines in the migratory pathway of birds. As we will see, this finding was not a fluke: it recurred when we surveyed petition signatories and members of the mass public.Footnote 23
The middle panel of Figure 4 summarizes the responses of people who signed our online petition.Footnote 24 The patterns were similar to ones we observed with Audubon affiliates. Broad and deep initiatives moved the attitudes of petitioners by 9–24 points; broad but shallow initiatives shifted their preferences by 7–16 points; and narrow voluntary initiatives typically did not matter one way or the other. The one exception was wind turbines, where narrow action inspired activists to demand even tougher government regulations. Overall, though, broad VEPs influenced the attitudes of environmental activists, whereas narrow VEPs did not.
Finally, the right side of Figure 4 presents the reactions of ordinary citizens.Footnote 25 On most issues, broad VEPs proved more potent than narrow VEPs in the eyes of the mass public. The main exception involved wind turbines, where broad VEPs failed to placate citizens and narrow but deep voluntary actions again backfired. Moreover, on nearly all issues, ordinary citizens perceived no significant difference between deep initiatives and shallow ones. In general, then, the main inferences we obtained when pooling the data also held when we analyzed each issue separately.
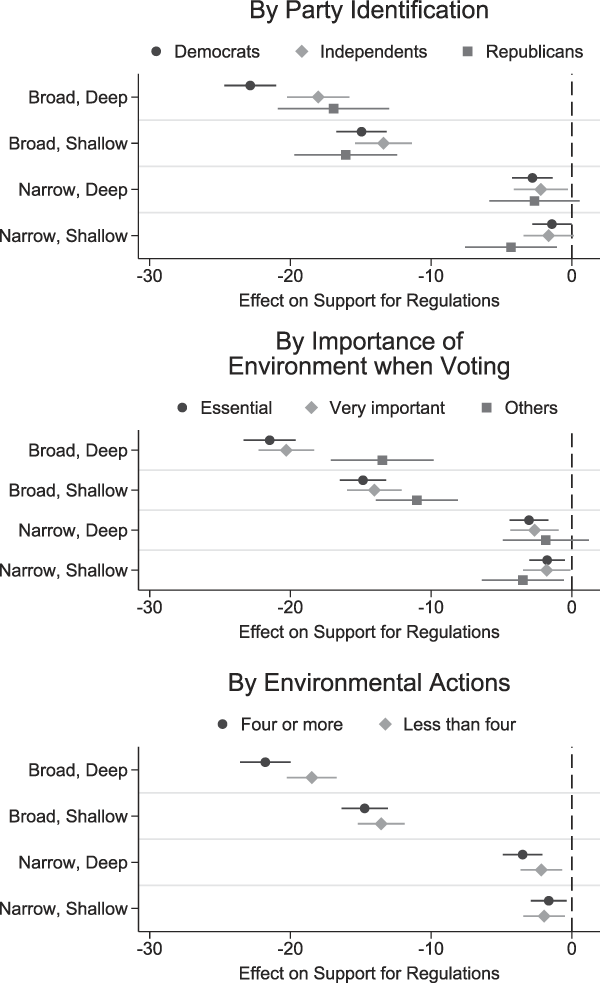
Having found that VEPs sapped support for regulation across a range of issues, we probed the behavior of political subgroups. To conserve space and maximize statistical power, we focus on Audubon affiliates, the largest of our samples.Footnote 26 First, we tested whether the reactions of environmental activists varied by political party affiliation. Second, we tested whether sensitivity to VEPs depended on whether respondents said that environmental issues were essential, very important, or not so important for their voting decisions. Finally, to condition on the respondent’s level of environmental activism, we distinguished people who had engaged in four or more environmental activities versus those who had completed fewer than four activities. With few exceptions, the effects of VEPs were similar across these subgroups (Figure 5). Moreover, to the extent that differences existed, VEPs were more effective at swaying respondents who prioritized the environment when voting or engaged in a relatively high number of environmental actions.
Effects of VEPs on Audubon Affiliates, by Political Subgroup

EFFECT OF VEPS ON GOVERNMENT OFFICIALS
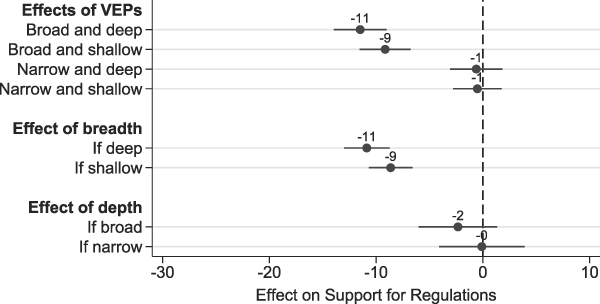
Having shown how VEPs affected the policy preferences of environmental activists and ordinary citizens, we now consider the responses of government officials. As Figure 6 shows, support for government regulations fell by 11 points in response to broad and deep VEPs, and by nine points in response to broad but shallow VEPs. It is noteworthy that shallow initiatives swayed even government officials. Thus, through minor measures, corporations could successfully alter the preferences of the political actors most directly responsible for crafting and implementing environmental policies. Overall, Figure 6 is similar to Figure 3, implying that government officials responded much like members of the mass public.
Effects of VEPs on Government Officials
Note: Effects are defined as changes in support for regulations, relative to a baseline score of 39 when no VEP was mentioned. The graph is based on 7,083 observations, distributed equally across six environmental issues. The Bonferroni method was used to adjust confidence intervals for multiple comparisons.

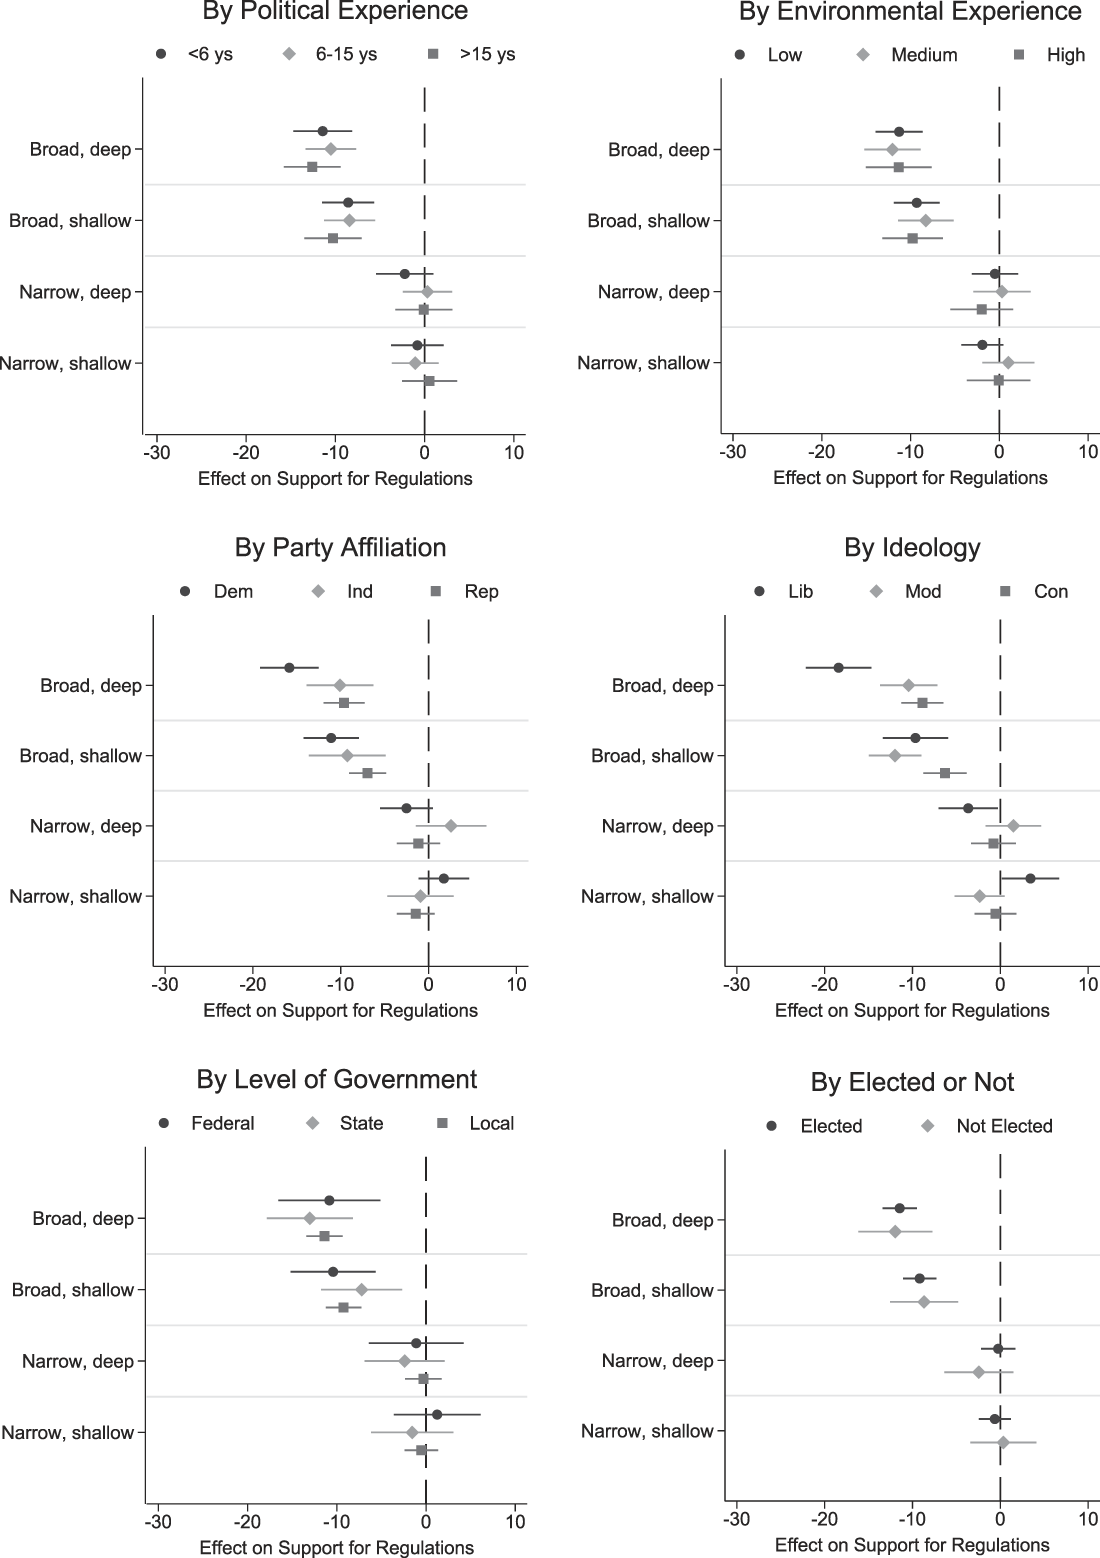
For additional insight, we disaggregated our sample of government officials by political subgroup (Figure 7). Reinforcing our findings from other samples, broad voluntary corporate initiatives reduced the desire for government regulations, regardless of the respondent’s political experience, environmental experience, party affiliation, ideology, level of government, and status as an elected versus appointed public official. The sole exception is that Democratic and liberal officials were especially susceptible to “broad and deep” VEPs. This pattern is consistent with Werner (Reference Werner2015), who found that the sociopolitical reputations of firms had a greater effect on access to Democratic politicians than on access to Republican politicians.Footnote 27
Effects of VEPs on Government Officials, by Political Subgroup

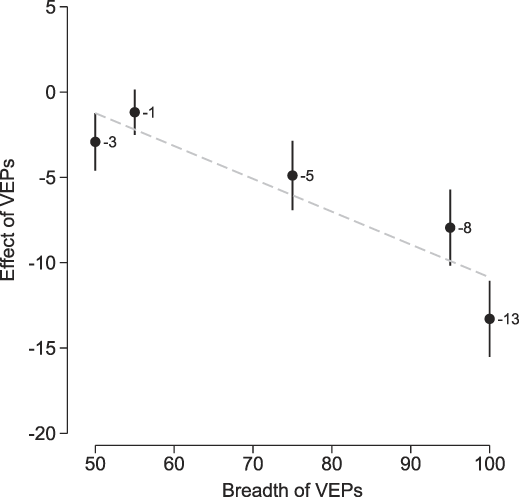
The experiments presented in this article compared two levels of breadth: 50% and 100% participation by firms in an industry. We found that programs with 50% participation had little effect on regulatory preferences, whereas programs with 100% participation greatly reduced support for regulation. These findings raise a question: how widespread must participation be in order for self-regulation to dampen support for government regulations? To find out, we conducted a follow-up experiment with a fresh sample of 608 government officials.
The follow-up experiment covered four environmental issues: bluefin tuna, car fuel efficiency, neonic insecticides, and plastic packaging. The design was similar to Figure 1, except we only included deep VEPs. On each issue, we measured support for regulations without mentioning voluntary programs. We then randomly assigned each person to consider two levels of breadth out of five possible treatment levels: 50% participation by firms (the “narrow” treatment in our previous studies); 55% participation (a little more than half); 75% participation (the midpoint between the two levels in the original study); 95% participation (nearly all firms participating); and 100% participation (the “broad” treatment in our previous studies).
Figure 8 shows that support for regulations declined as participation broadened, but the relationship exhibited some interesting nonlinearities. Full participation clearly had the largest effect on attitudes toward regulation, a 13-percentage point reduction in support relative to the baseline. This effect was statistically significantly lower than any other treatment condition, including the one where 95% of firms voluntarily regulated their behavior. Hence, it appears that government officials view full participation as the best substitute for public regulation. At the other extreme, we found no significant difference in preferences when 50% versus 55% of firms participated. Aside from the full participation condition, the effect of breadth appears to be generally linear; the effect of 75% participation (five percentage points) is roughly between the effects of the 55% and 95% conditions (one and eight percentage points, respectively).
Effects of VEPs on Government Officials, by Breadth of Participation
Note: Effects are defined as changes in support for regulations, relative to a baseline score of 45 when no VEP was mentioned. The graph is based on 4,863 observations, distributed equally across four environmental issues and five levels of breadth.

SUMMARY OF FINDINGS
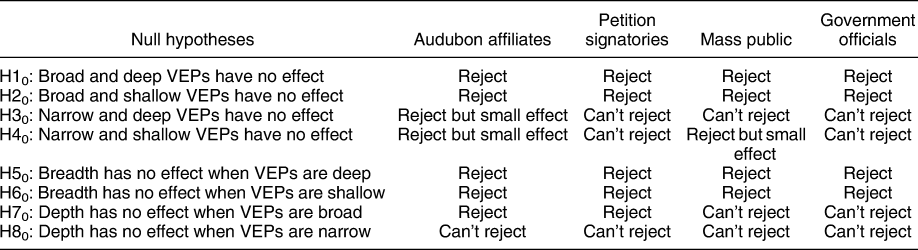
Table 5 summarizes our tests of the eight hypotheses from the section entitled “Experimental Design and Statistical Model.” The first four rows indicate that broad VEPs reduced support for government regulations, but narrow VEPs did little to change attitudes. Hence, in our experiments, breadth proved more important than depth.
Summary of Hypothesis Tests

The last four rows assess whether breadth and depth interacted. As rows five and six show, broad reforms were more potent than narrow reforms, regardless of whether VEPs were deep or shallow. The patterns in rows seven and eight were more mixed. When VEPs were broad, Audubon affiliates and petition signatories distinguished deep reforms from shallow ones, but ordinary citizens and government officials did not. When VEPs were narrow, all groups responded equivalently to deep and shallow reforms. Thus, with few exceptions, the results of our hypothesis tests were consistent across the stakeholder populations.
PREFERENCE AGGREGATION AND IMPLICATIONS FOR SOCIAL WELFARE
As noted earlier, regulatory policy is a product of a democratic process that aggregates the preferences of government officials, interest groups, and the mass public. Having conducted experiments on all three groups, we can now estimate how VEPs might affect the likelihood of government regulations, conditional on the power of each group.
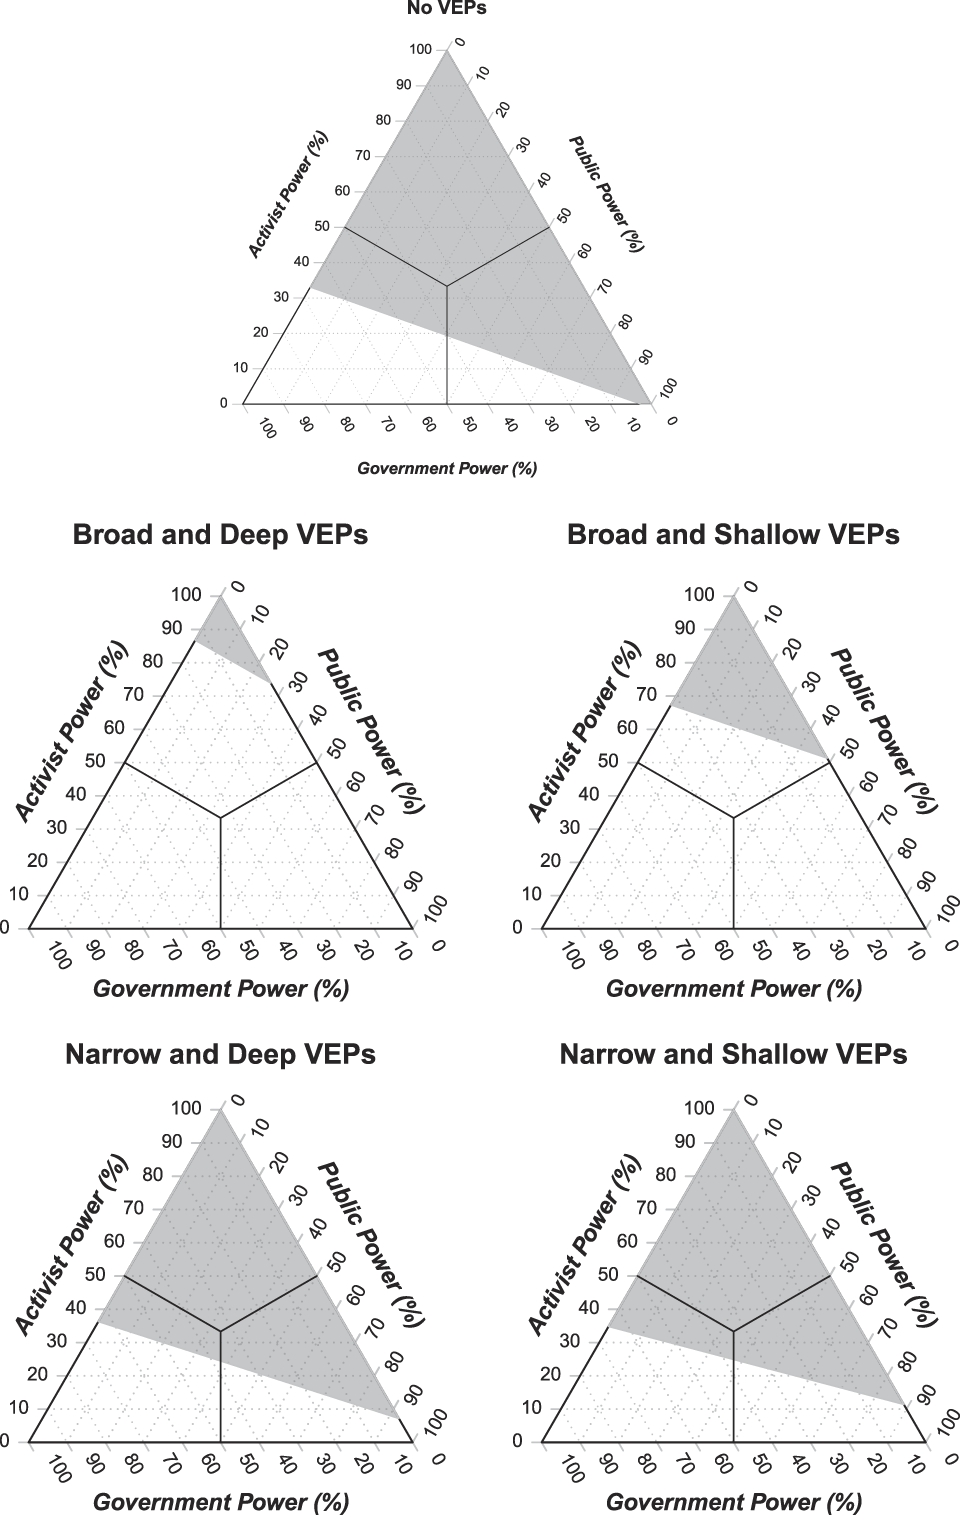
Let each group’s share of total power be a percentage from 0 to 100, with shares summing to 100. The equilateral triangles (ternary plots) in Figure 9 convey this idea graphically. Each point within a triangle represents a potential configuration of political power.Footnote 28 The solid Y-lines within each triangle divide the space into three equal regions, each with a different dominant group. Activists dominate in the top region, the public dominates in the lower right, and government officials dominate in the lower left. The center of the triangle, where the solid lines meet, represents a scenario in which each group has equal (33.3%) clout.
Support for Regulation, Conditional on VEPs and the Power of Key Groups

Based on data from our experiments, we shaded the regions in which weighted support for regulation was greater than 50 on the scale from 0 to 100. Mathematically, the shaded regions satisfy w as a + w ps p + w gs g > 50, where the weights w a, w p, and w g represent the proportions of political power wielded by activists, the public, and government officials, respectively, and the factors s a, s p, and s g represent the average support for regulation we observed within each group. Intuitively, the shaded regions represent configurations of political power for which the pro-regulatory forces outweigh the anti-regulatory ones.
The top triangle shows that, in the absence of VEPs, most configurations of power would give pro-regulatory forces the upper hand. Recall that baseline support for regulation was 72 out of 100 among environmental activists, 50 among the mass public, and 39 among government officials.Footnote 29 Given these values, nearly 68% of the triangle is shaded. Moreover, shading extends into all three regions, implying that regulations could emerge regardless of whether activists, the public, or government officials predominate.
The prospects for regulation shrink dramatically when corporations pursue broad and deep VEPs (second triangle). Less than 4% of the triangle is shaded. Moreover, support for regulation exceeds 50 only when environmental activists have at least 74% influence—and typically more than 85% influence—on policy.Footnote 30 Thus, through broad and deep VEPs, corporations can massively reduce the set of political scenarios in which pro-regulation forces outweigh anti-regulation ones.
The third triangle shows the prospects for regulation given broad but shallow VEPs. Shading covers only 16% of the triangle, far less than in the no-VEP condition. Furthermore, the shaded areas correspond to scenarios in which activist power exceeds 51% and typically stands above 72%. Thus, broad but shallow VEPs can make government regulations extremely unlikely. By comparison, narrow VEPs are relatively inconsequential (bottom row of triangles).
What implications do these findings have for social welfare? Assessing welfare is complicated; it requires knowing the benefits and costs of regulation for firms and consumers (see, e.g., discussions in Glachant Reference Glachant and Croci2005; Maxwell, Lyon, and Hackett Reference Maxwell, Lyon and Hackett2000; Denicolò Reference Denicolò2008). In the formal theoretic models, whether self-regulation is Pareto-improving depends on difficult-to-observe parameter values such as the negative externalities of dirty technologies and interest group lobbying expenditures. However, if one were solely concerned with protecting the environment, this article offers a pessimistic lesson: even shallow self-regulation can preempt far more stringent government regulations, provided that nearly all firms participate.
Finally, we found that activists, the public, and government officials differ in their baseline support for regulation and responsiveness to VEPs. This heterogeneity has implications not only for the efficacy of self-regulation but also for the design of political institutions. For instance, in our studies, activists distinguished deep VEPs from shallow ones, but ordinary citizens and government officials did not. This fact gives companies an incentive to adopt superficial, toothless reforms, especially when pandering to voters, politicians, and bureaucrats. Moreover, if even shallow VEPs can alter the preferences of ordinary citizens and government officials, neither direct democracy (i.e., ballot initiatives) nor bureaucratic insulation seems likely to maximize environmental protection.
CONCLUSIONS
The extant literature has mainly focused on how firms use lobbying as a strategy to secure desired policies. This article highlights a distinct source of corporate power in politics: private regulation. This study represents the first attempt to empirically examine how private regulation influences the policy attitudes of key stakeholders in the policymaking process: activists, ordinary citizens, and government officials.
Our experiments point to a clear conclusion: companies can reduce support for environmental regulations by voluntarily doing more than the status quo, but less than what people might demand in the absence of self-regulation. The findings in this article are remarkably robust. They recur across three distinct groups and six environmental issues, with little regard for the individual’s political affiliation, experience, or activism. Given concerns in the social sciences about replicability (Open Science Collaboration 2015), the consistency across several independent samples and datasets is reassuring.
Our experiments also clarified which types of VEPs were most consequential. Both activists and ordinary citizens were more favorably disposed toward broad VEPs than toward deep VEPs. Activists also perceived a difference between deep and shallow initiatives, but ordinary citizens did not. Moreover, even among activists, breadth was far more important than depth. These findings imply that industry-wide initiatives, including relatively shallow ones, may be highly efficient for corporations. Such initiatives could not only yield cooperative equilibria in which companies agree to compete on a level playing field but could also protect firms from pressure by activists and the mass public.
Our findings have important implications for corporate influence, government regulations, and environmental politics. The power of business goes beyond lobbying and is therefore larger than what much of the political science literature has previously appreciated. Moreover, unlike traditional modes of influence such as lobbying and campaign contributions, corporate self-regulation is less susceptible to reforms that might attempt to restrict such activities. Finally, self-regulation is a strategic option available primarily, if not exclusively, to corporations, heightening their power relative to competing interest groups.
There are several avenues to build upon the research here. At a basic level, further replication of these findings might reveal how the influence of corporate self-regulation changes over time. For instance, during periods of partisan gridlock or regulatory rollback, stakeholders might view even modest voluntary initiatives by corporations as major achievements. It would, therefore, be interesting to conduct similar studies in periods with different levels of gridlock or regulatory momentum.
We estimated the effects of deep versus shallow VEPs. However, even our shallow treatments represented at least some self-regulation on the part of firms. Future work should investigate the political consequences of “greenwashing,” in which firms portray themselves as environmentally progressive, when in reality they have not taken any meaningful steps to improve their environmental behavior. Similarly, firms often engage in charity work or activism outside their core domain (e.g., an oil company raising awareness for breast cancer). Might these types of corporate activities have spillovers on the environmental issues discussed in this article?
Future research could also further explore the power of breadth. We found that even modest action could suppress support for regulation, provided that nearly all firms participated. Subsequent studies could measure the breadth of voluntary initiatives and investigate why broad initiatives occur in some industries but not in others. For instance, firms in some industries might face a collective action problem in committing to shallow, industry-wide VEPs. Firms may have an incentive to defect from the cartel and engage in higher levels of self-regulation in order to present a positive image to consumers and potential employees. Whereas industry-wide VEPs are a shared resource in deflecting onerous regulations, firms can capture private benefits in the product and labor markets by branding themselves as “green” via stronger VEPs. Hence, perhaps there is heterogeneity by industry with broad but shallow VEPs more prevalent in industries that do not face ethically minded consumers and employees. Finally, scholars could also investigate other operationalizations of industry breath. We focused on the number of firms engaged in self-regulation, but one could also present the treatment information in terms of market share or the participation of a leading firm with a strong brand.
Subsequent studies could also examine the credibility of VEPs. In our experiments, respondents believed that VEPs were credible; we found strong effects for breadth, and sometimes observed effects for depth. However, future studies could vary the credibility of voluntary programs by, for example, presenting respondents with information from neutral third-party auditors.
Future work could also consider a wider range of dependent variables. In this article, we studied how VEPs affect policy preferences. It is reasonable to assume that, if voluntary corporate action decreases support for government regulations, it should also decrease the willingness of people to take costly political action to support that regulation (e.g., organizing, protesting, and writing elected representatives). Subsequent studies could directly test the effects of VEPs on mobilization and political engagement.
Research could also investigate the possibility of displacement. We found that, when companies took voluntary action on an environmental issue, respondents became less supportive of government regulation on that same issue. We did not examine whether those same respondents might therefore shift their attention elsewhere, by calling for stiffer regulations on other issues or another set of firms and industries. In future work, it would be instructive to learn whether VEPs displace mobilization to other issues, without dampening the overall level of mobilization.
Although this article, has focused on the environment, both the theoretical framework and empirical results may be applicable to other policy domains in which firms face the threat of government regulation. Private regulation could affect attitudes toward financial reform,Footnote 31 gun control, food safety, pharmaceuticals, and labor market policies such as the minimum wage, gender equality, and occupational health and safety. Given that the environment is a politically salient policy domain that is commonly thought of in the discussion of business regulation, it is possible that the effects of self-regulation may be even more pronounced in issue areas that are more obscure and where attitudes are less hardened. Finally, even our six environmental issues are not exhaustive of the domain; future studies could examine other environmental policies, especially those more directly related to climate change.
The logic should also extend to other countries. As the United States is characterized by robust democratic institutions and a strong media, the potential for corporate influence may be even greater in less-developed democracies. However, the power of self-regulation could potentially be weaker in European countries, where there is greater support for government regulation of business. By extending our research designs to other policy areas and geographies, we may gain a fuller understanding of the nature and limitations of corporate power.
SUPPLEMENTARY MATERIAL
To view supplementary material for this article, please visit https://doi.org/10.1017/S0003055418000679.
Replication materials can be found on Dataverse at: https://doi.org/10.7910/DVN/ARIQT2.





Comments
No Comments have been published for this article.