I. INTRODUCTION
Thermoelectric (TE) material is a functional semiconductor which could directly interconvert thermal energy to electrical energy with each other. TE devices are silent, reliable, and scalable, making them ideal for small, distributed power generation.Reference Snyder and Toberer1–Reference Li, Liu, Zhao and Zhou3 The efficiency of TE devices is determined by the dimensionless figure of merit (ZT), defined as ZT = α2T/ρκ, where α, ρ, T, and κ are Seebeck coefficient, electrical resistivity, absolute temperature, and thermal conductivity, respectively.Reference Stordeur and Rowe4 Bismuth telluride (Bi–Te)-based compounds show the best TE properties near room temperature. Although Te-based materials usually exhibit good TE properties and represent a dominant market share of TE materials, it is necessary to develop alternative materials to replace the rare and toxic tellurium. Bismuth sulfide (Bi2S3) as a layered semiconductor belongs to the same VI–VA group compound and has a direct band gap E g ≈1.3 eV. Because of its high electrical resistivity, which is two orders higher than that of Bi2Te3,Reference Zhao, Zhang, Liu, Zhang and Li8 a few attention has been paid to Bi2S3 in TE development. Recent attempts reveal the potential of the Bi2S3 as a promising TE material because of the high Seebeck coefficient and low thermal conductivity.Reference Chen, Uher, Iordanidis and Kanatzidis5–Reference Liufu, Chen, Yao and Wang7 Decreasing the electrical resistivity is still a priority to improve the TE property for Bi2S3 material.
Lots of efforts have been performed on decreasing electrical resistivity.Reference Mizoguchi, Hosono, Ueda and Kawazoe6, Reference Liufu, Chen, Yao and Wang7, Reference Ge, Zhang, Shang, Yu, Chen and Li9, Reference Zhao, Zhang, Liu, Zhang and Li10 Mizoguchi et al.Reference Mizoguchi, Hosono, Ueda and Kawazoe6 successfully reduced the electrical resistivity of Bi2S3 crystal whisker and bulk samples by vacuum annealing, which indicated that S defect could reduce electrical resistivity of Bi2S3. Liufu et al.Reference Liufu, Chen, Yao and Wang7 prepared the Bi2S3 self-assembly nanorod film with a low resistivity 2 × 10⁻⁴ Ω·m near the room temperature by using self-assembled monolayers in an aqueous solution. This result suggested that the highly crystalline and oriented nanostructures contribute to improving the electrical transport property of Bi2S3 film. In addition, Zhao et al.Reference Zhao, Zhang, Liu, Zhang and Li10 found that the electrical resistivity of Bi2S3 bulk could be decreased not only by fabricating nonstoichiometry sample but also by texturing using a hot-forging method. In our previous work,Reference Ge, Zhang, Shang, Yu, Chen and Li9 it was found that the mechanical alloying (MA) process could affect the real S contents in Bi2S3 bulk, which was condensed by spark plasma sintering (SPS), and reduce the electrical resistivity of sample. The electrical resistivity of Bi2S3 bulk sintered even under an optional SPS process using the powders MA-treated at 350 rpm for 15 h was 2.45 × 10⁻² Ω·m at room temperature, which is one order higher than the sample (1.1 × 10⁻³ Ω·m) prepared by using the powders MA-treated at 425 rpm for 20 h. SPS has to be a more important process rather than MA for fabricating Bi2S3 sample; the sintering temperature is considered to affect inevitably the real S contents and electrical transport properties of the bulk sample. In this study, the influences of the SPS temperature on the microstructure and the electrical transport properties of Bi2S3 bulk were focused. The highest ZT value (0.22) reported so far in the bulk Bi2S3 system has been achieved after optimizing the SPS temperature.
II. EXPERIMENTAL PROCEDURE
Commercial high-purity powders of 99.9% Bi and 99.9% S under the same 200 mesh were used as raw materials. The powders with a chemical composition of Bi2S3 were synthesized by applying MA under an optimized processReference Ge, Zhang, Shang, Yu, Chen and Li9 in which the powders were first ball-milled under 425 rpm for 20 h in a mixture gas atmosphere of argon (95%) and hydrogen (5%) using a planetary ball mill (QM-1SP2, Nanjing University, Nanjing, China), and then milled under 300 rpm for 30 min in an alcohol liquid. Here, stainless steel vessel and balls were used, and the weight ratio of the ball to powder was kept at 20:1. The MA-treated powders were loaded into a graphite die with an inner diameter of 20 mm and then sintered at 673 to 823 K for 5 min under an axial compressive stress of 40 MPa in vacuum by using an SPS system (Sumitomo SPS1050, Tokyo, Japan). A disk-shaped sample with a dimension 20 mm × 4 mm was formed after SPS.
The thermogravimetry–differential thermal analysis (TG-DTA) was performed using a differential thermal analyzer (HCT-1, Beijing, China) in Ar atmosphere. The phase structure was analyzed by x-ray diffraction (XRD; BrukerD8, BRUKER AXS, Karlsruhe, Germany) with a Cu Kα radiation. The component of bulk sample was analyzed by x-ray fluorescence (XRF; XRF-1800, SHIMADZU, Kyoto, Japan). The morphologies of the fracture of bulk samples were observed by a field emission scanning electron microscopy (FESEM; SUPRA 55, Carl Zeiss, Nakano, Japan). The electrical transport properties were evaluated along the sample section perpendicular to the pressing direction of SPS. The Seebeck coefficient and electrical resistivity were measured at 323–573 K in a helium atmosphere using a Seebeck coefficient/electric resistance measuring system (ZEM-2; Ulvac-Riko, Kanagawa, Japan). The density (d) of the sample was measured by the Archimedes method. A sample along the section parallel to the pressing direction of SPS was used to evaluate the thermal conductivity k because of the limited sample size. The thermal conductivity k was calculated by the relationship of k = DCpd, in which the thermal diffusivity D was measured by the laser flash method (LFA427; NETZSCH, Selb, Germany), the specific heat Cp measured by using the thermal analyzing apparatus (Dupont 1090B, Dupont, Fayetteville, NC) is from 0.2 to 0.24 between room temperature and 573 K, and the density d was obtained by the Archimedes method.
III. RESULTS
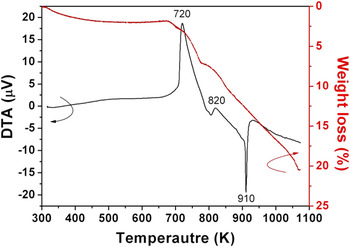
Figure 1 shows the DTA and TG curves of Bi2S3 powders obtained by applying MA at an optimized process parameter.Reference Ge, Zhang, Shang, Yu, Chen and Li9 About 2–3% weight loss due to the decomposition of some organic matter was detected below 680 K, which corresponds to a weak and broad exothermic peak around 500 K. A severe weight loss occurred initially at 700 K and increases continuously with rising temperature to about 1000 K, whose weight loss reached about 20% at 1000 K. Accompanying with the severe weight loss at 700–1000 K, two exothermic peaks and one endothermic peak appear in the DTA curve at about 720, 820, and 910 K, respectively. The first exothermic peak (720 K) may be attributed to S element breaking away from Bi2S3 lattice and the second one at about 820 K is considered to be caused by Bi element breaking away from Bi2S3 lattice. The trace of thermal decomposition can be found in their XRD patterns, which will be discussed in Fig. 2. The big endothermic peak at about 910 K means that this temperature reached the melting point of Bi2S3 powders, although the theoretical melting point of Bi2S3 is 1036 K.Reference Grigas, Talik and Lazauskas11 The lowered melting point of the Bi2S3 powder may be due to the activated state with small sizes (∼100 nm) and the more crystal defect.
Differential thermal analysis (black lines) and thermogravimetric analysis (red lines) curves of Bi2S3 powders.

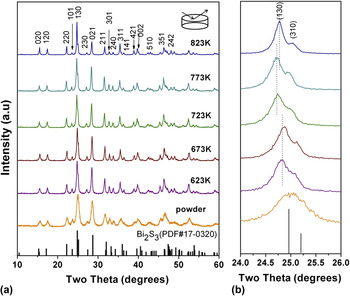
X-ray diffraction patterns in 2θ range from (a) 10°–60° and (b) 24°–26° for the Bi2S3 powder obtained by applying mechanical alloying (MA) at 425 rpm for 20 h and the Bi2S3 bulks obtained by applying spark plasma sintering (SPS) at 623–823 K for 5 min.

Figure 2 shows XRD patterns in the 2θ range from 10°–60° (a) and 24°–26° (b) for the Bi2S3 powder obtained by applying MA at 425 rpm for 20 h and the bulks obtained by applying SPS at 623–823 K for 5 min. All the diffraction peaks in Fig. 2(a) for all samples correspond well to those of Bi2S3 (PDF No. 17-0320), which suggests that a single Bi2S3 phase with orthorhombic symmetry was synthesized during the investigated MA and/or SPS process. The diffraction peaks of all the bulk samples are sharper than those of the powder sample which is attributed to the enhanced crystallinity by SPS. The intensity of peaks (230), (310), and (240) weakened slightly with raising sintering temperature from 723 to 823 K, which reveals the variation of microstructure and/or texture. However, no obvious texturing evidence exists in the XRD patterns of bulk sample as compared with the powder sample.
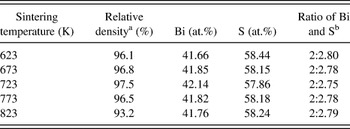
Figure 2(b) highlights the XRD pattern of the diffraction peaks in the 2θ ranges of 24°–26°. Although there are two diffraction lines (130) and (310) corresponding to 24.93° and 25.21° in the standard card (PDF No. 17-0320), only one broad diffraction peak is observed in the powder sample. The barely distinguished (130) and (310) peaks in the XRD measurements of the powders are due to the small grain size.Reference Ge, Zhang, Shang, Yu, Chen and Li9 After sintering the powder sample at 623 and 673 K, the 2θ angle of (130) peak shifts to about 24.72°. When the SPS was performed at 723 and 773 K, the 2θ angle of (130) peak further decreases to the angle 24.68°. The peak shift to the low diffraction angles indicates the enlargement of the Bi2S3 lattice which is due to the volatilization of S as discussed in Fig. 1. When the SPS was performed at 823 K, the 2θ angle of (130) peak returns to 24.71°, which may ascribe to the volatilization of Bi. This result reveals that the remnant Bi and S will reduce to close the stoichiometric ratio and the enlarged lattice of the Bi2S3 tends to recovery when the sintering temperature is excess 820 K. To validate above conclusion, the component of bulk sample was analyzed by XRF and listed in Table I. The ratio of Bi to S is 2:2.80, 2:2.78, 2:2.75, 2:2.78, and 2:2.79 for the samples sintered at 623, 673, 723, 773, and 823 K, respectively. It indicates that the S is inadequate in all the samples, which is consistent well with the shift trend of the diffraction peak to the low diffraction angles (Fig. 2). The deficient extent of S increases with raising the sintering temperature from 673 to 723 K but alleviated by further raising the sintering temperature above 773 K. The alleviation of the S lacks is attributed to the volatilization of Bi, as discussed in Fig. 1. Finally, the ratio of Bi to S approaches the stoichiometric ratio again for the sample sintered at 823 K.
Relative density and at.% of Bi and S elements for the bulk sample sintered at different temperatures.

a The theory density of Bi2S3 is 6.81 gm−3.
b The standard ratio of Bi and S in Bi2S3 is 2:3.
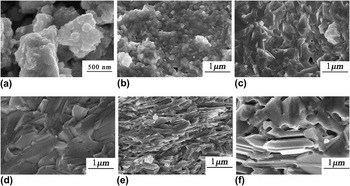
Figure 3 shows FESEM micrographs for the Bi2S3 powder obtained by applying MA at 425 rpm for 20 h (a) and the Bi2S3 bulks obtained by applying SPS for 5 min at 623–823 K [(b)–(f)]. The Bi2S3 powders are fine with particle sizes in less than 100 nm [Fig. 3(a)]. After sintering at 623 K, the bulk sample has a dense microstructure with a relative density 96.1%, and grain sizes grow to about 200–300 nm [Fig. 3(b)]. As the SPS temperature increases to 673 and 723 K, the relative density of samples reaches 96.8 and 97.5%, respectively. Meanwhile, the circular grain sizes become flat and lamellar, indicating the formation of a texture feature [Fig. 3(d)]. The textured structure may be caused by the rupturing of the weak bonds (van der Waals force in a and b axes) at high temperature and high pressure (40 MPa).Reference Zhao, Zhang, Liu, Zhang and Li10 However, the texture degree is limited according to the XRD patterns in Fig. 2 (a), in which there is no obvious difference in the XRD patterns for bulk samples and powder sample except full width at half maximum, and the powders were usually considered no texture. On the other hand, the large amounts of pores are observed in Figs. 3(e) and 3(d), and the relative density of the Bi2S3 bulks obtained by applying SPS at 773 and 823 K was down to 96.5 and 93.2%. The decreased density is attributed to the volatilization of S and Bi, which is caused by applying SPS at a high temperature as discussed in Figs. 1 and 2.
Field emission scanning electron micrographs of the Bi2S3 powder obtained by applying MA at (a) 425 rpm for 20 h and the Bi2S3 bulks obtained by applying SPS for 5 min at (b) 623, (c) 673, (d) 723, (e) 773, and (f) 823 K.

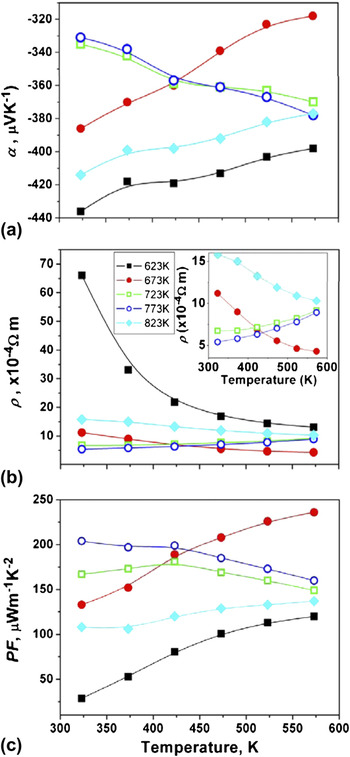
Figure 4 shows the temperature dependence of electrical transport properties for Bi2S3 bulks obtained by applying SPS for 5 min at 623–823 K. Figure 4(a) shows the variations of Seebeck coefficient (α) as a function of measurement temperature for Bi2S3 bulks. The negative value of α indicates that all the samples are n-type and the major carrier is the electron. The absolute value of Seebeck coefficient (|α|) for the bulk samples obtained by applying SPS at 623,673, and 823 K decreases with increasing measurement temperature, and others sintered at 723 and 773 K show an inverse trend, which will be discussed later. The α for the bulk sample obtained by applying SPS at 623 K has the highest values of about −440 to −400 μV K−1 at 323–573 K. As the sintering temperature rises from 623 to 773 K, the α value at room temperature decreases to the lowest value (−330 μV K−1).
Temperature dependence of (a) Seebeck coefficient, (b) electrical resistivity, and (c) power factor for the Bi2S3 bulks obtained by applying SPS at 623–823 K for 5 min.

The electrical resistivity (ρ) at room temperature [Fig. 4(b)] for the sample sintered at 623 K is about 65 × 10−4 Ω·m and decreases to about 5 × 10⁻⁴ Ω·m with increasing SPS temperature to 773 K. This is the lowest ρ at room temperature which is attributed to the increased relative density and the spontaneously textured microstructure. Because of the large amount of pores [Fig. 3(f)], the ρ at room temperature inversely increases to 15 × 10−4 Ω·m for the sample sintered at 823 K. Similar to the change on the temperature dependence of the Seebeck coefficient, the ρ for the bulk samples obtained by applying SPS at 623,673, and 823 K decreases with increasing measurement temperature, and others sintered at 723 and 773 K show an inverse trend, as shown in Fig. 4(b) and in the inset. The reason related to the conducting behavior from semiconductor to metal and to semiconductor again with SPS temperature would be discussed later.
Figure 4(c) shows the corresponding power factor (PF) as a function of measuring temperature for the bulk samples. The PF of the Bi2S3 samples obtained by applying SPS for 5 min at 623, 673, and 823 K increases, whereas that of the samples for 5 min at 723 and 773 K decreases slightly with raising measurement temperature. As the sintering process was performed at 773 K for 5 min, the bulk has the highest PF of 205 μW m−1 K−2 at room temperature. The PF reaches 236 μW m−1 K−2 at 573 K for the sample obtained by applying SPS at 673 K for 5 min, which is about twice larger than the sample obtained by sintering at 623 K for 5 min. (110 μW m−1 K−2). The highest PF value 236 μW m−1 K−2 is equivalent to our previous report,Reference Ge, Zhang, Shang, Yu, Chen and Li9 which is devoting to enhance the TE properties of Bi2S3 bulk by optimizing the ball-milling process.
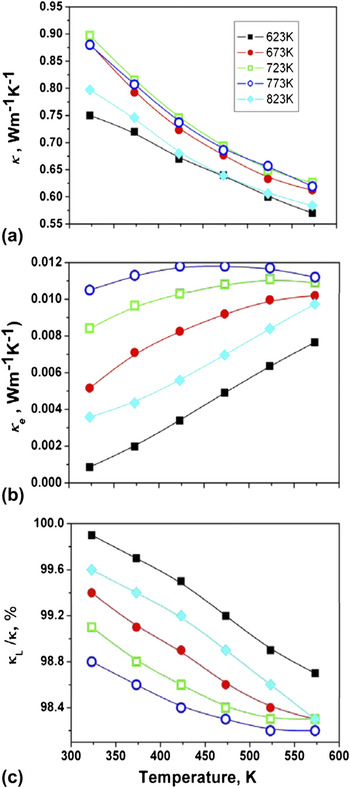
Figure 5(a) shows the temperature dependence of total thermal conductivity (κ) for the Bi2S3 bulks obtained by applying SPS for 5 min at 623–823 K. The κ for all the samples show the same decreasing trend with increasing measurement temperature, which is ascribed to the strong phonon scattering at high measurement temperature. The κ of the sample obtained by applying SPS at 623 K is the lowest, which ranges from 0.56 to 0.74 W m−1 K−1 in the whole measuring temperature range. The κ increases with increasing sintering temperature from 623 to 723 K. Even though it possesses the lower ρ, the κ for the sample obtained by applying SPS at 773 K is lower than that for the sample obtained by applying SPS at 723 K, which attributed to the textured structure. The κ of sample obtained by applying SPS at 823 K is just 0.58 W m−1 K−1 at 573 K because of the low relative density and the porous microstructure which would perform as good thermal barriers.
Temperature dependence of (a) total thermal conductivity, (b) carrier thermal conductivity, and (c) ratio of lattice thermal conductivity and total thermal conductivity for the Bi2S3 bulks obtained by applying SPS at 623–823 K for 5 min.

The corresponding carrier thermal conductivity (ke) as a function of measuring temperature for the bulk samples is shown in Fig. 5(b). The ke values for all the bulk samples are very low being lower than 0.012 W m−1 K−1 and relate to the change of electrical resistivity. The ke increases with increasing measurement temperature for the samples sintered at 623, 673, and 823 K, but increases, first, and then decreases for the samples sintered at 723 and 773 K. Figure 5(c) shows temperature dependence of κ l/κ ratio. κ l/κ ratio for all samples decreases with increasing temperature, which is ascribed to the strong phonon scattering. The proportion of κ l to κ for Bi2S3 sintered at 623 K is nearly 100% at 373 K and decreases to about 98.7% at 573 K, which indicates that lattice thermal conductivity plays the key role in the total thermal conductivity for Bi2S3. Raising sintering temperature leads to the initial decrease and later increase in the κ l/κ ratio, whereas a minimum value is attained for the sample sintered at 773 K.
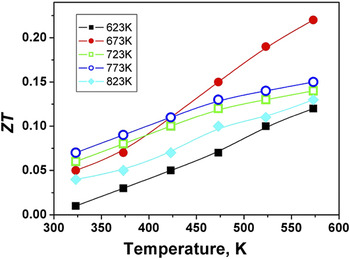
Figure 6 shows the dimensionless ZT as a function of measurement temperature for the Bi2S3 bulks obtained by applying SPS for 5 min at 623–823 K. The ZT values for all the samples increase with raising measurement temperature. The maximum ZT value is 0.22 at 573 K for the Bi2S3 sample obtained by applying SPS at 673 K, which is the highest value reported so far.Reference Zhao, Zhang, Liu, Zhang and Li10
Temperature dependence of figure of merit values for the Bi2S3 bulks obtained by applying SPS at 623–823 K for 5 min.

IV. DISCUSSIONS
As shown in Figs. 2 and 3, the component, grain size, texture degree, and relative density of Bi2S3 bulk samples are obviously sensitive to the SPS temperature, which all affect their electrical transport properties. The electrical transport properties, including resistivity and Seebeck coefficient, are expressed by the following two base equations:


where ρ, μ, n, e, α, k, r, and N 0 are electrical resistivity, carrier mobility, carrier concentration, charge electron, Seebeck coefficient, Boltzmann’s constant, scattering factor, and Avogadro constant, respectively. The electrical resistivity is inversely proportional to carrier mobility and carrier concentration (n), whereas the Seebeck coefficient (α) is proportional to scattering factor (r) and inversely proportional to carrier concentration.Reference Zhao, Zhang, Liu, Zhang and Li13 The total thermal conductivity κ is the sum of lattice and carrier contributions according to the Wiedemann–Franz law.
When the SPS was performed at a low-temperature range (623–723 K), the relative density increased from 96.1 to 97.5% with raising sintering temperature. The increasing of relative density contributes to the decrement of r and the increment of μ resulting in the decrease of ρ, even though the defects born in MA process eliminated slightly in the SPS process. Zhao et al. confirmed that the n reduced from 6.9 × 10¹⁹ to 0.6 × 1019 cm-3, and μ raised from 76 to 1180 cm2/Vs with increasing the SPS temperature from 623 to 723 K in Bi2Te3 bulk samples.Reference Grigas, Talik and Lazauskas11 The reduced n is attributed to that the SPS at a low-temperature range (623–723 K) plays an annealing role in eliminating the defects born in MA process and can participate in the conduction process. Because the degree of the reduced n is weaker than those of increased μ and decreased r, the former leads to the decrease of ρ and the latter results in the decrease of |α|. Therefore, the both ρ and |α| decrease as shown in Figs. 4 (b) and 4 (a) with raising SPS temperature from 623 to 723 K.
When the sintering temperature increases to 773 K, the sample showed a little textured microstructure with the grown grains (about 1 μm) and the high relative density (96.5%), which all improve μ and reduce r, and result in the decrements of both ρ and |α|. Zhao et al.Reference Zhao, Zhang, Liu, Zhang and Li10 found that μ in the Bi2S3 bulk materials improved from 265 to 500 cm2/Vs after texturing by hot forging. On the other hand, S element begins to volatilize over 723 K as indicated in Figs. 1 and 2, which would enhance n. It was reported previously that the n increased from 0.05 × 10¹⁸ for Bi2S3 to 4.17 × 1018 cm−3 for Bi2S2.9 by producing S defect.Reference Zhao, Zhang, Liu, Zhang and Li10 Therefore, the greatly enhanced n and μ contribute to the decrement of ρ and to the transition of conductive behavior from semiconductor to metal [Fig. 4(b)]. At the high measuring temperature, the ρ and |α| increase with raising measurement temperature because of the strong lattice thermal vibration.
When the SPS temperature rose to 823 K, the sample showed an obviously porous structure with the grown grains (1–2 μm) and a reduced relative density (93.2%). Serious volatilization of Bi and S produced lots of pores in bulk and made the component of sample close to the stoichiometric ratio (Table I), in which skewing degree of the XRD diffraction peak also decreases. The decreased nonstoichiometric ratio should reduce n and change the conductive behavior of sample to semiconductor again. Although the larger grain size and the textured microstructure contribute to increase μ and to decrease r, lots of pore in bulk causes the prominent decrement of μ and r, which leads to decrease of ρ and α. The highest PF is 236 μW m−1 K−2 for the sample sintered at 673 K due to the good electrical transport properties.
The total thermal conductivity κ is the sum of lattice and carrier contributions in which they were estimated according to the Wiedemann–Franz law as follows:


where κ lattice, κ carrier, σ, and L are the lattice thermal conductivity, carrier thermal conductivity, electrical conductivity, and Lorenz number,Reference Fine and Hsieh14 respectively.
The thermal conductivity of all the samples decreases with increasing measurement temperature, which indicates that the lattice thermal conductivity plays a dominant role. The increased n or/and μ contributes to the increment of the carrier thermal conductivity,Reference Zhao, Zhang, Liu, Zhang and Li10, Reference Shaban, Nassary and El-Sadek12, Reference Zhao, Zhang, Liu, Zhang and Li13 whereby the thermal conductivity decreases with the increasing sintering temperature from 623 to 673 K. The sample sintered at 773 K has the lower electrical resistivity [Fig. 4(b)] and the lower thermal conductivity compared with the sample sintered at 723 K due to the textured microstructure and lower relative density [Fig. 3(e)]. The texture degree of the (hk0) planes, termed as F (hk0), was calculated with the Lotgering method using the following equationsReference Kobayshi, Ogawa, Miyazawa and Kuwabara15:


where P and P 0 are the ratios of the integrated intensities of all (hk0) crystal planes to those of all (hkl) planes for preferentially and randomly oriented samples, respectively. The value of F for Bi2S3 sample sintered at 773 and 823 K is about 0.18 and 0.2, respectively, which means a slightly oriented texture. Therefore, the real value of thermal conductivity in the direction perpendicular to pressure direction for the samples sintered at 773 and 823 K may be a little higher than the measured value in the direction parallel to the pressure direction. The real ZT value of the samples sintered at 773 and 823 K may be a little lower than that shown in Fig. 6 since the little higher k obtained from the sample along the section parallel to the pressing direction of SPS was used to calculate ZT value. Nevertheless, the highest ZT value 0.25 is obtained from the sample sintered at 673 K that did not show any texture feature. The thermal conductivity of the sample sintered at 823 K decreases greatly originated from its low relative density and porous microstructure. The highest ZT value (0.22) is achieved at 573 K by optimizing SPS temperature at 673 K for 5 min, which is the maximum value reported so far in bulk Bi2S3 system.
V. CONCLUSIONS
n-Type Bi2S3 polycrystals with a high density (>90%) were synthesized by combining MA and SPS techniques. The component (Bi/S ratio), grain size, texture degree, and relative density of Bi2S3 bulk samples are sensitive to the SPS temperature, which all affect the electrical transport properties of samples. Raising SPS temperature results in the grain growth, densification, and spontaneous texturing, whereas the overheating results in the severe volatilization of both S and Bi and forming a porous microstructure. Although all the samples are lack in S when compared to the stoichiometric ratio of Bi to S (2:3), the S deficient extent increases with raising sintering temperature from 673 to 723 K and alleviated by further raising the sintering temperature above 773 K owing to the different volatilization behaviors of S and Bi. The samples sintered at 623, 673, and 823 K are semiconductors, but the others sintered at 723 and 773 K show a metal-like conductivity. The highest ZT value is 0.22 at 573 K for the sample obtained by applying SPS at 673 K for 5 min, which is the maximum value reported so far in bulk Bi2S3 system.
ACKNOWLEDGMENTS
This work was supported by National Natural Science Foundation of China (Grant No. 50972012), High-Tech 863 Program of China (Grant No. 2009AA03Z216), National Basic Research Program of China (Grant No. 2007CB607500), and Beijing Natural Science Foundation (Grant No. 2112028).