Implications
The feed efficiency of production process is a key aspect of livestock farming systems. Herd efficiency results from each female’s lifetime efficiency. As assessing lifetime efficiency on farms remains difficult, modelling approaches offer an interesting alternative to further understand the effects of management on individual efficiencies. Based on a dairy goat herd model, this study found that different management options led to similar efficiencies at the herd level but were based on various individual efficiencies. Understanding these differences in the underlying biological processes contributes to a sound assessment of herd management. It opens perspectives to design innovative management directed towards sustainable livestock farming systems.
Introduction
Analysing the variability of individual lifetime performance within a herd represents a powerful tool for assessing management practices. On the one hand, the lifetime performance aspect permits the consequences of environmental pressures and the aptitude of individuals to adapt, to be evaluated in the long term. On the other hand, the individual variability aspect is a key to being able to extend predictions from the level of the individual to the level of the performance of the herd. Furthermore, understanding the biological basis for individual variability is central to understand the capability of the system to adapt to a fluctuating environment. The interest in analysing the variability of lifetime performance for the assessment and design of innovative management has already been highlighted by numerous authors (e.g. Landais, Reference Landais1987; Gibon, Reference Gibon1994). For instance, complementarity in the reproductive trajectories of two species in a mixed herd reinforces herd viability in a demanding and fluctuating environment (Tichit et al., Reference Tichit, Hubert, Doyen and Genin2004). Lifetime performance is frequently defined using indicators such as production level, kidding-to-kidding intervals and/or the number of participations in mating sessions (Lasseur and Landais, Reference Lasseur and Landais1992; Cournut and Dedieu, Reference Cournut and Dedieu2004). Only the approach developed by Coulon et al. (Reference Coulon, Lescourret, Faye, Landais, Troccon and Perochon1993 and Reference Coulon, Perochon and Lescourret1995) introduced indicators of the biological functioning of animals (body weight (BW), pathologies) but without analysing the relationship of those indicators with management practices. Indicators linked to production process efficiency have, thus, been largely ignored in works on lifetime performances. Still, production process efficiency is an essential component in herd performance (Vandehaar, Reference Vandehaar1998) and the lifetime performance is a relevant level of analysis of individual efficiency (Peyraud et al., Reference Peyraud, Le Gall, Delaby, Faverdin, Brunschwig and Caillaud2009).
Seeking feed efficiency (i.e. the ratio between the amount of feed consumed and the amount of products) is a key for assessing and designing autonomous and economic feeding systems. There are several options for improving individual efficiency. They rely on the principle of diluting fixed production costs, that is maintenance requirements, by improving the level of production either through genetic progress or the level of concentrate feedstuff supply (Vandehaar, Reference Vandehaar1998) or through a reduction in the number of unproductive days (Lormore and Galligan, Reference Lormore and Galligan2001). To our knowledge, no works have been published comparing the effect of these different options on the variability of individual responses by integrating the notion of efficiency over the long term.
The goal of this article is to enrich management practice assessment by (i) integrating criteria linked to the feed efficiency of production process into the lifetime performance description and (ii) comparing the effects on lifetime performance variability of feeding and reproduction management along with the production potential of the herd. We sought to identify whether the various management options solicit the same biological bases. Assessing the effects of management practices was based on the use of Simulation of Goat Herd Management (SIGHMA). It is an individual-based herd model developed within the context of intensive dairy goat systems in the west of France (Puillet et al., Reference Puillet, Martin, Sauvant and Tichit2010). The first part of the article briefly describes the model and its use within the framework of three virtual experiments. The second part presents the simulated performance at both the herd level and the level of individual lifetimes. The interest of incorporating new lifetime performance criteria for assessing and analysing the effects of management practices at the different levels of herd organisation are discussed in the third part.
Material and methods
Model overview
The effects of management practices on both herd and individual performance were simulated using the SIGHMA model (Puillet et al., Reference Puillet, Martin, Sauvant and Tichit2010). This herd simulator combines two sub-models, namely decisional and biotechnical.
The decisional sub-model accounts for the decision-making process of the farmer. It represents the translation of a production project into technical operations on animals. The first step of the decision-making process is structuring the herd into functional groups. The functional group is defined as being a renewed group of females all managed by the same set of technical decision rules. The functional groups formalise the management units of the farmer, thus structuring his technical reasoning. They make it possible to assure the overall consistency of the different technical operations, which aim at running the farmer’s project. The second step of the decision-making process is the management of functional groups through time. From a dynamics point of view, functional group operating is based on elementary management patterns. An elementary management pattern is the minimal sequence of technical operations that organises a female production pattern in a functional group. It translates the planning and the chronological execution of technical operations in a functional group at the scale of one productive year. The technical operations are represented with discrete events. Such events incorporate the decision and action rules at the level of the biotechnical sub-model. They enable the representation of the farmer’s strategy concerning reproduction and feeding. The feeding strategy corresponds to the combination of a number of feeding steps chronologically organised within the feeding sequence. Each step is defined by temporal bounds and by a reference animal (Guérin and Bellon, Reference Guérin and Bellon1990). The concept of the reference animal is used to reflect the fact that a farmer decides a given level of feed for a group by considering an average animal in that group, that is, the reference animal. The reference animal is defined in terms of production potential, that is, the milk production (in kg/day) at the peak of the third lactation. The requirements to meet this production define the amount of feed distributed to the functional group. The reference animal is an input parameter of the model, which determines the level of concentrate feedstuff distributed to the functional group. For example, a reference goat set at 4 kg of production potential corresponds to roughly 255 kg of concentrate over 10 months of lactation and a reference goat set at 5 kg corresponds to roughly 310 kg of concentrate. Modulating the level of the reference animal in relation to the average production potential of the group makes it possible to vary the proportion of individuals in the group which are fed to meet their requirements.
The biotechnical sub-model comprises a set of individual goat models. Each model simulates the biological dynamics of BW and milk production of an individual from birth to exit from the herd (Puillet et al., Reference Puillet, Martin, Tichit and Sauvant2008). These dynamics are determined by two genetic scaling parameters (the milk production potential and the BW at maturity). They are also influenced by the relative priorities among physiological functions (i.e. energy allocation to growth, gestation, lactation and body reserve) and the responses to diet energy according to the feeding and reproduction practices. Responses to variations in supplied energy are based on response laws proposed by the INRA (Sauvant et al., Reference Sauvant, Giger-Reverdin and Meschy2007) and on the dynamic allocation of energy among physiological functions. A key concept of the dairy goat model is to consider that the production potential (BW at maturity and milk production potential) and the relative priorities among physiological functions define a reference pattern of performance (BW and milk production). This pattern corresponds to a situation where the production potential of a goat is fully expressed. Responses to the diet energy induce deviations from this reference pattern, which generate the obtained pattern of performance.
In the goat model, there is no feedback between body reserves and reproduction. The fertilisation of a goat is a random event only determined by management. This assumption was motivated by the lack of data enabling the determination of statistical relations between weight variables and reproduction and also by the need to progressively take over the complexity of herd model outputs.
The decisional sub-model interacts with the biotechnical sub-model through the feeding strategy, which determines the quantity and quality of feed distributed, the reproductive strategy that determines the rhythm of individual cycles and the replacement strategy that determines the length of time the individual remains in the herd. The biotechnical sub-model produces the information that is necessary for the technical operations in the decisional sub-model. This information can be taken at the level of either the group or the individual. The variability of individual biological cycles is thus generated by the independent functioning of each goat model in the space of management events targeting the different levels of herd organisation.
The herd model simulates a 20-year period. Owing to the stochastic processes (production potential assignment at birth, reproduction and mortality), it requires 15 replications per simulation to reduce variance and stabilise the mean of simulated outputs (Coquillard and Hill, Reference Coquillard and Hill1997). Simulated outputs include variables aggregated at the herd scale (milk production, consumption of various feedstuffs and total numbers of goats), as well as variables characterising the lifetime performance of each individual in the herd.
Using the model for three virtual experiments
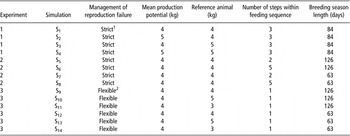
Three virtual experiments were used to test the efficiency of different management options on a herd of 300 does mated during the natural breeding season. Information on the parameterisation of the experiments is given in Table 1. The goal of the first virtual experiment was to generate different gaps between the diet energy level and the level of requirements. This experiment tested two levels of mean herd production potential (L: 4 kg and H: 5 kg) along with two levels of reference animal (L: 4 kg and H: 5 kg). The different treatment modalities are numbered S1 (L–L), S2 (H–L), S3 (L–H) and S4 (H–H). The goal of the second virtual experiment was to produce a difference between the temporal evolution of requirements generated by the length of breeding season (physiological states staggering) and the temporal evolution of feed supplies generated by the segmentation of the feeding plan. This second experiment tested two levels of breeding season length (H: 126 days, L: 63 days) and two levels of feeding plan segmentation (H: five step sequence, L: two step sequence) for a reference animal and a mean herd production potential of 4 kg. The different treatment modalities are numbered S5 (H–L), S6 (H–H), S7 (L–L) and S8 (L–H). The third virtual experiment tested a simplified herd management. In case of reproductive failure, goats were kept in extended lactation up to the following reproduction event. The feeding plan was based on a single ration during the whole lactation. This experiment tested two levels of breeding season length (H: 126 days, L: 63 days) and three levels of reference animal (L: 3 kg, M: 4 kg, H: 5 kg) for a mean herd production potential of 4 kg. The different treatment modalities were numbered S9 (H–M), S10 (H–H), S11 (H–L), S12 (L–M), S13 (L–H) and S14 (L–L). In the three virtual experiments, reproduction was parameterised to give a good level of success while remaining equivalent for the different simulations (annual kidding rate of 85%). The numbers of lactating goats were therefore comparable between the simulations and make it possible to study the differences linked to individuals.
Parameterisation of the 14 simulations carried out within the framework of the three virtual experiments with the herd model

1Strict management of reproduction failure corresponds to maintaining the most productive infertile goats in extended lactation and culling the least productive infertile goats.
2Flexible management of reproduction failure corresponds to systematically maintaining infertile goats in extended lactation.
Analysis of output
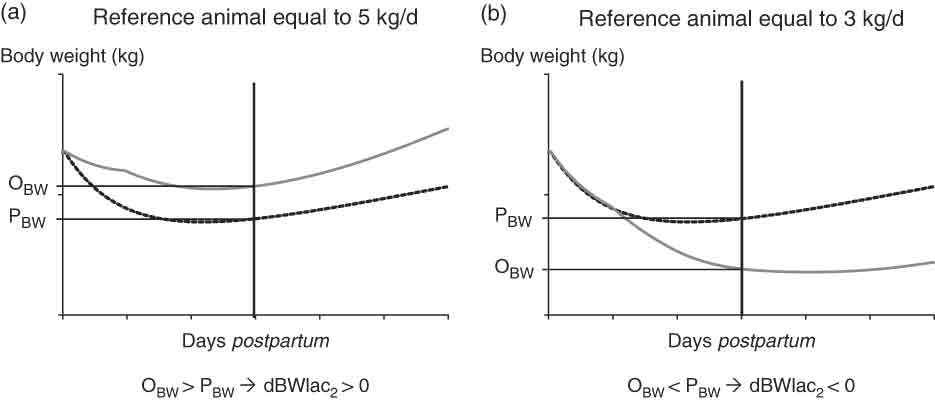
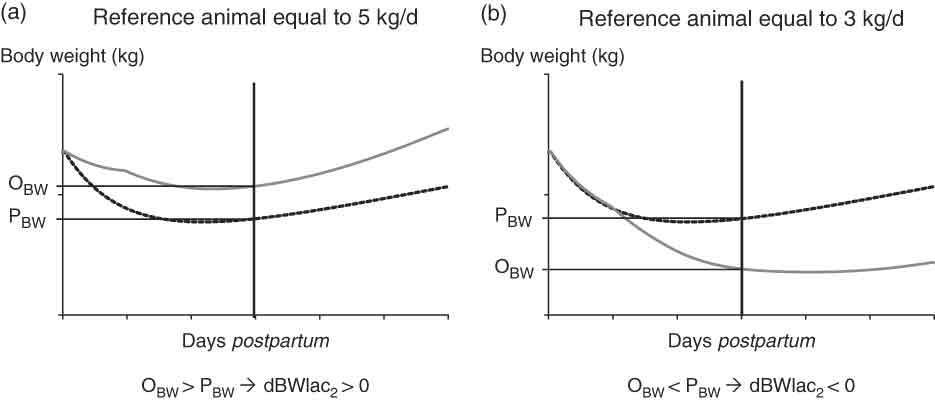
The 14 simulations of these three virtual experiments generated 76 659 complete productive lives of more than two lactations over the last 10 years of simulation. We chose to analyse the last 10 years to be sure that the individuals used for initialisation left the herd. The interpretation of productive lives was based on multivariate descriptive statistics, which make it possible to rapidly process and structure large sets of data and produce simple graphic interpretations. Principal component analysis (PCA) was carried out on 17 individual variables to explore the structuring of the simulated variability (Factor procedure, SAS Institute Inc., Cary, NC, USA). Among these variables, consumption of dry matter (DM) at the scale of the productive life was used to calculate the indices of forage and concentrate feedstuff consumption of individuals. These indices made it possible to calculate feed cost of one kilogram of milk produced at the scale of the productive life on the basis of mean feedstuff prices (0.06 €/kg for forage DM, 0.23 €/kg for dehydrated alfalfa DM and 0.30 €/kg for concentrate feedstuff DM; French Livestock Institute, 2008). A BW indicator (dBWlac2) generated by the model was incorporated into the analysis. This indicator represented the difference between the obtained BW of the individual and its potential BW, that is, determined by the reference pattern of performance (reflecting the expression of its production potential), at 90 days of the second lactation (Figure 1). This indicator is used as a checkpoint during the second lactation to assess the distance between a goat reference pattern of performance and its obtained pattern of performance. When dBWlac2 is positive (Figure 1a), it means that the obtained BW is superior to the potential BW at 90 days of lactation. In other words, the mobilisation of body reserves is lower than the mobilisation of body reserves corresponding to the expression of the production potential. Conversely, when dBWlac2 is negative (Figure 1b), it means that the obtained BW is inferior to the potential BW at 90 days of lactation. In other words, the mobilisation of body reserves is higher than the mobilisation of body reserves corresponding to the expression of the production potential. The BW was recorded at 90 days to take the loss in BW of all simulated goats into account, particularly those, which are the most productive and which mobilise over a longer period of time. The indicator dBWlac2 gives a partial insight into individual patterns of performance, as it does not reflect the use of body reserves at lifespan scale but it does so only at the beginning of second lactation.
Illustration of the calculation of the dBWlac2 variable for a goat with a production potential of 4 kg/day (milk production peak reached during third lactation) supplied with two levels of reference animal (expressed in the same unit as the production potential): (a) reference animal of 5 kg/day and (b) reference animal of 3 kg/day. The black dotted curves represent the reference pattern of BW corresponding to the expression of the goat’s production potential. The grey curves represent the obtained BW pattern with a diet of which the level is based on a reference animal of 5 kg/day (a) or a reference animal of 3 kg/day (b). The variable dBWlac2 is the difference between the obtained BW (OBW) and the potential BW (PBW) at 90 days of the second lactation.
At the scale of the herd, mean performances for 10 years (milk production, feed efficiency in kg of DM/kg of milk) were calculated for each replication and then averaged for the 15 replications of each simulation.
Results
Characterisation of individual lifetime performance variability
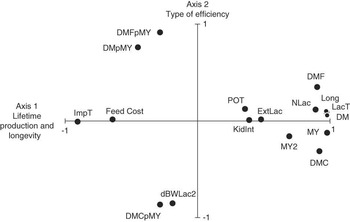
PCA results of the 17 individual variables are given in Figure 2. The first two axes of the analysis strongly structured the variability of the individuals. In particular, axis 1 was dominant insofar as it explained 52% of total variability. This axis represented lifetime productivity and longevity. It opposed milk feed costs and unproductive life variables with those of production, consumption and productive life length. Axis 1 thus opposed short and costly lifetime performance with long and productive lifetime performance. It reflects the fact that feed costs were better amortised over long productive lives. Long productive lives were only partially linked to milk production potential (approximately 10% of the explained variance). This result indicates that a long productive lifetime was not only related to a high production potential but also to the expression of this potential permitted by the management. Axis 2 explained 19% of total variance. This axis represented contrasting types of feed efficiency. It opposed the indices of total DM and forage consumption to the index of concentrate feedstuff consumption and the dBWlac2 variable. On this axis, the dBWlac2 variable was linked very positively to the index of concentrate feedstuff consumption. This result indicates that the higher the usage of concentrate feedstuff in the production process, the higher above potential was the obtained BW at 90 days lactation. The opposition between the indices of total DM and forage consumption and the index of concentrate feedstuff DM consumption translates the forage-concentrate substitution. Axis 2 thus opposed two contrasted ways of feed efficiency building. On the one hand, efficiency was based on the use of a large quantity of dry matter, principally forage, per kg of milk and a more intense mobilisation of body reserves, that is, above the level required to express the production potential. On the other hand, efficiency was based on the use of less DM/kg of milk with a large quantity of concentrate feedstuff and on a less intense mobilisation of reserves, that is, below the level required to express the production potential. It is interesting to note that the feed cost per kg of milk was independent of feed efficiency. This observation suggests that a same feed cost could be attained with different types of feed efficiency.
Positioning of the 17 individual variables according to their coordinates on axes 1 and 2 of the principal components analysis. These variables characterise the productive lives of the 76 569 individuals generated in the three virtual experiments. dBWlac2 = difference in kg between obtained BW and production potential weight at the beginning of the second lactation; DM = total consumption (kg) of dry matter; DMC = total consumption (kg) of concentrate feedstuff dry matter; DMF = total consumption (kg) of forage dry matter; DMpMY = kg of dry matter per kg of milk; DMCpMY = kg of concentrate feedstuff dry matter per kg of milk; DMFpMY = kg of forage dry matter per kg of milk; ExtLac = total number of extended lactations; FeedCost = feed cost of milk (in euros/kg of milk); ImpT = unproductive time (ratio in percentage of the total number of living days and the number of days without production); KidInt = average kidding-to-kidding interval in days; LacT = total number of days in lactation; Long = total number of days of life; MY = total milk production (kg); MY2 = milk production during the second lactation; NLac = total number of lactations; POT = milk production potential (kg of milk at peak of lactation).

Effects of management options on individual lifetime performance variability
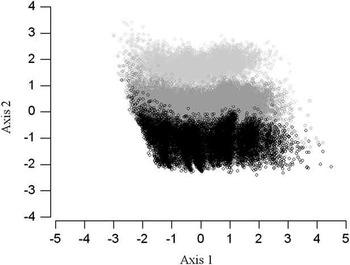
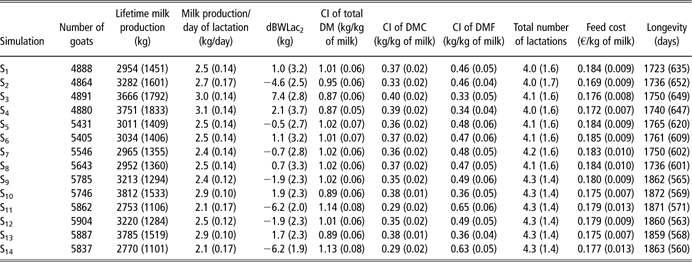
The averages of the individual variables for the 14 simulations are recapitulated in Appendix 1. Figure 3 represents the projection of the individuals in the plan defined by the first two components of the analysis. Management options were coded according to the feeding strategy. Intra-management individual variability was expressed along axis 1. No matter which management option was considered, there was large individual variability in terms of lifetime length and productivity, which did not appear to depend on the position on axis 2. Indeed, reproduction and replacement practices had a strong impact on the length of time the individual remained in the herd as well as on its production rhythm. Such practices varied little across the virtual experiments simulated, which generated similar levels of variability on axis 1. The lack of interaction between individual BW and reproductive performance at the animal model level is also likely to explain the independence between the two axes. Simulations of experiment 3, parameterised for the management of reproduction failure, showed no effect on goat longevity as the number of goats with reproductive failure remained low, thus limiting the effect on longevity (Appendix 1, approximately 100 days difference in longevity). This result is thus linked to the reproduction parameterisation, which in all cases sought a good level of success. This choice was necessary to maintain the numbers of goats in production at comparable levels. Inter-management variability was expressed along axis 2, with the virtual experiments generating contrasting ways of building feed efficiency. The independence of axes 1 and 2 should be considered with caution for goats with short lifetime performances and which obtained high consumption indices. The short productive life was associated with low efficiency because such individuals did not amortise their feed consumption costs during their life in the herd.
Positioning of individuals generated by the three virtual experiments in the plan defined by the first two components of the Principal Components Analysis. The light grey points correspond to the simulations in which the difference between the reference animal and the mean production potential of the herd was negative (underfeeding); the dark grey points correspond to the simulations in which the difference between the reference animal and the mean production potential of the herd was null and the black points correspond to the simulations in which the difference between the reference animal and the mean production potential of the herd was positive (over-feeding).

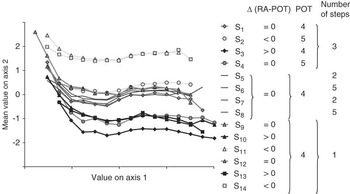
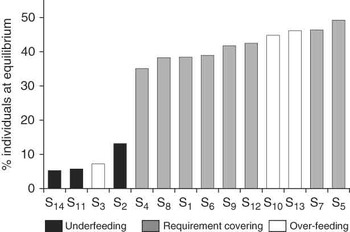
To observe the management effects on individual variability in greater detail, the clouds of points of each simulation were summed up by calculating the average coordinates of individuals on axis 2 according to the values on axis 1 (Figure 4). To complete the information given by the dBWlac2 variable, the proportions of individuals considered to be at equilibrium with their production potential (i.e. dBWlac2 ∈ [−2; 2]) were calculated for each simulation (Figure 5). For the individuals considered at equilibrium, the obtained pattern of performance is closed to the reference pattern of performance at 90 days of second lactation. Three groups of simulations can be distinguished due to their positions on axis 2 (Figure 4), reflecting the inter-management effect observed in Figure 3.
Projection of the average of individual coordinates on axis 2 according to the value on axis 1 for the 14 simulations. The light grey points correspond to the simulations in which the difference between the reference animal and the mean production potential of the herd was negative (underfeeding); the dark grey points correspond to the simulations in which the difference between the reference animal and the mean production potential of the herd was null and the black points correspond to the simulations in which the difference between the reference animal and the mean production potential of the herd was positive (over-feeding). RA = reference animal; POT = mean herd production potential (in kg of milk at the peak of the third lactation). The level of energy supply is expressed by the difference between the average production potential of the herd and the level of the reference animal. The feeding plan is expressed in the number of steps within the feeding sequence.

Percentage of individuals of which the BW was at equilibrium at the beginning of the second lactation for each of the 14 simulations. BW at equilibrium corresponds to a deviation between −2 and +2% (deviation between obtained BW and BW as determined by the milk production potential).

The first group, situated in the positive section of axis 2, includes simulations S11 and S14 in which the feeding management underfed goats of a herd of average production potential. Such management generated individuals for which efficiency was based on a high level of forage DM consumption and mobilisation of reserves above levels imposed by the expression of their milk production potential. This mobilisation of BW also led to a very small proportion (<10%) of individuals at equilibrium (Figure 5).
The second group of simulations was at an intermediary position on axis 2 (Figure 4) and included two types of simulations. The first type groups simulations in which the feeding management meets the requirements of the production potential of the herd (4 kg) and covers simulations S5–8 of experiment 2 as well as S1 (experiment 1), S9 and S12 (experiment 3). These simulations differed in the degree of segmentation of the feeding plan, the length of the breeding season and the management of reproductive failure (Table 1). They generated individuals for which the efficiency was similar and a large proportion of which were at equilibrium (Figure 5). Hence, the interaction between physiological states staggering and the degree of feeding plan segmentation had no marked effect on the individual variability. The second type of simulations in an intermediary position on axis 2 included only simulation S2. This simulation corresponded to a feeding management that underfed goats of the high production potential herd (5 kg). S2 thus produced efficiency that was globally similar to the first type of simulations as the individuals compensated by using their reserves more than was necessary according to their production potential. This type of efficiency was related to a low proportion of individuals at equilibrium (Figure 5).
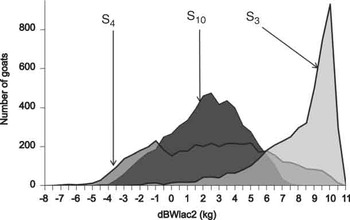
The third group of simulations was situated more in the negative section of axis 2 and concerns simulations S3, S4, S10 and S13. These simulations generated individuals for which the efficiency was based on a high consumption of concentrate feedstuff and less use of reserves than would be expected given their production potential. Simulations S3, S10 and S13 corresponded to management in which goats were overfed. Such management generated quite variable proportions of individuals at equilibrium: <10% of the individuals in S3 at equilibrium compared with more than 40% for S10 and S13 (Figure 5). Such contrasting proportions of individuals were linked to the dBWlac2 distributions, which were also contrasted (Figure 6).
Distribution of the individuals simulated in the three management contexts (S10, S4 and S3) according to the value of the dBWlac2 variable which represents the difference (in kg) between obtained BW and potential BW at 90 days of the second lactation.

This contrast should be linked to the degree of feeding plan segmentation. In these simulations, the over-feeding was amortised by the distribution of a single ration during lactation, generating a gap between the temporal evolution of the goat’s requirements and the temporal evolution of supplies. Hence, at certain moments, even if the global diet was designed to be above average requirements, goats could have remained underfed. In contrast to the precedent simulations, S4 corresponded to a feeding management that satisfied the requirements of a high-production potential herd (5 kg). It led to efficiency similar to simulations S3, S10 and S13 as well as to a high proportion of individuals at equilibrium (Figure 5). Still, the distribution of the dBWlac2 variable for S4 was much wider spread than for S10 (Figure 6). The consistency of the reference animal with the mean herd production potential led to management which expressed the highest variability of the difference between potential BW and obtained BW.
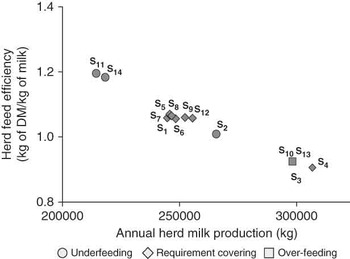
Global herd performance
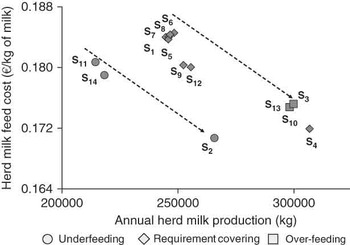
Figure 7 shows the relationship between average efficiency (evaluated by the global consumption index in kg of DM/kg of milk) and average milk production of the herd. The higher the production, the lower was the consumption index, that is, the higher the feed efficiency. This global tendency, which was, moreover, also found at the level of the individuals, reflected the dilution of fixed biological costs (maintenance requirements) by increased production. The management options which overfed individuals or which relied on high milk production potential of goats fed to requirement led to both increased production and improved overall feed efficiency.
Results of the 14 simulations at the scale of the herd for herd feed efficiency according to annual milk production. The circles correspond to the simulations in which the difference between the reference animal and the mean production potential of the herd was negative (underfeeding); the diamonds correspond to the simulations in which the difference between the reference animal and the mean production potential of the herd was null and the squares correspond to the simulations in which the difference between the reference animal and the mean production potential of the herd was positive (over-feeding).

Figure 8 illustrates the relationship between average milk feed cost and average production for the herd. The higher the milk production, the lower was the feed cost. Two parallel tendencies in the evolution of cost appeared according to the production: one corresponded to management options in which the reference animal was superior to the average production potential of the group, the second to management options in which the reference animal was inferior to the average production potential of the group. This result showed that the same milk production could be attained at different levels of cost. As the relationship between the efficiency of conversion of matter and milk production was linear, the total quantity of DM/kg of milk was equivalent in the two cost situations (since they lead to the same production). The cost difference was thus generated by the composition of DM necessary to produce a kg of milk. When the reference animal was inferior to the average production potential of the group, the necessary global DM per kg of milk contained a high proportion of forage (low cost). On the opposite, if the reference animal was superior or equal to the group potential, the global DM needed to produce a kg of milk contained a high proportion of concentrate feedstuff (high cost).
Relationship between feed cost (in €) of one kilogram of milk produced and the annual milk production of the herd for the 14 simulations. The circles correspond to the simulations in which the difference between the reference animal and the mean production potential of the herd was negative (underfeeding); the diamonds correspond to the simulations in which the difference between the reference animal and the mean production potential of the herd was null and the squares correspond to the simulations in which the difference between the reference animal and the mean production potential of the herd was positive (over-feeding). The two arrows represent the general tendency linking costs and production, that is to say amortising fixed production costs by increasing the overall level of production.

Discussion
Simulation results
The SIGHMA herd model brought to light the effects of three types of management options on the variability of individual lifetime performance: the diet energy level, the feeding plan segmentation and the mean production potential of the herd. The variability of lifetime performance is structured around an axis characterised by longevity and productivity and another axis representing the type of feed efficiency. Intra-management variability is expressed on the first axis, whereas inter-management variability is expressed on the second. The combination of the diet energy level and the mean herd production potential strongly influence the building of individual feed efficiency. The effect of the degree of feeding plan segmentation appears only in the case of over-feeding. Similar levels of feed efficiency can thus be attained with quite different combinations of management options. Still, such combinations solicit different biological bases and lead to contrasting proportions of individuals at equilibrium with reference to their production potential. Our results show that over-feeding interacts with the degree of feeding plan segmentation: a fine segmentation of the plan strongly limits the proportion of individuals at equilibrium whereas a single ration makes it possible to have a large proportion of individuals at equilibrium. Our results also show that underfeeding a herd with high potential or feeding a herd with average potential at requirement result in similar levels of feed efficiency. Still, in the case of underfeeding, efficiency is attained with individuals, which solicit their body reserves above the level required by their production potential.
At the level of the herd, the level of supplies and of the mean production potential have marked effects on production and efficiency through a mechanism of fixed production costs dilution. Introducing the feed cost per kg of milk facilitates discrimination of the effects of management options by including the necessary composition of a kg of DM used in producing a kg of milk. Management option discrimination is enhanced by examination of the individuals at the root of feed efficiency. Different management options can lead to similar levels of production and feed efficiency at the scale of the herd, but give very contrastive proportions of individuals at equilibrium with reference to their production potential. In this study, we used a simple and partial indicator of biological efficiency with a checkpoint of the BW at 90 days of the second lactation. It could be interesting to use biological indicators calculated at lifespan scale to enrich the assessment of individual efficiency and to have a broaden view of the proportion of individuals at equilibrium within the herd. Such development requires evaluating the balance between the cost of acquisition and the level of information of such indicators.
The herd model offers interesting perspectives for the conception of group feeding. The INRA recommendations for goat are based, as for other ruminants, on the principle of optimising forage consumption at the scale of the individual. Treating feeding at the level of the group draws this principle into question. Herd model results show that the difference between the reference animal and the mean production potential of the herd along with the degree of feeding plan segmentation influence the composition of DM necessary to produce a kg of milk. Such results could be reused to enrich the group-feeding module proposed in the INRATION software.
Interest of individual variability in assessing management practices
The analysis of individual lifetime performance variability makes it possible to assess practices by associating them with a potential level of risk. We consider here that the risk corresponds to deviations from the reference pattern of performance, driven by production potential expression. This pattern represents the expression of an individual’s natural forms of adaptation which have developed to maximise its chances of success, from an evolutionary point of view (Friggens and Newbold, Reference Friggens and Newbold2007). Deviating from this trajectory can be considered as a risk. Hence, deviating can solicit compromises between physiological functions and lead to negative effects on performance (e.g. problems of infertility or health). Over-feeding a herd of average production potential associated with a fine segmentation of the feeding plan presents a higher level of risk than the same level of over-feeding associated with a simple feeding plan or with a herd of average production potential fed at requirement. Indeed, this feeding management results in only a low proportion of individuals at equilibrium and efficiency based on a high consumption of concentrate feedstuff. This way of building efficiency is risky from the biological point of view because it relies on individuals functioning quite differently from their genetically driven trajectory. This way of building efficiency is also risky from an economic point of view because it relies on using expensive and volatile raw materials. In a situation of price stability, herd managements based on over-feeding or herd with high milk production potential generate comparable levels of performance. On the other hand, in case of a positive price variation the performances generated by these two management options will be affected differently since they are not based on the same ways of building efficiency. The same reasoning can be envisaged for the occurrence of a drop in feed offer. Such a perturbation would, depending on the management options, have variable effects on performance because it would solicit adaptation capabilities of individuals in differing situations of biological balance. These two examples illustrate the importance of gaining better understanding of the processes underlying performance building to foresee herd responses to exogenous perturbations. Predicting the properties of resiliency and robustness of production systems is one of the key aspects in their durability (Darnhofer, Reference Darnhofer2009). In a fluctuating environment, the productivity of a system must be envisaged from the point of view of maintaining inter-temporal performance stability rather than from the angle of yearly average (Tichit et al., Reference Tichit, Hubert, Doyen and Genin2004). Simulation models, such as SIGHMA, based on representing the processes underlying performance open new perspectives for assessing production systems from the angle of temporal building of performance.
In our present state of development, the model does not make it possible to apprehend the full set of interactions between the management options and the biological responses of individuals. For example, the individual model at the base of the herd model does not integrate biological interaction between reproduction and nutrition. Integrating the effects of the level of body reserves on reproductive performance (Mellado et al., Reference Mellado, Olivares, Lopez and Mellado2005) would make it possible to better represent the after effects of feeding on goat longevity. Work on lactating cows has shown that a low level of winter feeding was linked to a high culling rate due to infertility (Blanc et al., Reference Blanc, Bocquier, Agabriel, D’Hour and Chilliard2006). This point merits study in goats, and, depending on the results, it would be pertinent to introduce the delayed effects of feeding on reproduction since the latter probably modulate the independence we observed between longevity and productivity on one hand and efficiency on the other (orthogonality of axes 1 and 2 of the PCA). Ways of building efficiency that are unfavourable for reproduction performance will thus lead to shorter lifetime performances due to replacement brought about by infertility. Our results show that longevity and productivity are correlated on the same axis. They do, however, differ from works on small ruminant systems, which have shown that longevity and productivity are two independent axes structuring individual variability (Lasseur and Landais, Reference Lasseur and Landais1992; Moulin, Reference Moulin1993). This difference can be linked to the specificity of dairy systems of which the global productivity at the scale of the lifetime performance is positively linked to longevity and negatively to the number of unproductive days (e.g. Thénard et al., Reference Thénard, Trommenschlager and Catteau2003).
A possible improvement of our approach lies in introducing variability concerning the rules of energy allocation among physiological functions. In general, the goal of an experimental design is to control the sources of individual variability to gain more power over average effects of experimental treatments. Producing knowledge on variability in individual response laws implies reviewing the conceptual logic of the experimentation. Doing so would make it possible to better integrate the after effects of feeding over the long term and should lead us to consider the animal not as a factor to control, but rather as a factor to study. However, taking account of effects over the long term involves making experimental protocols heavier. Integrating variability of energy allocation rules would make it possible to represent different functional types of females in a herd, as, for example, females with a tendency to redirect energy towards BW v. females with a tendency to redirect energy towards milk. It would be interesting to test whether the existence of several types of females with a herd confer management flexibility. This hypothesis is presently being investigated in agronomics (Duru et al., Reference Duru, Cruz and Magda2008). Such works have shown that the existence of different functional types of plants in prairies gives the forage management system greater flexibility. Representing the functional types of females would also make it possible to test whether the diversity of types reinforces the herd’s aptitude to withstand exogenous perturbations. This hypothesis was proposed by Gibon (Reference Gibon1994) who studied several functional types of females (defined as types of reproduction lifetime performances) in herds managed in a harsh environment.
As to the interest of lifetime performance diversity for attaining certain levels of performance or stable performance over time, the question remains open. The (Tichit et al., Reference Tichit, Ingrand, Moulin, Cournut, Lasseur and Dedieu2008) synthesis shows that lifetime performance diversity plays an important role in carrying out a production project. Still, it does not show any unequivocal relationship between the level of environmental constraint and lifetime performance diversity: certain management favour lifetime performance homogeneity while others favour lifetime performance heterogeneity in both difficult and non-limiting environmental conditions. It is therefore essential to continue such research to better characterise the situations in which lifetime performance variability within a herd would not represent an advantage and could necessitate identification of female segments as the targets of specific practices (Lee et al., Reference Lee, Atkins and Sladek2009). Relying on the simulation of herd functioning represents a promising perspective in clarifying the debate on the interest of individual variability.
Conclusion
Integrating indicators characterising production processes to describe individual lifetime performances has made it possible to enhance knowledge on assessing the effects of the diet energy level, the degree of feeding plan segmentation and the mean milk production potential of a herd. Similar levels of efficiency can rely on different biological bases. Aggregating individual performance at the level of the herd can mask differences between management options from the point of view of the type of efficiency of converting DM into milk. One of the perspectives highlighted in this work is to assess the performance of different management options in a fluctuating environment and to see whether the differences in efficiency building, identified in this study, are at the origin of differences in adaptation capabilities of a herd system.
Acknowledgements
This study was supported by a grant from the Poitou-Charentes region of France, the INRA PHASE and SAD departments and by financial support from the ‘ANR (Agence Nationale de la Recherche) – the French National Research Agency’ under the ‘Programme Agriculture et Développement Durable’ project ‘ANR-05-PADD-02-04’. The authors are grateful to N. Bossis (Institut de l’Elevage), B. Leboeuf (INRA), F. Jénot (Fresyca), H. Coutineau (LEGTA Melle), A. Panelle and J. Losdat (BTPL) for their precious contribution to the model evaluation. They also thank the staff of INRA MoSAR and SAD-APT Research Units.
Appendix
Mean values of the individual variables simulated in the 14 simulations. The standard deviation is given in parentheses
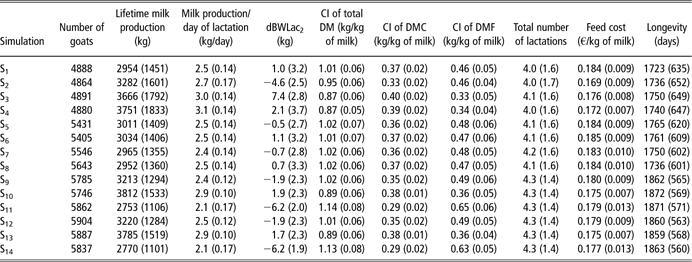
CI = consumption index; DM = dry matter; DMC = dry matter of concentrate feedstuff; DMF = dry matter of forage.