Introduction
The Antarctic fauna of non-marine invertebrates has a discontinuous distribution and is separated into two well-defined biogeographical regions (Maritime and Continental Antarctica) by the ‘Gressitt Line’ (Chown & Convey Reference Chown and Convey2007). These main sectors share very few species (only 3% show a pan-Antarctic distribution) with a high incidence of endemism and with many taxa having a very limited, local distribution (Pugh & Convey Reference Pugh and Convey2008). Terrestrial arthropods, seasonally active in isolated ice-free areas, are represented by a few species of springtails (Collembola) and mites (Acari). The current taxa composition of springtails is thought to be a remnant of a once-richer pre-Pleistocene biodiversity, which has been almost completely obliterated by ancient and recent palaeogeological events (Stevens et al. Reference Stevens, Greenslade, Hogg and Sunnucks2006). Twenty-five Antarctic springtail species are distributed across the few ice-free areas (Greenslade Reference Greenslade1995), which correspond to a negligible 0.3% of the entire landmass (Sinclair & Stevens Reference Sinclair and Stevens2006). Endemic taxa are isolated from other springtail species, living in neighbouring continents, due to the geographical position of Antarctica and the barrier effect caused by the Antarctic Circumpolar Current (Fraser et al. Reference Fraser, Nikula, Ruzzante and Waters2012); although a handful of recent invasive species have successfully established in localities with geothermal activity (Greenslade Reference Greenslade2010). In addition, due to their limited dispersal capabilities and sensitivity to dehydration, springtail populations are also frequently isolated from one another because their habitats are fragmented and positioned between glaciers, mountain chains or open sea resulting in a chance of survival close to zero when specimens are subject to long-range aerial phoresis or hydrochory. Dispersal attempts have positive outcomes only when colonized environments are ice-free soils with a sufficient amount of bioavailable freshwater necessary for survival.
Some commonly used molecular markers have been applied to study the population genetics of springtail species in a phylogeographical framework in the maritime and continental regions (McGaughran et al. Reference McGaughran, Stevens, Hogg and Carapelli2011). Major efforts have also been dedicated to establishing the presence of ice-free palaeo-refugia, where specimens have survived more than ten recent glacial cycles in the last 2 myr (million yr bp). Some of these have been identified in the Transantarctic Mountains (Stevens et al. Reference Stevens, Greenslade, Hogg and Sunnucks2006), although more may have been present at lower coastal sites in geothermally active regions (Fraser et al. Reference Fraser, Terauds, Smellie, Convey and Chown2014). Therefore, post-glacial colonization of available habitats may have allowed the admixture of a selection of specimens (possibly originating from different refugia) that were probably already highly genetically diversified.
Genetic surveys of Antarctic springtails generally show isolation of conspecific populations, reduced gene flow and high intraspecific genetic divergence, in contrast with substantial morphological uniformity. This scenario provides a good description of the high genetic variability observed within Friesea grisea (Schäffer), the only springtail species with a pan-Antarctic distribution. Haplotype screening for this species revealed the presence of at least three well-differentiated phylogroups and a plausible specific boundary between peninsular and continental specimens (Torricelli et al. Reference Torricelli, Frati, Convey, Telford and Carapelli2010). Recently, Greenslade (Reference Greenslade2015) has synonymized the monospecific genus Gressittacantha with Cryptopygus, and changed the name of the species from terranova to terranovus. Therefore, in this study we have applied the new name for this isotomid species endemic to Victoria Land. The populations of Cryptopygus terranovus (Wise 1967) have been the subject of two independent genetic studies. Allozyme electrophoresis (Fanciulli et al. Reference Fanciulli, Summa, Dallai and Frati2001) detected an excess of within-population heterozygosity (>40% in 7/22), and high levels of genetic divergence in C. terranovus (if compared with other non-Antarctic collembolan species), as well as a subdivision into northern, central and southern populations. Similar results were obtained by studying mitochondrial haplotypes, in samples collected from two transects in Victoria Land (Hawes et al. Reference Hawes, Torricelli and Stevens2010). This fine spatial scale study revealed the existence of two main phylogroups (clade A and B) present in both transects and only one (out of 26) shared haplotype among the populations. The occurrence of a high intraspecific genetic differentiation, observed in a restricted geographical range of the known distribution of C. terranovus, in Victoria Land, would suggest that a deeper haplotype divergence exists between more distant and unexplored populations. Actual separation in phylogroups may therefore be greater than recognized, as observed with allozyme markers (Fanciulli et al. Reference Fanciulli, Summa, Dallai and Frati2001). In this study, we tested whether enlarging the range of the sampling sites results in detection of a higher differentiation between and/or within populations, and if the genetic structuring of haplotypes is congruent with that proposed from the allozyme data. Thus, we have expanded the population genetics study, based on cox1 haplotypes, for C. terranovus including samples from Victoria Land sites not analysed in Hawes et al. (Reference Hawes, Torricelli and Stevens2010) and using analytical methods never applied previously to this species. In addition, the larger collection of populations/specimens (basically corresponding to the complete range of distribution for this taxon) has enabled a direct comparison between mitochondrial and nuclear (allozyme) markers. These data, as recently demonstrated for other springtail taxa, propose that C. terranovus is a relict species that survived the Last Glacial Maximum (LGM)≈20 ka in refugia, which were located in the Transantarctic Mountains or at lower altitudes. In this respect, emerging hypotheses on the survival strategy of springtail species during the last glacial cycles, also account for the presence of ice-free habitats surrounding long-lived geothermal sites (Fraser et al. Reference Fraser, Nikula, Ruzzante and Waters2012). The occurrence of geothermal activity in the region where C. terranovus has been collected may provide additional insight into the identification of glacial refugia at low altitudes in Victoria Land. Finally, molecular clock data have been applied to test if the C. terranovus phylogroups were already differentiated before the LGM and whether the species can be considered a Gondwanan relict.
Methods
Sample collection and DNA sequencing
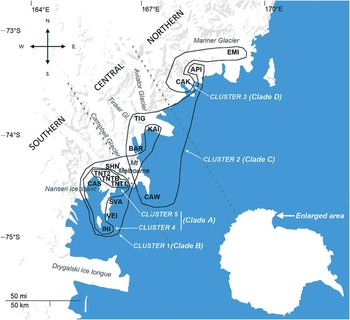
Ten specimens of C. terranovus were sampled (aspirated using a small vacuum device) from each of the 11 sites in Victoria Land during the 2005–06 Programma Nazionale Di Ricerche in Antartide (PNRA) expedition (Fig. 1; abbreviation for the 11 site localities are defined in Table I). The specimens were morphologically identified as C. terranovus, preserved and then stored at -80°C until molecular analysis. The whole genomic DNA was extracted using the Wizard SV genomic DNA purification system (Promega, Madison, WI, USA) and used for PCR amplifications, performed in a GeneAmp PCR System 2700 (Applied Biosystems, Foster City, CA, USA) thermal cycler. The PCR amplification of the DNA bar code fragment of the mitochondrial cox1 (Hebert et al. Reference Hebert, Cywinska, Ball and DeWaard2003) was obtained using the primers GGTCAACAAATCATAAAGATATTGG (LCO) and TAAACTTCAGGGTGACCAAAAAATCA (HCO) (Folmer et al. Reference Folmer, Black, Hoeh, Lutz and Vrijenhoek1994). All reactions were performed in a total volume of 25 μl containing 2.5 μl of genomic DNA, 0.5 mM of each primer, 0.2 mM of each dinucleotide, 2.5 mM MgCl2, 5 μl of Green GoTaq Flexi buffer and 0.625 U of GoTaq Flexi DNA Polymerase (Promega, Madison, WI, USA). The PCR conditions were: 35 cycles at 95°C for 1 min, 50°C for 1 min and 72°C for 90 sec, followed by a final extension step at 72°C for 7 min. The PCR products were then purified using the kit Wizard SV Gel and PCR Clean-up (Promega, Madison, WI, USA), and sequenced on both strands with a DNA Analyzer ABI 3730 at the core facility of the Biofab Research Laboratory (Rome, Italy). The initial sequence dataset was assembled using Sequencher 4.4.2 (Gene Codes Corporation, Ann Arbor, MI, USA) and deposited in GenBank under accession numbers: KR180247–KR180287. The two outgroup species Cryptopygus cisantarcticus Wise and Folsomotoma octooculata Willem used for the phylogenetic analysis of haplotypes were also obtained in this study. Their sequences are deposited in GenBank under accession numbers KR180288 and KR180289, respectively.
Map of the sampling localities divided into three geographical sectors. Population abbreviations are defined in Table I. Proposed clusters of haplotypes (1–5) according to hierarchical clustering analysis and landscape genetics parameters, and clades (A–D) from the phylogenetic tree (see Fig. 3).

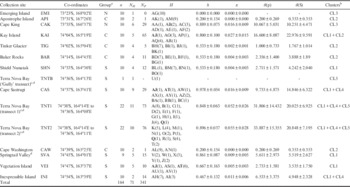
Statistics of population genetic parameters.

n=number of individuals, N H =number of haplotypes, N P =number of polymorphic sites, H=haplotype labels, h=haplotype diversity, π=nucleotide diversity, θ(p)=mean number of pairwise differences for each population, θ(S)=mean number of segregating sites for each population.Shared haplotypes highlighted in bold.
a Arbitrarily defined as: N=northern, C=central and S=southern.
b Assignment of population to a given cluster of haplotypes.
c Samples from transects (Hawes et al. Reference Hawes, Torricelli and Stevens2010).
d Obtained from Hawes et al. Reference Hawes, Torricelli and Stevens2010.
Assembling the dataset
Ten specimens for each of the 11 sites sampled in this study (Table I) were included in the analysis, corresponding to 110 sequences, plus 54 additional sequences (HM461270–HM461323) obtained by Hawes et al. (Reference Hawes, Torricelli and Stevens2010) for specimens collected in the foothills above the German Gondwana summer station (74°38'S, 164°14'E). These latter sequences are from specimens that were collected along two adjacent ridges (TNT1/2), from one midpoint site (TNTB) and from the nearby locality of Springtails Valley (SVA) (Fig. 1).
Sequences were manually aligned with MacClade 4.08 (Maddison & Maddison Reference Maddison and Maddison2005), resulting in a 612 bp matrix (with no indels), 144 polymorphic sites and 128 parsimony informative characters (outgroups excluded from calculations). Haplotype nomenclature follows that proposed in Hawes et al. (Reference Hawes, Torricelli and Stevens2010) with new sequences named in succession.
Phylogenetic analysis of haplotypes
Unique haplotype sequences of C. terranovus and one from each of two outgroup Antarctic species, the isotomids C. cisantarcticus and F. octooculata, have been used for the phylogenetic analysis. A total of 612 nucleotides of cox1 were partitioned into three groups according to their codon position (1st, 2nd and 3rd), and investigated for the best partitioning strategy and evolutionary model for each partition, as implemented in PartitionFinder 1.0.1 (Lanfear et al. Reference Lanfear, Calcott, Ho and Guidon2012). The selected partitioning scheme and evolutionary models (1st=F81+I, 2nd=SYM+G, 3rd=HKY+G) were applied in a Bayesian analysis using MrBayes 3.2.1 (Ronquist & Huelsenbeck Reference Ronquist and Huelsenbeck2003). Two parallel runs, each consisting of four chains, were run for ten million generations, sampling every 1000th state and removing 25% as burn-in after convergence of log likelihood values.
Genetic variability
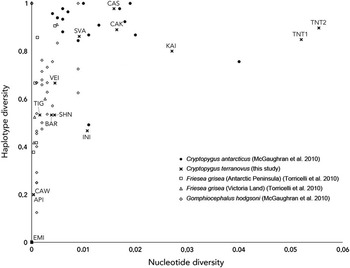
The study of the population genetics was performed using the previous dataset applied for the phylogenetic analysis. Haplotype frequencies were obtained using the online tool DNAcollapser (available at http://users-birc.au.dk/biopv/php/fabox/dnacollapser.php), whereas the network clade analysis was performed using TCS 1.21 (Clement et al. Reference Clement, Posada and Crandall2000) using the default setting of 95% connection limit. Different parameters of genetic variability, such as the absolute number and the proportion of nucleotide changes between haplotypes (p-distance), among and within the sites sampled in this study were calculated using PAUP* (Swofford Reference Swofford2003). Moreover, the average number of nucleotide substitutions between populations was computed through the software DnaSP v5 (Librado Rozas Reference Librado and Rozas2009). Nucleotide and haplotype diversity parameters, as well as the correlation coefficient between two matrices, as implemented in the Mantel test (Mantel Reference Mantel1967), were obtained with Arlequin 3.11 (Excoffier et al. Reference Excoffier, Laval and Schneider2005) through 16 000 permutations. One matrix was based on pairwise genetic distances (FST) among populations (as implemented in Arlequin) and the other (environmental) was calculated using the geographical distances among sampled localities (obtained using the Geographic Distance Matrix Generator program, http://biodiversityinformatics.amnh.org/open_source/gdmg, accessed on 7 July 2016). The haplotype (h) and nucleotide (π) diversity indices (Nei Reference Nei1987), as well as the mean number of pairwise differences (θ) and segregating sites (θS) were calculated using Arlequin. The latter was also used to run a ‘neutrality test’ among populations, calculating the Tajima’s D parameter (Tajima Reference Tajima1989), with the significance of the values evaluated over 16 000 permutations. Values of h and π, calculated for the C. terranovus populations, were plotted in a graph (Fig. 2), together with those of other Antarctic springtail species obtained from bibliographic sources (McGaughran et al. Reference McGaughran, Torricelli, Carapelli, Frati, Stevens, Convey and Hogg2010, Torricelli et al. Reference Torricelli, Frati, Convey, Telford and Carapelli2010). The demographic history of populations, namely the occurrence of a recent population expansion or contraction, was estimated through mismatch distribution (MMD) analysis (the distribution of pairwise differences among haplotypes) (Schneider & Excoffier Reference Schneider and Excoffier1999) (significance evaluated over 16 000 replicates). The putative time of population expansion (t) was estimated using the population demographic parameters tau (τ) and theta (θ; with θ0 at pre- and θ1 at post-expansion, respectively), applying the formula:
 $$t = {\it τ}/2μ,$$
where μ is the mutation rate per locus per generation (Rogers & Harpending Reference Rogers and Harpending1992) and assuming a divergence rate of 1.5–2.3% Myr-1 (Brower Reference Brower1994) and a generation time of five years (McGaughran et al. Reference McGaughran, Hogg and Stevens2008). Goodness-of-fit of the sudden expansion model was tested with 16 000 bootstrap replicates, for the complete dataset and for each individual population. Sum of squared deviations (SSD) (Rogers & Harpending Reference Rogers and Harpending1992), between observed and expected mismatch patterns, and Harpending’s raggedness index (R), to assess the fit of the observed distribution with population expansion as null hypothesis, were calculated and validated with the P-value test. Analysis of molecular variance (AMOVA) (Excoffier et al. Reference Excoffier, Smouse and Quattro1992) was used to produce estimates of variance between haplotypes at different hierarchical levels. The sampling sites can be clustered into three major geographical groups (also see Fanciulli et al. Reference Fanciulli, Summa, Dallai and Frati2001): northern (N), central (C) and southern (S) (Fig. 1). The northern area is southwardly delimited by the Aviator Glacier, the central zone lies between the Aviator Glacier and the Campbell Ice Tongue, and the southern area is located between the Campbell Glacier and the Nansen Ice Sheet. The population sampled from API, located in the northern zone, was found to be an exception in Fanciulli et al. (Reference Fanciulli, Summa, Dallai and Frati2001) as it genetically clustered with specimens collected from the central area. The proportion of genetic variation of partitioned sets of molecular data (among groups, among populations within groups and among all populations) was compared (Table II) (with significance values estimated through 16 000 iterations) with API excluded from analysis or included in either the northern or the central group. In addition, the existence of a subdivision of populations was also tested using a Bayesian model-based clustering method, as implemented in BAPS 6.0 (Corander & Tang Reference Corander and Tang2007), assigning the haplotypes to clusters according to the linked loci model. The MMD, SSD and raggedness indexes were therefore performed again as test statistics, this time grouping the haplotypes according to the assigned cluster, instead of the belonging population. Landscape genetic parameters were also processed with BAPS 6.0 to perform a spatial mixture analysis, obtaining a correlation between the observed genetic discontinuities between haplotypes and their landscape parameters (the geographical co-ordinates where a given population was sampled) (Guillot et al. Reference Guillot, Estoup, Mortier and Cosson2005). Hierarchical clustering of haplotypes was also provided through the visualization of the Voronoi tessellation, with cells representing spatially grouped clusters of specimens, each one depicted with a different pattern according to the clustered group.
Nucleotide-haplotype diversity in C. terranovus populations and other Antarctic collembolan species. Values obtained from bibliographic sources (McGaughran et al. Reference McGaughran, Torricelli, Carapelli, Frati, Stevens, Convey and Hogg2010, Torricelli et al. Reference Torricelli, Frati, Convey, Telford and Carapelli2010).

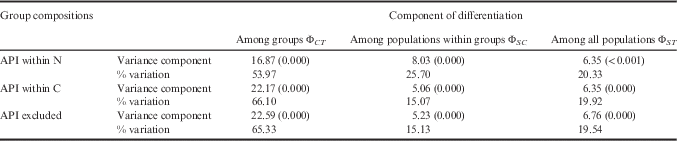
Hierarchical analysis of molecular variance (AMOVA). Components of differentiation calculated with alternative sets of data that change according to the: inclusion of the Apostrophe Island (API) population to the northern group (N), inclusion of the API population to the central group (C) and exclusion of the API population from the analyses.
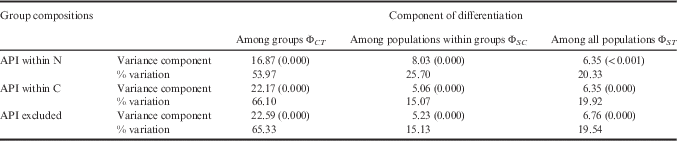
P-values in brackets, significance threshold at P<0.005.
Results
Haplotypes and population structure analyses
Our analyses are based on the comparison of 164 individual sequences from 15 populations, each collected from different locations throughout central Victoria Land (Table I). The 67 different haplotypes were each unique to one location, with the exceptions of Q found at both TNT1 and TNT2, AT present in CAS and VEI, and AJ found in CAS, KAI and VEI. Consequently, all populations had at least one private haplotype. Each location had 1–11 haplotypes, with an average of five (with the single sequence from TNTB excluded from this comparison).
Estimates of genetic diversity were compared for all samples, with the highest values usually observed for the two sites TNT1/2); although these locations in particular have been sampled in a much larger area and are represented by a higher number of processed specimens than the new sites from the current study. With the exclusion of the TNT1/2 localities, haplotype diversity ranged from 0 to 0.978 (mean: 0.560), with the highest values found in the populations of CAK, CAS, KAI and SVA, which host one of the three shared haplotypes (Table I). Nucleotide diversity (with the exclusion of the transects, TNT1/2) ranges from 0 (EMI) to 0.027 (KAI) (mean: 0.013). Average levels of nucleotide diversity are higher in southern populations (0.019), than in northern and central ones (0.008 and 0.007, respectively). Relationships between nucleotide (π) and haplotype (h) diversity across various Antarctic collembolan species were plotted (Fig. 2), showing four populations (KAI and INI, along with TNT1/2) with an excess of π with respect to h. In general, the highest ratio values observed among the five Antarctic springtail species are present in some populations of the two co-generic isotomid species (C. antarcticus and C. terranovus). The KAI population has the highest values of mean nucleotide pairwise differences θ(p) and mean number of segregating sites θ (S) (apart from TNT1/2) (Table I). P-distance values between haplotypes range from 0.002 (one substitution) to 0.152 (93 substitutions, observed between: AF-CAK and AG-EMI vs either M-TNT2 and BC-CAS) (average p-distance: 0.075, corresponding to 45.7 average substitutions). Within populations, p-distance values range from 0.2 to 10% (Table S1 found at http://dx.doi.org/10.1017/S0954102016000730). Comparisons between C. terranovus populations and the outgroups (expressed as average p-distance values) were equally high (C. terranovus vs C. cisantarticus=0.172, C. terranovus vs F. octooculata=0.189, C. cisantarcticus vs F. octooculata=0.181).
Due to the high genetic divergence between sequences, the parsimony connection limit was too high to link most of the haplotypes into a single parsimonious network (data not shown). Relaxing the connection limit parameters (i.e. fixed at 20 steps), the network links did not change. The two haplotypes AA and BA, from KAI and CAS, respectively, did not connect with any other haplotype. In this respect, AA differs from the other haplotypes of the same cluster (cluster 3) for 16 to 22 nucleotide changes, whilst BA has 25–26 different nucleotides with respect to the haplotypes of the cluster (cluster 4) to which it belongs. The majority of the other sequences formed a star-like sub-network, with no pattern to distinguish a genetic relationship between them.
An AMOVA screening was run using two datasets that differ for the position of the API population (in turn assigned to the northern or to the central group).
This analysis shows a remarkable and significant structuring of genetic variation, only 20% of which depends on differences between populations (regardless of the inclusion or exclusion of API in the different geographical groups). On the other hand, genetic variants mostly depend on among-group differentiation, with its contribution higher (>65%) when API is excluded from comparisons or included in the central group (Table II).
The Mantel test calculated for all populations showed a significant correlation between genetic and geographical distances (r=0.356, P<0.001); the r value increases to 0.423 (P=0.001) when the test is performed excluding API from the dataset. This evidence is confirmed by average nucleotide substitution data (Table S2 found at http://dx.doi.org/10.1017/S0954102016000730), which show the highest value for the comparison between the populations of EMI and INI, sampled at the two latitudinal extremes of the sampling area (Fig. 1). Conversely, the two populations of API and CAW appear to be the most closely related of the entire dataset, from a genetic perspective (Table S2).
Phylogenetic relationships between haplotypes
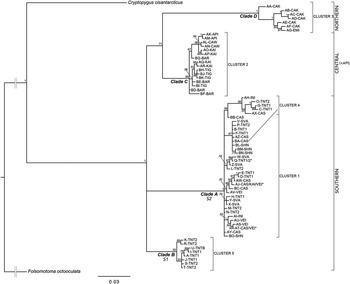
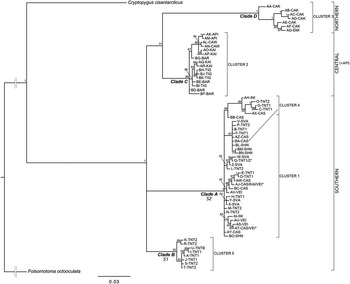
Our phylogenetic reconstruction (Fig. 3) supports the clustering of haplotypes within four major clades (A–D), which are distributed according to a defined latitudinal range. Southern populations are represented by sequences of two phylogroups (S1 and S2) (Table I). The majority of haplotypes are unique (59.7%) or private (97%) within a given population and, therefore, collectively represent the genetic pool exclusive to a specific geographical region. The AJ haplotype is an exception to this pattern, given that it is present in populations from different geographical regions (CAS and VEI from S2, and KAI from the central area). Q and AT are shared by two populations (TNT1 and TNT2, and CAS and VEI, respectively), although both are from the same (S2) phylogroup (Table I). Clade A includes additional sequences from other southern localities (plus one from KAI). Two populations (TNT1/2) have haplotypes that cluster within clade A or B. The API population, although belonging to the northern side of the species sampling sites, only shows two private haplotypes (AK and AM) that are nested within the central phylogroup (clade C). Indeed, the two populations closer to API, CAK and EMI (Fig. 1), have haplotypes clustered together to form clade D, and are well distinguished by those of the central populations (+API).
Bayesian phylogenetic tree of the analysed dataset (164 aligned sequences, plus two outgroups; length of sequences=612 bp). Haplotypes are labelled with one or two letter codes and with the tags of the corresponding population. Major clades are labelled A–D and are aligned with sampling locality (central, northern, southern (S1 and S2)). Clusters (1–5) obtained with landscape genetic analysis usually align with clades. The exception is BA-CAS that belongs to cluster 4, although it has been grouped with cluster 1 in the tree.
Analyses of mismatch distribution and demographic parameters
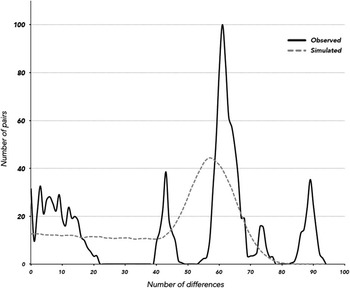
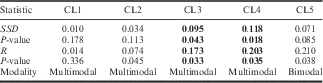
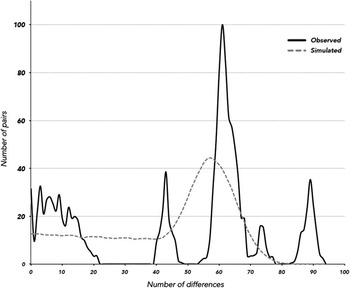
Comparisons of haplotype differences used for the MMD analysis showed a multimodal distribution overall (Fig. 4). When performed for each population (Table III), the MMD distribution is multi- or bimodal in 10 out of 15 populations, also showing high values of SSD and R; nevertheless, the raggedness index statistics failed to reject the alternative hypothesis of expansion (at P<0.02) for all samples except for TNT1 and TNT2 (Table III). Significant (P<0.02) values of SSD, not rejecting the null hypothesis of population expansion, were observed for: CAS, INI, SHN, TNT1 and TNT2. In this respect, despite the multimodal distribution of MMD pairwise comparisons, it is possible that the latter populations may have experienced a recent demographic expansion. When MMD analysis was performed using re-assembled sequences into clusters, the cluster 3 and cluster 4 SSD of MMD and raggedness indexes unambiguously suggested departure from the estimated model of demographic expansion (at P<0.05) (Table IV). Departure from the assumptions of neutral mutation-drift of populations has been tested by the calculation of Tajima’s D index. Haplotype sequences evolving under non-random processes are deemed credible (at P<0.05) only for BAR, SHN and TIG (D=-1.765, -1.630 and -1.741, respectively); with negative values of D implying the occurrence of rare alleles present at low frequencies and interpreted as signals of purifying selection and/or demographic expansion.
Mismatch distribution analysis of the pooled set of haplotype comparisons showing multimodal distribution. Dashed line represents simulated distribution for the estimated model of demographic expansion.
Mismatch distribution analysis of the C. terranovus populations.

τ=coefficient tau, T 1.5% =estimated time of expansion using 1.5% divergence Myr-1, T 2.3% =estimated time of expansion using 2.3% divergence Myr-1, θ 0 =theta (4N e μ) at pre-expansion, θ 1 =theta at post-expansion, SSD=sum of squared deviations, R=raggedness index.
Significant values highlighted in bold (at P<0.02).
Demographic parameters for each population represented by the calculated distribution.
For the population abbreviations see Table I.
Mismatch distribution analysis performed using re-assembled sequences into clusters.
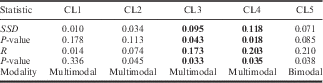
SSD=sum of squared deviations, R=raggedness index.
Significant values highlighted in bold at P<0.05.
Bayesian clustering method and landscape genetic parameters
Hierarchical clustering of haplotypes, obtained under a Bayesian approach, reveals a subdivision of samples into clusters with similar evolutionary links, in agreement with the branching pattern observed in the phylogenetic tree. Individual level mixture analysis supports (among the ten best visited partitions) the clustering of the 164 sequences into five groups (Fig. 1; Table S3 found at http://dx.doi.org/10.1017/S0954102016000730) (log marginal likelihood for the optimal partition: -3431.768). These latter sets of haplotypes are distributed according to a geographical pattern and largely overlap with clades A–D of the phylogenetic tree. The major difference among clades and clusters is that clade A is divided into two clusters (1 and 4) (Fig. 3). Clusters 1, 4 and 5 have haplotypes present in the same southern localities (Fig. 1). Cluster 1 also has one haplotype (AJ) shared with the central population of KAI (Fig. 1), and another (BA-CAS) that the Bayesian clustering method assigned to cluster 4, although in the phylogenetic tree appears to be nested within cluster 1. The private haplotype (U) from TNTB groups with cluster 5 and is assumed to be nested also within clusters 1 and 4, as with neighbour populations TNT1/2 (Fig. 3). Haplotypes from API are included within cluster 2, which only contains haplotypes from central localities (Fig. 3). Five populations have haplotypes shared by two or three clusters (CL1+CL2 in KAI, CL1+CL4 in CAS and INI, CL1+CL4+CL5 in TNT1/2) (Table I). Cluster 5 is nested within cluster 4, whereas both of them are also included in cluster 1.
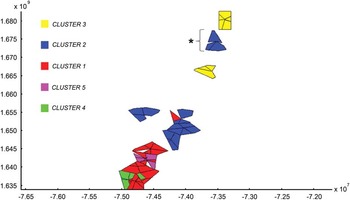
The genetic shape of the estimated haplotype clusters is plotted in the Voronoi partition graph (Fig. 5), where the mutual probability that any two organisms belong to the same cluster declines with the geographical distance between their sample localities. Each cell of the tessellation delimits points closer to the seed arranged in a Euclidean space, and coloured according to the cluster membership. Seeds are obtained by plotting geographical co-ordinates of populations. Southern individuals (S1 and S2) are arranged into three clusters (1, 4 and 5), with one tile of cluster 1 nested within cluster 2 tiling, which corresponds to the central populations. Cluster 3 includes northern samples, with the only exception being those collected in API, whose association with the central sampling area is again confirmed. Despite the geographical subdivision of haplotypes, specimens from different localities are morphologically indistinguishable (data not shown), as has been observed in other Antarctic cryptic species of springtail (e.g. in F. grisea).
Voronoi diagram of the analysed set of sequences. Each tessellation corresponding to the assigned cluster and labelled with a different colour. Axes represent the geographical co-ordinates. Apostrophe Island tiles are identified by an asterisk.

The AMOVA analysis of the populations, separated into clusters, suggests non-random distribution of haplotypes within groups (P<0.05). The presumed time since expansion was calculated for each population using the population demographic parameters τ and θ (Table III). Estimated times all pre-date the LGM (≈20ka), with the highest values observed for two populations TNT1/2, whose expansion is dated >400 000 years ago (Table III). These latter results are in agreement with the estimated time of differentiation of each cluster, calculated using the molecular clock (see below).
Estimates of divergence time
Percentage of average number of pairwise differences between clusters range from 14.5% (cluster 3 vs cluster 5) to 2.6% (cluster 2 vs cluster 3). Molecular clock estimates, using the percentage variability proposed for arthropods (1.5–2.3% divergence Myr-1) and calculated on average pairwise differences between one of the earliest (cluster 5) and the latest (clusters 2 and 3) evolutionary branches of the phylogenetic tree (Fig. 3), dates the differentiation of all C. terranovus groups to 6.3–9.7 Myr, corresponding to the late Miocene. Within clusters, divergence time ranges within Pleistocene timescales, from 0.3–0.4 Myr for cluster 3 (0.08% average pairwise distance) to 0.9–0.58 Myr (1.33% average pairwise distance) for cluster 5.
Discussion
It is now agreed that well-defined climatological, geological and physical factors are responsible for the strong genetic structure observed in most Antarctic species, including springtails (Convey et al. Reference Convey, Chown, Clarke, Barnes, Bokhorst, Cummings, Ducklow, Frati, Green, Gordon, Griffiths, Howard-Williams, Huiskes, Laybourn-Parry, Lyons, McMinn, Morley, Peck, Quesada, Robinson, Schiaparelli and Wall2014). Molecular clock data support the view that several of them (e.g. Cryptopygus antarcticus Willem, F. grisea, Gomphiocephalus hodgsoni Carpenter and Kaylathalia klovstadi (Carpenter)) survived the LGM in ice-free refugia and recolonized the terrestrial environment upon ice retreat (Stevens et al. Reference Stevens, Greenslade, Hogg and Sunnucks2006, McGaughran et al. Reference McGaughran, Torricelli, Carapelli, Frati, Stevens, Convey and Hogg2010, Reference McGaughran, Stevens, Hogg and Carapelli2011, Torricelli et al. Reference Torricelli, Frati, Convey, Telford and Carapelli2010). Therefore, most species, once believed to be recent (post-glacial) colonizers, are now considered as long-term residents of the Antarctic ecosystem. Their distribution is limited at the spatial and ecological scale, with the majority of species exhibiting extreme regionalization and within-sector endemism (Chown & Convey Reference Chown and Convey2007, Convey et al. Reference Convey, Stevens, Hodgson, Smellie, Hillenbrand, Barnes, Clarke, Pugh, Linse and Cary2009).
As with other Antarctic species of the terrestrial ecosystem, the high intraspecific differentiation found in C. terranovus may be the result of evolutionary events that acted well before the LGM. The presence of major C. terranovus phylogroups within the continent, at least since the late Miocene, is supported by molecular clock data; although the observed high genetic differentiation levels would also suggest that the species may have been present in Antarctica even earlier. The tundra habitat that persisted in the Transantarctic Mountains until the early Miocene is probably where the Antarctic terrestrial invertebrates of Gondwanan origin, such as C. terranovus, have survived and more recently dispersed, during the interglacials. The substantial lack of haplotype sharing between populations of C. terranovus and the high levels of h and π, support the existence of evolutionary lineages (clusters) that are either almost completely isolated from each other, even at the local scale, or live in sympatry. The negligible number of shared haplotypes has been observed in other springtail species with similar distribution to C. terranovus, such as K. klovstadi (Stevens et al. Reference Stevens, Frati, McGaughran, Spinsanti and Hogg2007, McGaughran et al. Reference McGaughran, Stevens, Hogg and Carapelli2011). The haplotype diversity (h) (Nei Reference Nei1987) is a measure of the uniqueness of a given haplotype within the sample; the greater it is, the more polymorphic the population. Furthermore, the nucleotide diversity (π) (Nei & Li Reference Nei and Li1979) is the same measure applied to nucleotide positions of an aligned set of DNA sequences. These diversity indexes, calculated for the bar code fragment of cox1, are considerably variable among animals, with the highest values reported to date (mean h=0.962, mean π=0.010) observed in the crustacean species Euphausia superba Dana (Goodall-Copestake et al. Reference Goodall-Copestake, Tarling and Murphy2012). If these estimates are used as a cutoff to evaluate high and low diversity range, we can summarize that most of the C. terranovus populations (especially those from the southern localities) have high values of both diversity parameters, with the population of CAS displaying the highest values of haplotype diversity (h=0.978±0.054) and KAI showing the highest values of π (0.027±0.015). Notably, calculations of the same parameters, when haplotypes are grouped into their five clusters (instead of the populations), provide high measures (h=0.843±0.961, π=0.009±0.013), although lower than those of the CAS population. The high nucleotide and haplotype diversity values (observed in the southern localities) could be explained by potentially accelerated mutational rates or artificial inflation by the presence of cryptic species.
In most cases, the genetic structuring in clusters of northern and central C. terranovus populations, follows a geographical pattern, whereas an even greater subdivision (clusters 1, 4 and 5) is observed for the southern populations, where multiple lineages live sympatrically. The present genetic structure of the species might be the result of the combination of events (isolation, divergence, recolonization and expansion) that occurred during the last glacial and post-glacial cycles. Geographical barriers, such as the many glaciers of Victoria Land, may have subsequently prevented gene flow between established and isolated groups. Although active and passive dispersal mechanisms are possible in Collembola (i.e. by rafting or zoochory), the lack of wings and a cuticle resistant to dehydration are probably the major factors that prevent specimen transfer over long distances (Hawes et al. Reference Hawes, Worland, Bale and Convey2008). Therefore, when attempts to disperse were successful, the migrant population (and its selection of haplotypes thereof) established in one locality that probably never received additional specimens from elsewhere. The highest divergence (p-distance) observed between cox1 haplotypes of C. terranovus (15%) is in the range of the values found in comparisons between C. terranovus, C. cisantarcticus and F. octooculata (17–19%), and higher than that calculated for other Antarctic springtails, such as G. hodgsoni (2.5%) or C. antarcticus (9.2%) (McGaughran et al. Reference McGaughran, Hogg and Stevens2008). Average divergence among clusters of C. terranovus ranges between 1% (cluster 2 vs cluster 3) and 13% (cluster 5 vs cluster 2 and vs cluster 3). These data demonstrate that evolutionary changes of morphological and genetic traits are running at different speeds, as has been observed in other collembolan species of the continent, such as C. antarcticus (Stevens et al. Reference Stevens, Greenslade, Hogg and Sunnucks2006) and F. grisea (Torricelli et al. Reference Torricelli, Frati, Convey, Telford and Carapelli2010). In addition, the high levels of genetic divergence between haplotypes might be the result of inter- rather than intraspecific comparisons. Thus, the different phylogroups might represent lineages of a species complex or correspond to as many cryptic species. Therefore, species boundaries should be eventually confirmed through the identification of those diagnostic characters useful for a taxonomic key.
The phylogenetic hypothesis and the cluster analysis provided in this study support the existence of well-defined phylogroups that are consistent with the geographical distribution of the populations in central Victoria Land. Clusters of haplotypes and allele combinations in allozyme screening (Fanciulli et al. Reference Fanciulli, Summa, Dallai and Frati2001) are distinct to both groups of populations and geographical regions, as validated by the Mantel’s test; the only discordant exceptions to this pattern are the specimens of API that are genetically more closely related to populations from the central areas than neighbouring populations in the northern zone (Fanciulli et al. Reference Fanciulli, Summa, Dallai and Frati2001).
The demographic expansion rates of the C. terranovus populations are controversial given the substantial lack of support for most of the estimated Tajima’s D values. However, the few validated values, observed for some populations, would point to deviations from the null hypothesis of neutrality of substitution types and demographic equilibrium. Otherwise, the rejection of the null hypothesis observed in some invertebrate taxa may be dependent upon the dissimilar taxon-specific (not necessarily at the species level) diversity of the mitochondrial genes, with selective sweeps of purifying forces acting to balance their high mutation rate. In any event, population expansion or equilibrium of the demographic rates are difficult to estimate for a taxon with such a strong genetic structure and with separated phylogroups living in sympatry. Furthermore, estimates of population expansion dates can be inaccurate if the generation time (from egg to egg) for the species is incorrect. The impact of ancient gene pools may be more relevant in continental species (vs maritime ones) where harsher and more demanding environmental conditions reduce the success of early colonization events and induce a more conservative growth rate (McGaughran et al. Reference McGaughran, Torricelli, Carapelli, Frati, Stevens, Convey and Hogg2010).
Antarctic springtails may have diverged at longer timescales than previously thought, with some differentiation events estimated to have occurred in the late-mid-Miocene, after the isolation of the continent from other landmasses was complete (Stevens et al. Reference Stevens, Greenslade, Hogg and Sunnucks2006). Present species composition could therefore represent remnants of a denser Gondwanan biota that survived the glacial cycles in refugia of both Continental or Maritime Antarctica. In this respect, the Dry Valleys and the Transantarctic Mountains are candidate shelter sites for hosting glacial refugia, as geochronological data have demonstrated the presence of ice-free areas in these sites during the past glacial cycles. Molecular clock analysis suggests ancient C. terranovus genetic lineages had already differentiated before the LGM. The effects of the past glacial cycles would therefore probably be limited to the ‘selection’ of which survivor group had a chance to recolonize the environment upon ice melting. As already proposed by Hawes et al. (Reference Hawes, Torricelli and Stevens2010), ecological factors may have also influenced the present distribution of C. terranovus populations. On a smaller scale, freshwater bodies and ponds, fundamental for survival, may have attracted groups of specimens and promoted short-distance transfer by means of glacier meltwater streams. On the other hand, long-range passive dispersal is considered unlikely, although not impossible through avian or human phoresy (Stevens & Hogg Reference Stevens and Hogg2003). In addition, this region of Victoria Land has undergone extensive geological rearrangement due to the activity of the Melbourne volcano, with potential for influencing the distribution of terrestrial invertebrates in the whole area. This geothermal activity may have also permitted the survival of the C. terranovus populations during the recent glacial cycles in multiple refugia. Recolonization of the available coastal habitats upon ice retreats from ‘local’ separate sites (rather than from single nunataks at lower or higher altitudes) appears to be more likely for a species endemic to Victoria Land and with a limited dispersal ability.
Conclusion
In summary, the results from this study suggest that C. terranovus is a relict species already resident in the Antarctic continent before the LGM. The fragmented and isolated populations have very different haplotype pools that are related in clusters, which may or may not correspond to specific geographical sectors. Their different origin from separate glacial refugia and the lack of gene flow between sites support the existence of an intraspecific level of genetic differentiation similar to that observed between other collembolan species and support the existence of at least four phylogroups, whose taxonomic status should be explored more deeply.
Acknowledgements
This work was funded by the Italian PNRA and the Italian MIUR (PRIN). Partial support was also provided by the University of Siena. We thank Prof Bettine van Vuuren and another anonymous reviewer for their constructive and helpful comments. We also thank Dr Nicola Iannotti for his collaboration with the collection of data and Prof Giuseppe Manganelli for helpful comments on the taxonomy of the species. All the authors declare no conflicts of interest, approve the draft of the manuscript.
Author contribution
AC collected the material, performed the molecular and bioinformatics analyses and drafted the manuscript. CL assisted with the experiments for the molecular analysis and contributed to the biogeographical analysis. FF co-ordinated the research team and contributed to drafting of the manuscript.
Supplemental material
Three supplemental tables will be found at http://dx.doi.org/10.1017/S0954102016000730.