Introduction
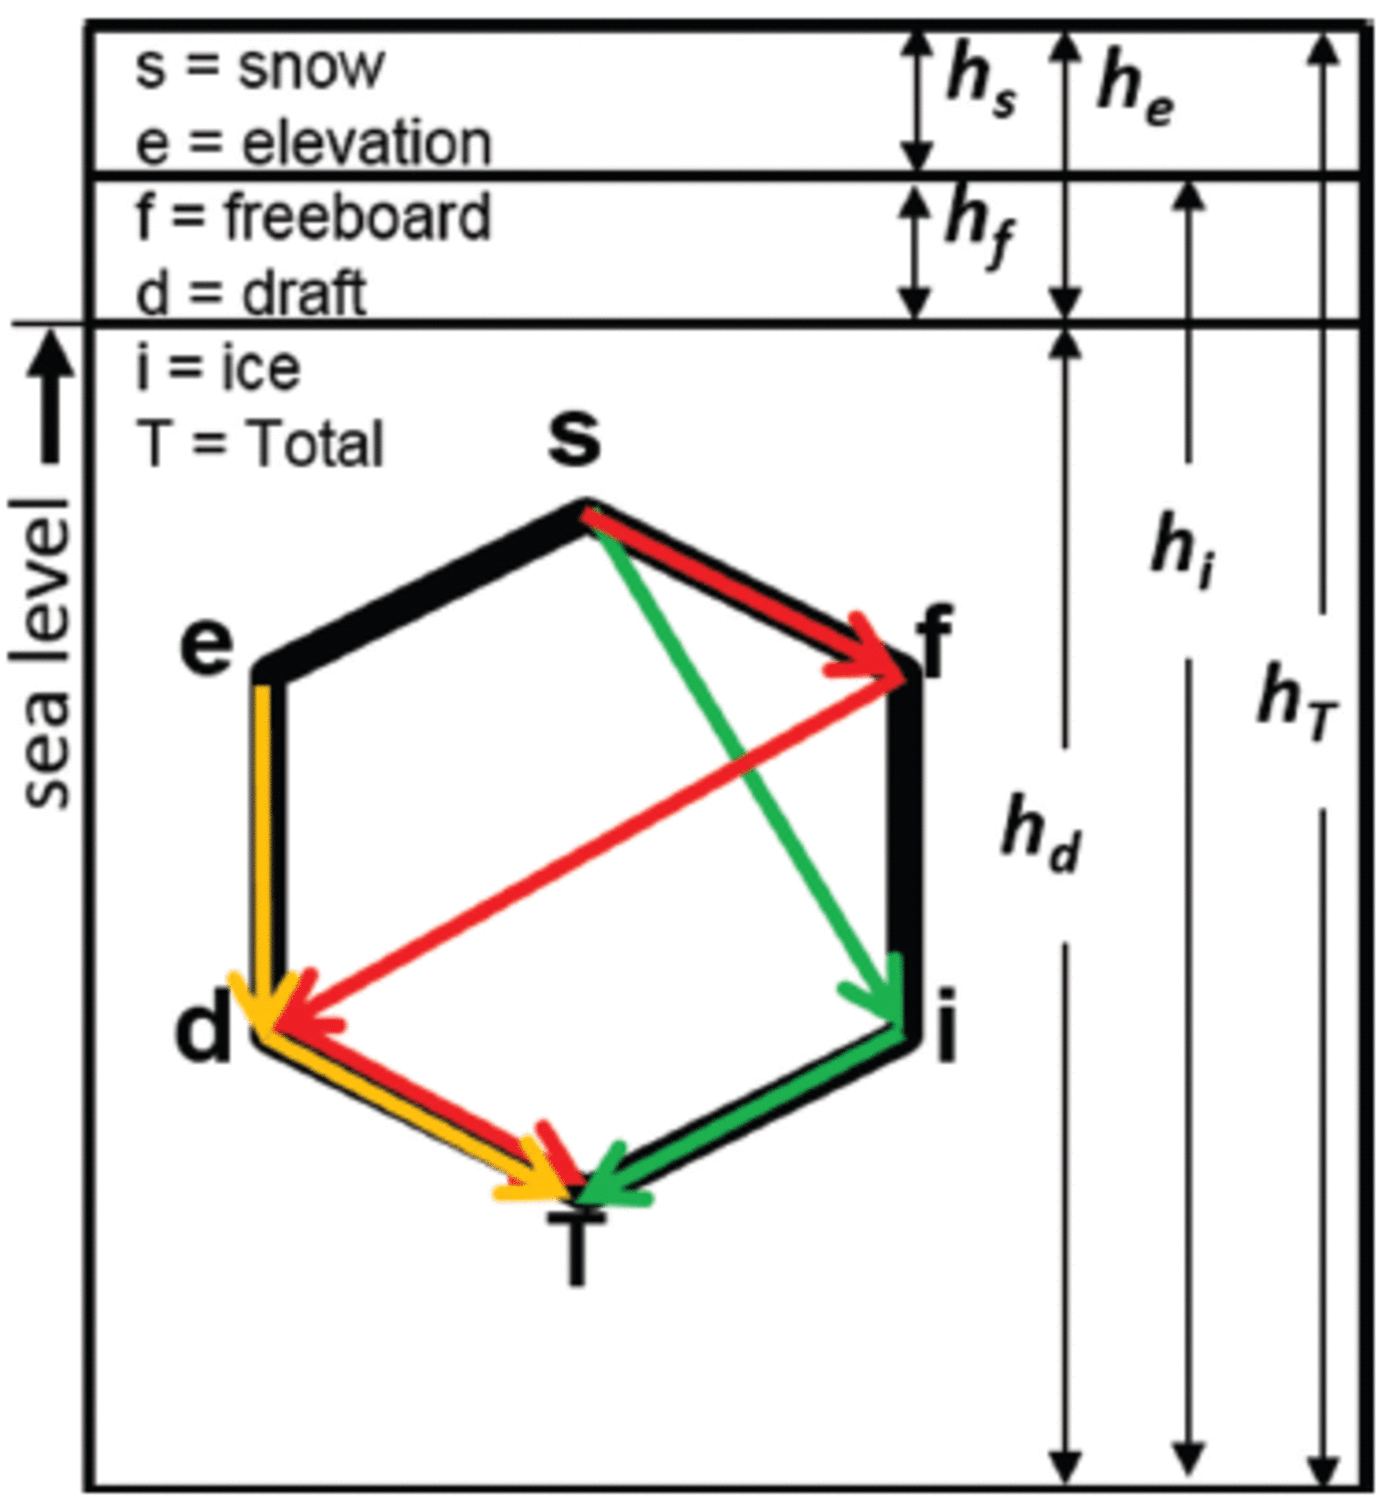
Sea-ice isostasy is a vertical buoyancy balance where a mass per unit volume of sea water supports sea ice and snow. Reference Untersteiner and UntersteinerUntersteiner (1986) and Reference Eicken, Gradinger, Salganek, Shirasawa, Perovich and LeppärantaEicken and others (2009) summarize a range of instruments capable of measuring the related thickness components of snow depth (hs), submerged snow ice (hsi), ice freeboard (hf), surface elevation (he equal to any snow plus ice freeboard), ice draft (hd), ice thickness (hi equal to freeboard plus draft) and total thickness (hT equal to everything from the top of any snow to the bottom of the ice). All variables just described can be measured directly with existing field instruments in one location (Fig. 1), while underwater, airborne and spaceborne platforms must derive missing terms through the assumption of an isostatic balance, often by way of a so-called R-factor described by Reference Wadhams, Tucker, Krabill and SwiftWadhams and others (1992). The R-factor is essentially a ratio of thickness below (hd) and above sea level (he) expressed as

Sea-ice thickness variables and their relationships. Vertical schematic shown with total thickness (T) comprising a composite of cryospheric materials at the air–sea interface. Different-colored pathways abstractly describe possible combinations. Pathways are chosen based on instruments and processing algorithms.
Here ρT denotes a bulk density for the full vertical column of snow and ice (i.e. total thickness hT) and p w refers to the bulk density of nearby water on which the ice is assumed to be free-floating.
When practical, the R-factor is based on calibration and validation from nearby field measurements. But for areas as large as the Arctic basin or Southern Ocean, airborne and spaceborne programs are needed to cover the area in a short time. In Reference Richter-MengeRichter-Menge and Farrell (2013), thickness estimates are not derived from an R-factor directly but through an isostatic relationship (e.g. eqn (14) in Reference KurtzKurtz and others, 2013) between sea-ice thickness, freeboard and snow depth, with mean densities for ice, water and snow of 915 ± 10 kg m– 3,1024 kg m–3 and 320 ± 100 kg m–3respectively. Uncertainty estimates for these mean values are often taken from climatology (e.g. Warren and others, 1999).
In contrast to this large-scale approach, coincident airborne and underwater measurements provide point-to-point observations of draft to elevation at meter-scale resolution (e.g. Reference Doble, Skouroup and WadhamsDoble and others, 2011). Such datasets are very few in number, very expensive to collect, but extremely valuable because they show spatial and temporal variability ranging widely depending on the length scale of measurements, proportions of ice types, snow composition and underlying water masses. Differences between large-scale approximations and small-scale observations seem, at first, like quaint academic exercises until one realizes that both datasets are used in global climate projections. The large-scale datasets provide estimates of sea-ice mass-balance changes, while the small-scale datasets provide parameterizations for properties and processes that drive forecasting and climate-projection models. All of these resources influence the decisions of major human activities and political discourse. Hence, there are many growing reasons to resolve any disconnect between large-scale assumptions and small-scale observations of sea-ice thickness, especially relationships involving isostasy. In this paper, we address this important topic by examining the uncertainties of isostasy.
We begin by identifying the three largest sources of variability. First, snow density (ρs) has a larger range than mean climatological deviations with variability of order 100% (e.g. ρs ∼ 3 0 0 ± 3 0 0 kgm–3) based on direct measurements (e.g. Reference SturmSturm and others, 2006; Weeks, 2010). Second, the difference between densities of sea water and sea ice (i.e. pw-pi) is high. This seems an unlikely source at first since sea-water surface density varies little (e.g. 1022 ± 5 kg m– 3 in the SEDNA archive discussed later), < 1 % relative difference. However, the compiled work on densities by Reference TimcoTimco and Frederking (1996) found sea-ice density (pi) between 720 and 940 kg m– 3 (or <25% relative difference), with an average value of 910 kg m–3. First-year (FY) sea ice varies from 840 to 910 kg m– 3 above the waterline, and from 900 to 940 kg m– 3 below the waterline. Using the rough ranges above, the difference between highest water density and smallest ice density reported here is roughly the same size as snow density variability (e.g. 1027-720 = 307 kgm–3), with the range of differences similar to snow density variability (e.g. differences between 77 and 307 kg m– 3 using example numbers above), especially in summer when ice density values decrease as the ice decays structurally during the melting process (Reference BarberBarber, 2005; Reference TimcoTimco and Weeks, 2010). Additionally, densities are not normally distributed locally (e.g. Reference TimcoTimco and Frederking, 1996; Weeks, 2010) and hence are difficult to parameterize with standard statistics. In short, density values are highly variable in time and space, and not represented well using a climatological mean with associated normally distributed variance. Furthermore, at any time of the year, sea ice may contain voids where sea water intrudes, especially in unconsolidated first-year deformed (FYD) ice (i.e. newly formed ridges), with brine channels being the small-scale voids that contain considerable sea water at strongly varying high salinities. Hence, the intrinsic material property of density for all three materials (snow, ice, water) is responsible for the largest uncertainties in any buoyancy calculations. Most importantly, there is currently no systematic way to non-invasively measure density, with invasive methods being time-consuming and sparse compared to measurements of thickness and area.
The last issue is the validity of isostasy itself. While an isostatic balance for ice exists at some length scale (Reference TimcoTimco and Frederking, 1996), that length scale is not understood, nor do we have a way of characterizing such length scales. Isostasy is a steady-state balance assumed to be more or less true away from pressure ridges and actively deforming features (e.g. Reference HopkinsHopkins 1994). But sea-ice thickness is sampled (e.g. Reference WadhamsWadhams, 1981, Reference Wadhams2000) with the largest mass found in the ridged and deformed ice. Additionally, as soon as ice concentrations at any length scale begin to approach 80%, a history of mechanical processes invokes lateral ice forces which deform the ice in three dimensions (3-D) through bending, buckling, cracking, folding, grinding, rafting, ridging, shearing and twisting (Reference Thorndike, Rothrock and ColonyThorndike and others, 1975). The history of these processes is captured in ice shapes that differentially slide over a slippery ice–water interface below, while sticking together by freezing air temperatures above. In this way, deformation processes work and rework sea-ice thickness over different length scales and re-establish isostasy after each deformation event based on integrated lateral and vertical interlocking forces over many length scales (i.e. potentially scale-invariant; Reference Hopkins and FrankensteinHopkins and others, 2004). Therefore, there are a number of non-isostatic processes that are non-stationary and large enough to augment thermodynamically grown ice, of order 1–2 m a–1into several possible non-Gaussian (i.e. skewed) thickness distributions (e.g. Reference GeigerGeiger and others, 2011). Long distribution tails can easily reach and exceed ten times thermodynamic vertical growth. As a result, processes such as sea-ice deformation and drifting snow complicate isostatic balance at largely unknown and time-varying length scales based on a combination of factors not yet fully understood. Therefore, a strategic starting point begins with a review of the underlying principles and their associated uncertainties.
Fundamentally, the underlying premise begins with the basic principle that ice floats. For simplicity, let us consider arctic sea ice which is often composed of columnar ice. Columnar ice looks like tiny hexagonal vertical columns, with a useful surrogate in an academic setting being that of the traditional wooden hexagon-beveled pencil. If we imagine a bundle of unsharpened pencils of different lengths then we can visualize holding that bundle in one hand with all the pencils next to each other. We can use the fingers on our other hand to push on the ends of individual pencils. This is possible because the pencils are nearly independent of each other. The hand holding the pencils is applying a force which creates friction that holds the pencils together. When we loosen our grip, we apply less force and this makes it easier to slide each pencil along the others. This interesting toy model lets us create different surfaces based on the position of the top and bottom ends of the pencils relative to each other. We can also apply one common force to move all the pencils up or down together. Essentially, we are working with a physical model which satisfies Newton's laws which explain how forces balance and, more specifically, the case of lateral and gravitational forces – the latter associated with Archimedes' principle of buoyancy.
For real sea ice, there is an added complication that every piece of ice is partly glued to its neighbors. Some ice pieces are subject to deformation through lateral forces while others are pushed up or down due to snow which is falling, blowing and redistributing in large amounts on top of the ice which is floating on sea water. In such cases, isostatic balance does not act on a point-by-point basis because sea ice is an integrated solid material. Instead, sea ice floats freely on sea water with an averaged interconnected balance which is valid over some length scale (L). Unlike the pencil model, the isostatic balance of sea ice includes different materials with different densities, with sea water being the heaviest followed by sea ice, then snow. The density is critical to the buoyancy force balance because buoyancy acts in the vertical direction where gravity pulls heavier materials downward, thereby allowing lighter sea ice to float on sea water.
Through similar analogies, we begin to understand why there is a large range of R-factors found by Reference Doble, Skouroup and WadhamsDoble and others (2011) when analyzing small-scale (<1m footprint) measurements collected with a multibeam sonar. At larger scales, such as those described by Reference Wadhams, Tucker, Krabill and SwiftWadhams and others (1992), R-factors are computed by matching overall probability density functions of freeboard and draft over long distances. The only way to currently compare results found by Reference Doble, Skouroup and WadhamsDoble and others (2011) with those by Reference Wadhams, Tucker, Krabill and SwiftWadhams and others (1992) is to take a mean R-factor from all the measurements reported in Reference Doble, Skouroup and WadhamsDoble and others (2011). Unfortunately, the averaging process removes much of the natural variability needed to understand the processes and length scales associated with isostasy (e.g. Reference Geiger, Samluk and MengeGeiger and others, 2015).
Given the complexity of the situation, we examine isostasy in this paper from a scaling perspective. Multiple instruments are clearly needed to create effective data-fused products, but effective approximations are needed because most direct measurements are invasive and disrupt the material being measured (e.g. drilling). We begin by expanding upon the underlying traditional mathematical premise. We incorporate error propagation to evaluate the full range of values rather than mean estimates. Because many of the variables are not normally distributed, there is much to be learned by quantifying natural variations at different scales with different instrument combinations. Next, we evaluate sample data from three different scales as case studies to determine effective combinations which minimize uncertainties given assumptions made. Finally, we reassess current thinking and outline a new approach which takes into account scale as well as measurement practices.
Mathematical Premise
Consider a mass of free-floating ice (m i) over a horizontal area (A) with the possibility of snow cover either above sea level (m s) or subject to flooding and refreezing below sea level (m si). This mass is in isostatic balance with the surrounding sea water and will displace a certain mass of sea water (m w) through the relation m w = m i + m si + m s : When the area observed is not free-floating, there are 3-D pressures and shearing forces from surrounding structures (e.g. ice, land, waves or tidal surface gradients, etc.). The vertical component of these forces (Fz ) works with or against gravity (g) to push the floating solid material up or down. Here we define the vertical displacement due to deformation from such forces as Ж (pronounced ‘zjey’) and express the vertical balance of sea ice and snow on sea water through the mass per unit area mathematical relation
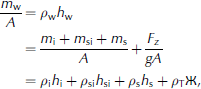
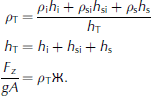
Here p is density and h is thickness, with subscripts w, i, s, si and T representing water, ice, snow, snow ice and total, respectively (Fig. 1). Applying terms defined within sea-ice literature (e.g. Reference Eicken, Gradinger, Salganek, Shirasawa, Perovich and LeppärantaEicken and others, 2009), we use sea level (z = 0) to delineate ice draft (hd) from ice freeboard (hf), with ice thickness (h i) equal to the draft plus freeboard. For completeness, we identify elevation (he) equal to any snow plus freeboard. We also identify the term snow ice (subscript si) as the flooding and freezing of snow into ice (as is often the case for Antarctic sea ice).
For simplicity in this paper, we assume an Arctic situation where snow ice is negligible. Subsequently, we reorganize our balance into typical arctic thickness combinations (Fig. 1) by substituting hd = hw and hd + hf = hi and noting that p e is bulk density for elevation as a weighted average of snow and freeboard ice such that

Using principles of error propagation (e.g. Reference GeigerGeiger, 2006), we expand each term in Eqn (4) into a central-tendency value (denoted by a bar over a variable) and an uncertainty range (denoted with A). We take care not to restrict uncertainties to a normal distribution by identifying a distinct lower and upper bound for each variable, especially since both thickness and density are known for their lack of symmetry about a mean value. At length scales (L) where isostasy is assumed valid, we set Ж (L) = 0. In this way, Eqn (4) expresses solutions in a form typically seen in the literature (e.g. Eqn (1)) for central-tendency solutions for the R-factor (R) plus or minus variability. Mathematically, this is expressed as (details in Eqns (A1-A3) in Appendix)

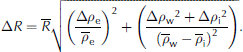
Two related factors are similarly derived for ratios of total thickness-to-draft and total thickness-to-elevation with the same propagated uncertainty as Eqn (6).


where subscripts T/D and T/E signify total-to-draft and total-to-elevation respectively. Unlike Eqn (5), Eqns (7) and (8) do not have independent numerator and denominator, but they do provide the practical relationships often invoked for underwater, airborne and spaceborne measurements which use these relationships to estimate a total thickness based on some proportion of measured draft or elevation. In subsequent sections, we invoke different combinations of variables using Eqns (5–8) to determine which solutions provide the least uncertainty. Our goal with such a formulation is to identify the most accurate pathways (Fig. 1) to improve data collection strategies.
Methodology
We use an archive from the International Polar Year field experiment called the Sea-ice Experiment: Dynamic Nature of the Arctic (SEDNA; Reference HutchingsHutchings and others, 2008, Reference Hutchings2011). Specific data include regional submarine upward-looking sonar returns (Reference GeigerGeiger and others, 2011; Reference Wadhams, Hughes and RodriguesWadhams and others, 2011), electromagnetic (EM) induction sea-ice thickness retrievals using a Geonics EM-31-MK2 (hereafter referred to as EM-31), snow depth using a MagnaProbe (Reference SturmSturm and others, 2006), snow density measurements and drilled holes (Fig. 2 and 3).
Submarine survey. (a) Geographic region with RADARSAT-1 image centered on ice camp on 18 March 2007. Multi-year ice depicted by whiter pixels, first-year ice by darker pixels. Ice cover is nearly 100% concentration with very narrow leads of open water which refreeze quickly. Red box identifies the study area shown in (b). (b) Submarine tracks superimposed on small section of RADARSAT-1 image from (a). Hours of the day on 18 March 2007 (in UTC) segmented (by color) for the submarine track. Arrows bear true north.

Arctic ice camp survey. (a) Lines superimposed on photograph taken from light-wing aircraft at oblique angle over 1000 m long legs. Conditions during the thickness survey from 1 to 7 April 2007 are well represented, with no open water along any leg. Arrow bearing true north. (b) Camp layout with 8ft (2.44m) tall plywood huts for scale reference. (Photograph by Bruce Elder, CRREL.)

Data processing
The camp layout (Fig. 3) provides a reference of ice structures for (1) drillhole validation sites at the point scale, (2) EM thickness profiles at intermediate scale with 5 m spacing over 6 km long spokes, and (3) submarine upward-looking sonar profiles (Fig. 2) spanning the regional scale. Submarine sonar measurements were bound within a survey box of length 20 km (2 x 10⁴m) on each side (Fig. 2b) and include five passes through the camp survey area including one pass beneath line 7 (Fig. 3a). All three datasets were collected within 2 weeks of each other. Data collected and analyzed during the ice camp from 3 to 7 April are considered coincident measurements because the thickness array did not deform noticeably during that 4 day window based on direct and airborne observations. The submarine data, however, were collected 2 weeks prior to the field camp. The time frame from end of March to beginning of April is too short to be noticeably different in terms of thermodynamic growth or melt, but certainly different at point-by-point locations due to deformation processes. It is for this reason that a statistical approach is used to relate submarine results to ice camp measurements with these two datasets considered quasi-coincident.
Data-processing methods are provided below, with each measured value reported with its uncertainty which is propagated into subsequent calculations. Density values are known explicitly for a few points for snow but inferred from the ranges cited in the introduction otherwise. Ice density is only inferred from cited ranges, while water density (1022 ± 5 kg m–3) is based on the range of time-varying conductivity-temperature-depth (CTD) measurements collected at the camp at 6hourly intervals in vertical profiles which rested at the surface before profiling the mixed layer to a maximum depth of 120 m (Reference HutchingsHutchings and others, 2011; specific data portal http://research.iarc.uaf.edu/SEDNA/dataport/CTD_Wilk/). Subsequently, we track the propagation of measurement uncertainty to test, for example, whether a term is normally distributed and the impact of range on calculations.
Point-scale isostasy testing
The goal at this scale is to test sensitivity of different combinations of thickness measurements to natural variability. Using a 0.10 m diameter drill, holes were made at various locations along the six survey lines (Fig. 3a) with properties of snow depth, ice thickness and ice freeboard measured to centimeter vertical accuracy (i.e. ±0.005 m). In this way, we have sufficient measurements to calculate R-factors directly using Eqns (5-8) with no need to introduce highly variable density terms and compare these to density-derived solutions. Since snow has a highly variable density, we include bulk snow density samples collected with a snow tube every 100 m along the survey lines with accuracies to ±0.005 m for thickness and weights to ±0.001 kg. At every 500 m, snow pits were dug with square samplers (32.4 and 97.2 x10⁻⁶m3 for small and large samplers, respectively) taken in individual layers and then integrated for a bulk density to compare with vertical tube measurements. For ice density, we estimate 900 ± 4 0 kg m– 3 and use the SEDNA archived water density values of 1022 ± 5 kg m– 3 . With these values, we compute the residual away from isostasy by solving Eqn (4) as follows:

with propagated uncertainty detailed in Eqns (A4-A7) in the Appendix.
EM thickness profiles
To increase data rate and scale, >1000 thickness values were collected. Two people walking in tandem with a MagnaProbe and EM-31 recorded snow depth and total thickness, respectively, at sampling intervals every 5 m along survey lines (Fig. 3a). During this transect survey, the EM-31 was carried like a tightrope walker’s balancing pole (i.e. perpendicular to the transect path) using a neck strap attached to the central data logger to maintain a steady height (z 0 = 1.00 ± 0.05 m) with the transmitter and receiver coils orientated in the vertical dipole mode. This device has measured sea-ice thickness for many years, with thickness sensitivities detailed, for example, by Reference KovacsKovacs (1975) and Reference McNeillMcNeill (1980). Side-by-side boot prints marked an EM-31 reading. The person carrying the MagnaProbe followed behind and placed the induction rod of the MagnaProbe into the snow in front of the boot markings on fresh snow. The MagnaProbe’s inductive unit was calibrated before each data collection segment by positioning the inductive coil at two known positions along the induction rod. Values were entered into the data logger to co-register an induction value with a distance along the MagnaProbe’s induction rod as in Reference SturmSturm and others (2006).
Summary of EM calibration coefficients
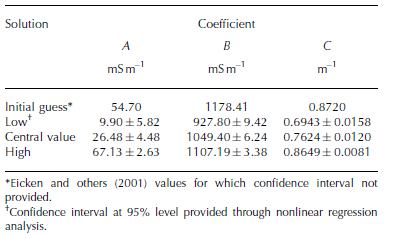
Following the survey, EM-31 samples were taken at calibration sites where drilled holes were made. The drilled holes included snow depth (with MagnaProbe) and ice thickness (with hand drill) both to centimeter accuracy (i.e. ±0.005 m). At some calibration locations, the EM-31 was held at two different heights (carrying height around 1 m and ground) to include beamwidth effects and orientation relative to local ice features. Subsequent data processing is done in two steps: (1) resolve thickness; and (2) identify isostatic components. First, the EM-31 requires calibration for which we choose an empirical exponential fit between a recorded apparent conductivity σa (mSm–1) and distance z. The distance z is between the instrument and a conductive material (sea water assumed in this study). The conversion equation used here follows Reference EickenEicken and others (2001) as

Here coefficients A, B and C are found using nonlinear regression (e.g. Reference PressPress and others, 2007). Nonlinear regression routines require input of a function, Eqn (10), a sequence of measured values for apparent conductivity and distance z, and an initial guess of coefficients, for which we use coefficients in Reference EickenEicken and others (2001). Once coefficients are found, the inverse solution

provides distance z between instrument and water surface at any site given known coefficients and input apparent conductivity values. Sea-ice thickness zi is determined subsequently by

Here z 0 is the distance between the instrument and the top surface (a mixture of snow and ice) while z s is the snow thickness from the MagnaProbe used in this study.
An exponential fit is increasingly sensitive with depth, but nonlinear regression analysis provides tight confidence intervals on mean slope and intercept values given any reasonable number of samples. Hence, we choose to perturb our calibration dataset into three sample sizes to estimate sensitivity beyond our drillhole capability. The first sampling includes all available pairings of drillhole data with EM-31 relative conductivity readings from which we compute a central-tendency set of coefficients (Table 1) and a fitted exponential curve. Next, we subsample the calibration data set into values which are below and above the central-tendency fit. Each of these two subsets is subsequently subject to nonlinear regression to generate two unique sets of coefficients which we call the low and high solutions (Table 1). This approach provides a very tight set of fitted curves where data values span the exponential fit (Fig. 5a, further below), but with a growing uncertainty beyond the data-availability range. Resulting thickness values are concatenated together to form a single thickness profile.
Resolving MagnaProbe and EM-31 measurements into isostatic estimates. (a) EM-31 calibration results relative to coincident drillhole values for different ice types of first-year (FY) ice, FY deformed (FYD) and multi-year (MY) ice. (b) Summary of ranges of R-factors from drillhole results to estimate water levels. (c, d) Best outcomes for R-factor using coupled set of isostatic relations in Eqn (13) with a large but realistic uncertainty based on natural variability largely from density uncertainty. Note that the individual isostatic solutions are as varied as all the possible drillhole approaches summarized in (b). Uncertainties shown with grey shading throughout at either the 95% confidence for computed values or as propagated ranges from input values. Uncertainties not shown in (c) because they range enormously and asymmetrically from <0.1m to >1m.

Isostasy calculations for these data are computed using a coupled set of equations to render the unmeasured terms of draft, freeboard, and elevation thickness (Fig. 1). Since there are insufficient known variables to test isostasy, we need to introduce an assumption. Counter to the point-scale tests earlier, we take the opposite, and currently traditional, approach, which hypothesizes that an EM footprint is of sufficient size L such that Ж(L) = 0. In other words, we assume that isostatic balance exists at a scale around 5 m which is the length scale of the sampling intervals based on the coil separation distance of the EM-31. We track the uncertainties to identify the solution pathways which render the smallest uncertainties starting from Eqn (9) and input directly measured snow and total thickness values:
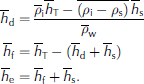
Such a solution is often the only practical option available, so we test this scenario to address best practices when invoking this approximation knowing that non-isostatic conditions are probably present but so are other complications which we show and discuss later.
Submarine upward-looking sonar profiles
Around 2 x 10⁵m (200 km) of sea-ice draft measurements were gathered by the Royal Navy submarine HMS Tireless in the vicinity of the ice camp on 18 March 2007 (Fig. 2). Processing was completed following Reference GeigerGeiger and others (2011), Wadhams and others (2011) and Reference WadhamsWadhams (2012). Mean ice draft values were subsequently added to the SEDNA archive (Reference HutchingsHutchings and others, 2011), with biases reported primarily from the sonar’s variable footprint due to the 3° beamwidth. For simplicity here, we use the reported submarine draft ‘as is’ to explore the variability of elevation values that may result given R-factor estimates derived from ice camp survey estimates of isostasy. In this way, we test the impact of propagated uncertainties when creating combined data products. As such, the submarine archive serves as an applied case study for consistency between scales within the region (Fig. 2). Similar statistical tests can be repeated with respect to satellite and airborne remote-sensing data and numerical models.
The relevant conversions are as follows. First, we construct thickness distributions of total thickness and draft for ice camp in situ measurements. We identify the mode of the distributions of total thickness and draft, and subsequently construct a ratio between these modes to compute the total-to-draft R-factor following Eqn (7). We apply the computed R-factor to the submarine draft to estimate a total thickness and elevation for submarine results. We call this approach the ‘thermodynamic-mode solution’ as in Reference GeigerGeiger and others (2011). This solution is preferred because the primary mode during the SEDNA experiment corresponds to first-year level ice and its accumulated snow cover. Thermodynamically grown ice can be approximated with a degree-day algorithm, and precipitation on level ice is far less variable than on deformed ice types. These two factors support a statistical solution with low uncertainties relative to most approximations currently used. Later on, we compare this thermodynamic solution to low, central-tendency and high R-factor solutions based on slopes derived from isostasy solutions from drillhole data using the relation

The submarine case study examines elevation solutions for two reasons. First, draft is the larger value such that variations in elevation are expected to be small in comparison to airborne and spaceborne retrievals where elevation errors will propagate to larger draft errors. Second, we can directly compare the elevation from submarine thickness retrievals in the area of the ice camp and ascertain regional consistency. We do this by comparing the elevation results of the entire area traversed by the submarine with the portions which passed through the area surveyed during the ice camp. Similar comparisons already provide strong agreement for draft and total thickness of this same dataset (Reference GeigerGeiger and others, 2011).
Results
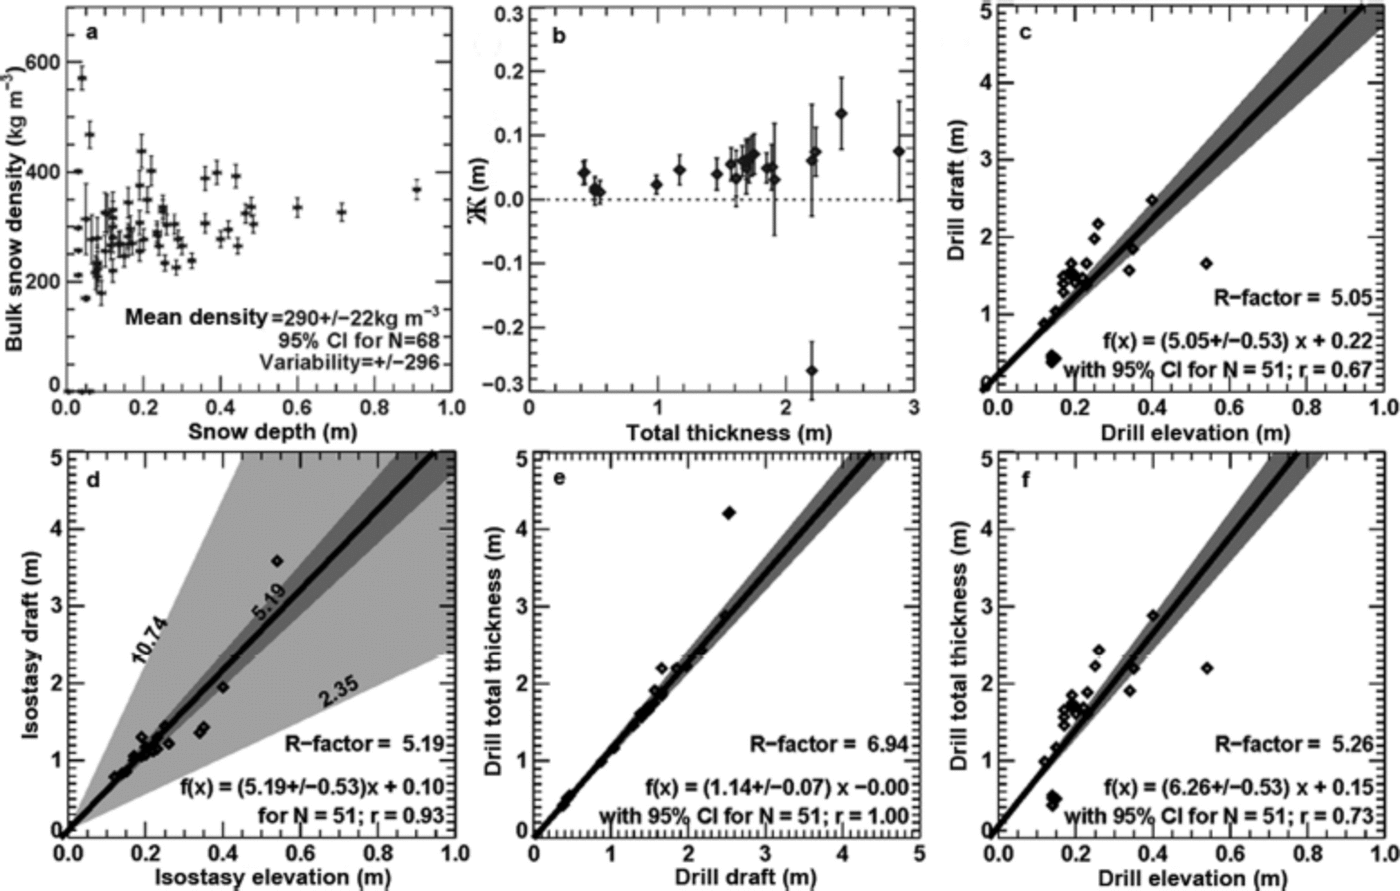
Measured snow density values vary the most within snow-pit layers, with depth-hoar values at the ice-snow interface as low as 37kgm–3 and hard wind-blown surface densities as large as 647 kg m–3. Bulk snow measurements and integrated snow-pit density distribute with a Gaussian shape about a mean value of 290 ± 2 2 kg m–3 (Fig. 4a). Drillhole measurements are not in isostatic equilibrium (Fig. 4b), with residuals pushed upward above neutral in all but one case where freeboard is significantly suppressed. The results reported here are only one prototype case study with 50 points, but the residual test demonstrates the ability to test isostasy from in situ measurements. Intuitively, non-isostatic balance makes sense at the point scale, but we need to consider what this means relative to instruments at larger scales. Hence, we estimate R-factors from different components from drilled holes (Fig. 4c-f) to demonstrate how variable uncertainties are depending on the choice of pathways (Fig. 1). Overall, relationships which avoid elevation (e.g. total thickness to draft; Fig. 4e) differ statistically from those which include elevation measurements. Density variations strongly contribute to these differences because of snow density variability (Fig. 4d). The absence of isostatic balance at the point scale also contributes. These results support the need to rethink drillhole sampling strategies, especially when combined with new evolving technologies such as autonomous underwater vehicles.
Isostasy and R-factor values from point measurements. (a) Snow density as the most variable measurement. (b) The residual from traditional isostasy calculations. (c–f) R-factor values from different parameter choices with associated uncertainties. (d) Two uncertainty ranges: dark grey shading based on mean densities while light grey includes density uncertainty ranges described in the Introduction.
As with drillhole results, we find broad ranges of possible R-factor solutions for the 5 m sampled EM-31 and Magna-Probe measurements (Fig. 5b), with solutions spanning a similar range for individual calculations of draft/elevation (Fig. 5d). Only when we derive individual R-factors using the sequence in Eqn (13) do we obtain realistic freeboard thickness estimates (Fig. 5c). There is no case where realistic freeboard results from a single R-factor value (not shown). For direct comparison with potential airborne and underwater observations, we produced one concatenated profile (Fig. 6a) for which we resolved elevation and ice draft (Fig. 6b) using Eqn (13). Intuitively realistic freeboard is provided with results showing an area where suppressed freeboard exists when thick snow is present over thinner ice (near 2 km mark; Fig. 6). No other solutions attempted in this study could render a freeboard so close to assumed arctic freeboard levels. Eqn (13) is an effective ‘best practice’ sequence for ground surveys which need to make comparisons to airborne, spaceborne and underwater coincident measurements, and therefore a great addition to the earlier-described workflow schematic (Fig. 1).
Snow and ice thickness from small-footprint instruments. Six survey lines (Fig. 3) concatenated together in (a) showing snow (above zero) and ice thickness (below zero) with survey lines sampled at 5 m intervals using MagnaProbe and EM-31, respectively. Field records of ice type marked as first-year (FY), FY deformed (FYD) and multi-year (MY) ice. Vertical lines of bright blue and tan distinguish snow (using MagnaProbe) and ice thickness (using drills), respectively, at calibration points along profiles (additional calibration points taken elsewhere). Ice thickness lines in black are mean results, with grey shading denoting uncertainties from calibration. (b) Results as in Eqn (13) with freeboard (red), elevation (dark grey), mean draft (black) and draft uncertainty (light grey) all computed relative to sea level (z = 0m). Survey line 7 not shown because most thicknesses were beyond the depth of EM-31 capabilities (i.e. >10 m).

For clarity, we note that even with this solution, uncertainties remain high for three reasons: (1) natural variability, (2) presence of non-isostatic contributions, and (3) need for better data-collection techniques, especially for sea-ice density. The clearest case for these uncertainties is seen near the 2 km mark in Figure 6. This location corresponds to the 915 m mark of leg 5. Along that transect from 850 m to the end of the line (last 150 m of the profile), field notes report ‘first year, very light rubble’. Transect samples report snow depth along that 150 m section ranging from 0.50 to 0.60 m with EM-31 ice thickness values ranging from 1.35 to 1.45m for a total thickness from 1.75 to 2.05 m. During calibration, the specific spot chosen for a drillhole reports 0.08m of snow and 1.81 m of ice, composed of 0.15m of freeboard and 1.66 m of draft, for a total thickness of 1.89 m. Such findings support more small-scale studies to understand snow and ice thickness distribution of deformed ice.
Ground survey R-factor ranges are used to bound estimates of total thickness for the regional submarine survey with realistic uncertainties shown (Fig. 7). Unknown snow thickness for each elevation calculation clearly contributes to high uncertainties. In particular, we see (Fig. 8a) that uncertainties due to EM calibration yield different volume estimates because of poor resolution of thickest ice types. This is known for EM instruments but communication of this fact as metadata in data archives is lacking and needs to be included. Uncertainties at the 95% confidence level for EM calibration coefficients only bound the accuracy of the mean, but this does nothing to bound uncertainty for thick ice types. The pseudo-Monte Carlo approach used in this study (Fig. 4) provides one possible method to quantify uncertainties due to data-collection practices.
Elevation estimates for submarine survey. (a) A window of possible elevation values using low, medium and high slope values to bound elevation range based on R-factors applied to submarine sonar draft measurements collected within the in situ survey array (Fig. 3). (b) Similar results for the larger domain (Fig. 2) with elevation range and uncertainty shown.

Representative distributions and their associated uncertainty. (a) The frequency distribution (FD) of total thickness for in situ measurements and their uncertainty (grey shading) based on calibration ranges. The impact of thickness distribution on volume is estimated by summing up the thickness distributions as a cumulative frequency distribution (CFD). Distributions shown within 51 bins at 0.2 m intervals with white noise level for reference. (b) Compilation of ice elevation distributions for in situ measurements (thick line), submarine sonar data within the 2 km survey area (dashed), and larger regional 20 km x 20 km box (three dash-dot) as a comparison across scales. Maximum and minimum uncertainty provided as a merged estimate of variability from all products (shaded area). (c) The uncertainty and variability of the R-factor from in situ measurements at 5 m sampling scale, which is neither constant nor normally distributed in agreement with the 1 m scale study of Reference Doble, Skouroup and WadhamsDoble and others (2011).
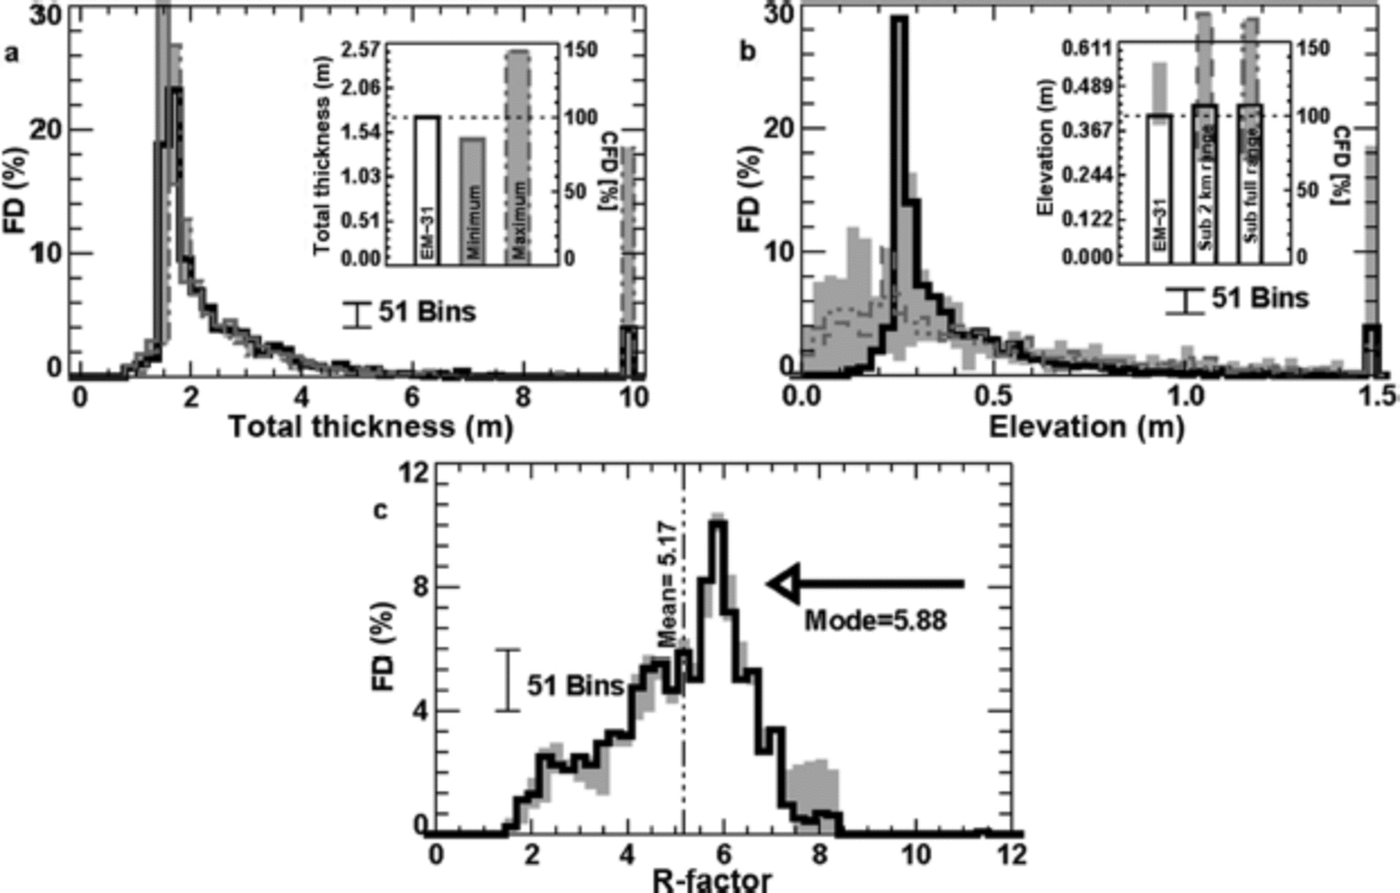
Thickness distributions for the in situ survey array, the quasi-coincident submarine survey beneath the survey array, and the larger regional submarine survey (Fig. 8b) are in good agreement for shape and mode of elevation distribution estimates. The high variability in submarine estimates for the thinnest ice agrees with earlier reports describing thin-ice errors in the Tireless expedition logs due to open-water detection issues, with such matters typically quoted with a bias of 0.36 m over 5 x 10⁴m (50 km) length scales (Reference Wadhams, Hughes and RodriguesWadhams and others, 2011). What is happening is reported in more detail in Reference Geiger, Samluk and MengeGeiger and others (2015) as due to beamwidth or resolution error. We see the visual impact of such bias graphically (Fig. 8b) in the large shaded uncertainties of both thin-ice elevation distributions and cumulative elevation distributions for the full submarine survey area and subset survey beneath the ice camp. For completeness, the integrated submarine elevation estimate is 0.44 m with an uncertainty range of 0.39 m that is biased thicker than the integrated value. As a comparison, the ground survey estimate is 0.41 m for integrated elevation, with an uncertainty range of 0.17 m also biased thicker than its integrated value. Much of the bias is due to uncertainties related to snow depth and density, which are proportionally larger for thinner ice. Inclusion of uncertainties in frequency distribution plots (e.g. Fig. 8) informs subsequent data users about the variability of uncertainties, especially as a function of ice thickness and type.
R-factor variability found in the EM thickness profile is based on an assumption of isostasy. In frequency space, such a report is communicated by showing how the R-factor is neither normally distributed (Fig. 8c) nor is it narrowly ranging. The uncertainties in this distribution are quite small (narrow grey shading) relative to distribution variability, so the skewness of the R-factor distribution is significant at the scales studied here. For clear communication to intended data users, we provide statistics including mean, mode, distribution and uncertainties so that modelers and other stakeholders have a quantitative assessment of the R-factor in a form that they can test further.
Discussion
There are three ways to explain the large variability in R-factors found in this study. One is that isostasy above some length scale is true for multiple R-factors in close physical proximity to each other in corroboration with findings by Reference Doble, Skouroup and WadhamsDoble and others (2011). A second possibility is that there is one central-tendency R-factor at some integrated length scale but isostasy is not true locally (only in an integrated sense), or quasi-equilibrium near isostasy is true with deformation events continually perturbing equilibrium to a length scale that is time-varying. A third possibility is, of course, some combination of both, with transitions across length scales for an effective R-factor for areas of common roughness. Regardless of the possibilities, one fundamental question remains: What is the length scale of isostasy and how do we make field measurements to test such a principle?
Working backwards, we consider a modeler’s need as an end user. Model parameterizations for thickness typically involve statistical distributions and the redistribution function Φ from Reference Thorndike, Rothrock and ColonyThorndike and others (1975). Details of the forces responsible for thickness redistribution are formulated explicitly through changes in potential energy as a measure of the work done to change the vertical position of ice floating on water as in eqn (10) of Reference HopkinsHopkins (1994). Here, we reproduce a simplified version of that equation, indexing over a number of N contiguous pieces of ice such that

Here ΔPE is change in potential energy, g is gravity, ∆t is a suitable time interval for the vertical motion of ice blocks, and vn and vns are vertical velocities of a specific ice block indexed by n with subscript s being the center of mass of the portion of the block that is submerged; the same goes for lateral area of the block (∆n) and lateral area of the portion of the ice that is submerged (∆ns). Most importantly, terms in square brackets resolve to vertical displacements in a manner similar to Ж. Hence, the form in Eqn (15) provides a framework to describe changes in potential energy due to departure from an isostatic balance. We formulate a potential energy change relative to N discrete locations, each with its own vertical displacement >Kn within a total area such that

with ρ n as a bulk density for each discrete location, essentially pT at each point n as in Eqn (2). From such a relationship, one can compute ΔPE from three considerations. First, an area is in isostatic balance if ΔPE = 0 (or nearly so when ΔPE∼ 0). Second, over an increasing range of length scales (each spanning increasing surface areas), we can test the condition ΔPE (L > Critical Length Scale) ∼0 to see if there is a critical threshold for isostatic balance. Finally, and probably most important, Eqn (16) can be tested with in situ measurements. Such a field experiment is no doubt time-consuming and new sampling strategies are needed but Ж and ΔPE at least provide a practical starting point for framing new field experiments to test and evaluate isostasy.
In the meantime, reporting of field measurements with uncertainties for thickness distribution improves communication between point measurements and swath data for large-scale users. Such communication is essential to the integration of measurements of sea-ice thickness and should be reported with individual uncertainties for each measurement at specific length scales (i.e. z(L)=z±∆z). To support such measurements, systematic uncertainty reporting is needed especially for field campaigns with coincident ground stations, airborne and underwater surveys. Such reporting provides more accurate and comprehensive understanding of sea-ice changes for ongoing climate transition issues such as rapid reduction of sea ice from winter to summer months, impacts on polar atmospheric moisture, and larger connections to atmospheric circulation and mid-latitude weather variations.
Conclusion
This paper has used case studies to look carefully at scaling issues for isostasy as a means to advance combinations of data products. Traditional sea-ice buoyancy assumes a one-dimensional isostatic balance between vertical layers of water, ice and snow. Findings here show that this assumption should be extended to include lateral forces resulting from deformation, with this study framing the mathematics to begin exploring this topic and support more research. In particular, we recommend the development of new best practices in field measurements which support process model experiments involving Ж and changes in potential energy. Process models are needed to characterize isostatic length scales in conjunction with traditional thickness distribution and the redistribution function (so-called Thorndike Φ parameter). Strong variability in bulk densities of different cryospheric materials and large variations in snow depth strongly contribute to an R-factor that is not normally distributed nor necessarily in isostatic balance locally. We therefore encourage the development of generalized buoyancy models to study perturbations from isostasy as a function of dynamics and time-varying length scales.
In summary, small-scale point measurements (<1 m) provide invaluable information about the distribution of sea-ice buoyancy from a 3-D perspective. At scales from 1 to 10 m, the steps outlined in Eqn (13) provide good approximations for freeboard elevation by determining unknowns with low uncertainties. Likewise for large-scale underwater vehicles, a good estimate of thermodynamic thickness provides a low uncertainty estimate for elevation in the absence of snow thickness information. Airborne and spaceborne solutions benefit from similar approaches as snow-penetrating radars improve and snow-blowing process models over rough ice are advanced. But in the end, the most effective advancements will come from small-scale (0.1-100 m) buoyancy-mapping techniques which provide greater insight into the spatial distribution of the intrinsic property of density. This is an ambitious challenge, but the data clearly indicate that such an approach is warranted if we are to reduce the uncertainties.
Acknowledgements
The US National Science Foundation (NSF) provided support through ARC-1107725 (University of Alaska Fairbanks), ARC-0611991 (CRREL), ARC-0612105 and ARC-1107725 (University of Delaware). Submarine science team supported through the DAMOCLES (Developing Arctic Modeling and Observing Capabilities for Long-term Environmental Studies) project and Office of Naval Research. Logistics made possible through J. Gossett (US Arctic Submarine Laboratory), F. Karig (University of Washington) and the US Navy. We thank N. Hughes (Norwegian Meteorological Institute), A. Turner, K.A. Giles (University College London) and R. Harris for participation in ground surveys, with special remembrance for K.A. Giles and R. Harris (NSF-sponsored PolarTREC teacher). The International Space Science Institute is acknowledged for collaborative project No. 169, and R. Kwok (Jet Propulsion Laboratory, Pasadena, CA) for discussions on the long-term value of field measurements. Undergraduate students T. Mattraw, S. Sood and S. Streeter (classes of 2011, 2012 and 2013) participated in analysis through the Dartmouth Women In Science Project (WISP). C.G. also supported by the College of Earth, Ocean & Environment, University of Delaware, and M. Hilchenbach (MPS Fellowship Program).
Appendix: Error Propagation
Error propagation is based on absolute and relative error expressions following Geiger (2006) and Giles and others (2008) using the form

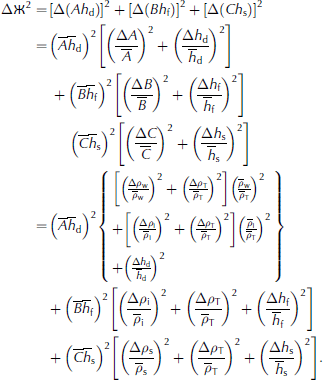
If density properties are normally distributed (which we cannot yet test with these data) then we have  and thereby derive


For more expansive error propagation relationships, such as

we invoke substitution of variables such as
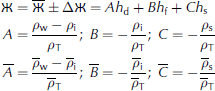
The respective relative error relations are
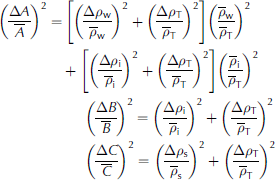
through which the full error propagation resolves clearly to