Healthy individuals have adopted different nutritional interventions as a way of maintaining health, reducing the risk of chronic diseases, improving body composition and increasing life expectancy. Caloric restriction (CR) is among such interventions, characterised by reduced daily energy consumption, and constitutes the most widely used nutritional strategy in clinical practice to improve body composition(Reference Parvaresh, Razavi and Abbasi1). However, many individuals have difficulty maintaining this strategy for long periods(Reference Strilbytska, Klishch and Storey2).
In this context, intermittent fasting (IF) has gained popularity recently as an alternative strategy to CR by demonstrating similar benefits(Reference Strilbytska, Klishch and Storey2). The most studied among IF regimens are time-restricted feeding (TRF), in which the animals ingest feed for around 8 h, followed by 16 h of fasting; alternate-day fasting (ADF), which consists of 24 h of total fasting, followed by 24 h of eating; and alternate-day modified fasting (ADMF), which follows the same eating plan as ADF; however, the individual can ingest an average of 25 % of the daily energy on the fasting day(Reference Koppold, Breinlinger and Hanslian3,Reference Cai, Qin, Shi and Chen4) .
Different IF regimens have been shown not to cause compensatory overconsumption during the eating period in men and women with metabolic syndrome(Reference Parvaresh, Razavi and Abbasi1) or healthy (without obesity)(Reference Stekovic, Hofer and Tripolt5), which may be linked to improved insulin sensitivity and increased leptin levels, a hormone which promotes satiety(Reference Zouhal, Bagheri and Triki6). These regimens additionally promote improvements in the blood lipid profile influenced by a weight loss greater than 5 % in men and women with non-alcoholic fatty liver disease(Reference Cai, Qin, Shi and Chen4) or healthy (without obesity)(Reference Stekovic, Hofer and Tripolt5), as well as reduce the accumulation of hepatic lipids in insulin-resistant rats(Reference Liang, Liao and Huang7) and preserve the architecture and organisation of hepatocytes in diet-induced obese rats(Reference de Souza, Cavalcante and dos Santos Lima8). Nevertheless, they have demonstrated damage to muscle fibres, which may be linked to mitochondrial damage caused by increased oxidative metabolism in healthy rats(Reference Dorand, Soares and da Silva Andrade9). Despite regimen differences, which often hinder directly comparing them(Reference Heilbronn and Panda10), these interventions have also become popular among healthy individuals in recent years, aiming for a healthy lifestyle and longevity(Reference Strilbytska, Klishch and Storey2). However, studies that do not focus on religious fasting mostly evaluate individuals with some chronic diseases(Reference Cai, Qin, Shi and Chen4,Reference Zhang, Zou and Zhao11) , leaving a gap in the scientific literature regarding these effects on healthy individuals. Therefore, the present study aims to evaluate the impact of different IF regimens on metabolic parameters in healthy rats and compare them with CR. We hypothesise that different IF regimes promote similar health benefits to CR. In this study, we tested this hypothesis through the respective dietary interventions in male Wistar rats for 4 weeks.
Methods and materials
Animals, diets and intermittent fasting regimens
The experimental protocol with Wistar rats was approved under number 2629090322 by the Ethics Committee on the Use of Animals of the UFPB, according to the Animal Research: Reporting of In Vivo Experiments (ARRIVE) guidelines(Reference du Sert, Hurst and Ahluwalia12). The healthy rats were obtained from the colony at the José Paulino Bioterium, located at the Health Sciences Centre of the Federal University of Pernambuco (UFPE), and acclimatised for a week for subsequent biological testing at the Experimental Nutrition Laboratory located at the Federal University of Paraíba (UFPB) in Brazil.
A total of fifty adult male Rattus norvegicus strain Wistar (±90 days old) rats were kept under standard lighting conditions (light/dark cycle, 12/12 h – lights on at 7 am), temperature (22 ± 2°C) and humidity (55 ± 5 %). The rats were maintained in collective cages (2 or 3 rats/cage), under the same conditions described by Soares et al.(Reference Soares, Dorand and Cavalcante13) The rats were placed in a cage with bars for 1 week before starting the experiment. They received water ad libitum and commercial feed (Nuvilab) – which provides 311 kcal, 57 % carbohydrates, 28 % proteins and 14 % lipids per 100 g of feed – during the 4 weeks of the experiment. The experimental period was selected based on previous studies employing different IF regimens(Reference Zhang, Zou and Zhao11,Reference Bhoumik, Kesherwani and Kumar14–Reference Ma, Hu and Fu16) . Additionally, earlier investigations have also reported changes in the main metabolic adaptations assessed in the present study(Reference de Souza, Cavalcante and dos Santos Lima8,Reference Dorand, Soares and da Silva Andrade9,Reference Deng, Liu and Wang17) .
The stratified randomisation (ARRIVE guidelines, 2024)(Reference du Sert, Ahluwalia and Alam18) was performed in two subsequent steps using the initial body weight of the rats (271 g to 370 g): (1) stratification – body weights of the rats (n 50) were organised in ascending order (from lowest to highest) using the Excel Sort and Filter function, and then the body weights of the rats were distributed into two strata: strata one with the lowest (n 25) and strata two with highest (n 25) body weight values; (2) randomisation by stratum – the Random Allocation Software v.2.0 (https://random-allocation-software.software.informer.com/2.0/) was used to generate random numbers for each rat, to form five groups per stratum with five rats per group. The rats of two strata were subsequently allocated into the respective groups (n 10 rats per group), ensuring similar body weights among the groups (ranging from 322·50 (sd 19·37) g to 339·25 (sd 20·96) g) (online Supplementary Table 1):
-
control (CON; n 10), with access to feed ad libitum;
-
caloric restriction (CR; n 10), with access to 80 % of ad libitum intake(Reference van der Merwe, Sharma and Caldwell19). This percentage was chosen to induce a moderate restriction sufficient to promote improvements in metabolic and hormonal parameters, according reporting previous studies(Reference van der Merwe, Sharma and Caldwell19–Reference Smith, Caldwell and van der Merwe21). Previous studies that compared multiple intermittent fasting protocols with caloric restriction employed this same caloric restriction percentage(Reference van der Merwe, Sharma and Caldwell19,Reference Smith, Caldwell and van der Merwe21) . The restriction was calculated based on the weekly food intake of the CON group;
-
time-restricted feeding (TRF; n 10), with ad libitum access to feed for 8 h, followed by 16 h of fasting(Reference Bhoumik, Kesherwani and Kumar14). Fasting in the TRF group was scheduled to coincide with the animals’ inactive phase (light phase) to mimic clinical practice. Food was provided during the final hours of the active phase (from 23.00 to 07.00)(Reference Zhang, Zou and Zhao11,Reference Delahaye, Bloomer and Butawan22) ;
-
alternate-day fasting (ADF; n 10), with ad libitum access to feed for 24 h, followed by 24 h of fasting(Reference Zhang, Zou and Zhao11); and
-
alternate-day modified fasting (ADMF; n 10), with ad libitum access to feed for 24 h, followed by 24 h with access to 15 % of ad libitum intake(Reference Varady, Hudak and Hellerstein23) – the feeding during fasting days was determined with reference to the weekly intake observed in the CON group.
In addition, the same environmental conditions were applied to all groups, the same researcher performed all procedures and all animals were housed nearby to minimise potential confounding factors. Feed consumption monitoring and body weight (primary outcome) measurements were performed weekly. The total calorie intake restriction percentage was calculated based on the total consumption of the control group.
Glucose and insulin tolerance tests
The glucose tolerance test (GTT) and the insulin tolerance test (ITT) were performed on the 25th and 27th day, respectively. The GTT was performed after a 6-h fast. Baseline glycaemia (time 0) was measured via tail incision, followed by oral gavage administration of a 25 % glucose solution (Laborclin, Paraná, Brazil) at a dose of 2 g of glucose per kg of body weight. Blood glucose levels were subsequently measured at 15, 30, 60, 90 and 120 min.
Then, the ITT was conducted under basal conditions (time 0) 48 h after the GTT and following intraperitoneal administration of regular insulin (Novolin® R, Novo Nordisk) at a dose of 0·75 international units of insulin per kg of body weight, diluted in sterile 0·9 % saline solution. Glycaemia was measured at 15, 30, 60, 90 and 120 min using a glucometer (Accu-Chek, Performa model)(Reference Dorand, Soares and da Silva Andrade9).
The AUC for GTT and ITT was calculated using the free version of GraphPad Prism 10® (GraphPad Software Inc.) by applying the trapezoidal method for numerical integration. The AUC was determined from the glycaemic curve obtained at the six measurement points of the GTT or ITT. The software automatically computed the AUC by summing the areas of the trapezoids formed between consecutive time points. Finally, the ITT glucose decay percentage constant (KITT) was calculated(Reference Villas Boas, Rodrigues Lemos and de Oliveira24).
Humane killing and collection of biological material
At the end of the experiment, all rats fasted for 8 h and were then humanely killed by guillotine decapitation (EB271, Insights). No anaesthetics were used due to potential effects on liver parameters(Reference Chen, Yu and Yang25). This procedure was performed by trained personnel and followed the Guide for the Care and Use of Laboratory Animals(Reference du Sert, Hurst and Ahluwalia12), ensuring the integrity and consistency of the experimental data. Blood, liver, adipose tissue and soleus muscle were collected. The adiposity index was calculated after humane killing(Reference Nascimento, Luvizotto and Leopoldo26).
Biochemical analysis in serum
Blood was collected in sterile tubes and centrifuged at 1·040 × g for 15 min to obtain serum for analysis of triacylglycerols (TAG), total cholesterol (TC), high-intensity lipoprotein (HDL) and low-intensity lipoprotein (LDL), which were evaluated using commercial kits (Bioclin®), with the absorbances obtained on Eon™ microplate spectrophotometer (BioTek™), supported by the Gen5™ 2·0 program (BioTek™). Very Low-Density Lipoprotein (VLDL) was subsequently calculated(Reference Friedewald, Levy and Fredrickson27). Insulin and leptin were analysed using the ELISA (BioVenic, EK11F267) and electrochemiluminescence immunoassay (Abcam, AB108881), respectively.
The homeostasis model for insulin resistance (HOMA-IR) and the homeostasis model for β-cell function (HOMA-β) were used to measure insulin resistance and the functionality of pancreatic β cells(Reference Matthews, Hosker and Rudenski28).
Quantification of sugars, cholesterol, TAG and fatty acids in liver
Sugars in liver (smaller lobe) samples were quantified by extracting 1 g of sample, diluted in 5 ml of sulfuric acid at 4·0 mM/l, then solubilised with the aid of a tube shaker and centrifuged at 5·800 × g for 10 min. Then, 10 μl of each sample was injected into high-performance liquid chromatography (1260 Infinity LC system, Agilent Technologies). Chromatographic separation was performed on an Agilent Hi-Plex H ion-exchange column (300 × 7·7 mm) with internal 8·0 μm particles protected by a PL Hi-Plex H guard column (5 × 3 mm) (Agilent Technologies). The flow rate applied was 0·5 ml/min with a run time of 20 min(Reference Batista, Soares and Dorand29).
Liver lipid extracts were obtained by the method of Folch, Less, and Stanley (1957)(Reference Folch, Lees and Sloane Stanley30) and used to quantify TAG and TC using specific commercial kits (Bioclin®), with the absorbances obtained on an Eon™ microplate spectrophotometer (BioTek™), supported by the Gen5™ 2.0 program (BioTek™).
Part of the liver lipid extracts was submitted to fatty acid transmethylation(Reference Hartman and Lago31) and then fatty acids were quantified on a GCMS-QP2010 gas chromatograph (Shimadzu) coupled to a Durabound DB-23 capillary column with helium as the carrier gas. The elution gradient in the column was from 90 to 150°C (10°C/min), from 150 to 200°C (5°C/min) and from 200 to 230°C (3°C/min) in a total time of 34 min(Reference Alcântara, de Lima and Braga32).
Histological analysis
The liver parenchyma (larger lobe), adipose and muscle (soleus) tissues were processed using standard histological techniques involving dehydration through increasing concentrations of alcohol and clearing in xylene, followed by paraffin embedding. Paraffin-embedded tissue sections (3–4 µm thick) were stained with haematoxylin and eosin, analysed under all experimental conditions and photographed at 40× magnification, with a scale bar corresponding to 300 µm, using a standard optical microscope (Motic BA 200). Next, twelve random images of adipose and muscle tissues per animal were captured for morphometric analysis using a microcamera and algorithms built into the KS300 digital image processing software (White Plains). The area was calculated in µm2 (Reference Dorand, Soares and da Silva Andrade9). A maximum of 100 adipocytes were counted for the adipose tissue.
Statistical analysis
The number of rats per group (fifty animals distributed into five groups, n 10 rats per group) was calculated to achieve a statistical power of 0·90 (90 %) at a two-sided significance level of 0·05 (G Power 3.1.9.7 software, Heinrich Heine Universitat Düsseldorf) and as demonstrated in previous studies conducted by our research group with IF(Reference de Souza, Cavalcante and dos Santos Lima8,Reference Dorand, Soares and da Silva Andrade9,Reference Soares, Dorand and Cavalcante13) . No animals were excluded during the experiment. All researchers were aware of the allocation of animals to each group during the experiment; however, the codes were renamed by a researcher not involved in the experiment for post-experiment analyses and statistical evaluations to ensure the analyses were conducted in a blinded manner.
Data were tested for normality using the Shapiro–Wilk test and analysed via one-way (total calorie restriction percentage, adiposity index, AUC of GTT and ITT, insulin, HOMA-β, HOMA-IR, lipid profile in serum and liver, liver sugars, hepatic fatty acids, adipocyte size and size of muscle fibres) or two-way (calorie intake, weekly weight gain, GTT and ITT) ANOVA. When there was a difference among the variables, the Tukey’s post-test was performed at a significance level of 5 % (P < 0·05). The results were expressed as mean and sd. The data were analysed using the free version of GraphPad Prism 10® (GraphPad Software Inc.). The effect size and its 95 % CI were calculated using a Cambridge Microsoft Excel spreadsheet (https://www.cem.org/effect-size-calculator) for each statistically significant outcome measure (see online Supplementary Tables 2–9). The PAST v.4.03 program (Oslo University) was used to perform unsupervised principal component analysis (PCA) of the data.
Results
Effects of intermittent fasting on feed calorie consumption
The ADF group only showed lower consumption compared with the CON (P = 0·049) in the first week, then consumption was similar among all groups in the remaining weeks (P = 0·21) (online Supplementary Figure 1(a); Supplementary Table 2). On the other hand, the TRF group presented lower total calorie intake restriction than the ADF group (P < 0·001) (online Supplementary Figure 1(b); Supplementary Table 2).
Effects of intermittent fasting on somatic parameters
The ADF and ADMF groups presented the greatest weight loss compared with the other groups (P = 0·021), while the TRF group did not demonstrate weight loss (P = 0·99 v. CON) and had the highest adiposity index (P = 0·047) (Figure 1; online Supplementary Table 3).
Body weight (a) and adiposity index (b) of healthy male rats submitted to different intermittent fasting regimens or caloric restriction. ADF, alternate-day fasting (n 10); ADMF, alternate-day modified fasting (n 10); CON, control (n 10); CR, caloric restriction (n 10); TRF, time-restricted feeding (n 10); *significant difference compared with CON; †significant difference compared with CR; §significant difference compared with TRF. (Data are presented as mean and standard deviation. Groups are compared using: Weekly weight gain: two-way ANOVA, P ≤ 0·05, Tukey’s hoc test; Adiposity index: one-way ANOVA, P ≤ 0·05, Tukey’s hoc test.).

Effects of intermittent fasting on the glycide profile
The ADMF group had lower blood glucose levels at T0 (P = 0·038) v. CON and T120 v. TRF (P < 0·001) and ADF (P = 0·003) for the GTT. The TRF and ADF groups presented the lowest glucose values at T15 (P = 0·019) and T60 (P = 0·011) (Figure 2(a); online Supplementary Table 4), reflecting a lower AUC in the CR, TRF and ADF groups (Figure 2(b); online Supplementary Table 4).
GTT (a), AUC of glycaemia of GTT (b), ITT (c), AUC of glycaemia of ITT (d), KITT (e), HOMA-IR (f), HOMA-β (g), insulin (h) and leptin (i) of healthy male rats submitted to different intermittent fasting regimens or caloric restriction. ADF, alternate-day fasting (n 10); ADMF, alternate-day modified fasting (n 10); AUC, area under the curve; CON, control (n 10); CR, caloric restriction (n 10); GTT, glucose tolerance test; HOMA-IR, homeostasis model for insulin resistance; HOMA-β, homeostasis model for β cell function; ITT, insulin tolerance test; KITT, ITT glucose decay percentage constant; TRF, time-restricted feeding (n 10); *significant difference compared with CON; †significant difference compared with CR; §significant difference compared with TRF; #Significant difference compared with ADF. (Data are presented as mean and standard deviation. Groups are compared using: GTT and ITT: two-way ANOVA, P ≤ 0·05, Tukey’s hoc test; AUC of GTT and ITT; insulin, HOMA-β and HOMA-IR: one-way ANOVA, P ≤ 0·05, Tukey’s hoc test.).

The ADF group had higher glycaemia at T0 for the ITT (P = 0·033), while the ADMF group had lower glycaemia at all other times (P = 0·038) (Figure 2(c); online Supplementary Table 4), resulting in a lower AUC in the ADMF and higher in the CR and ADF groups (Figure 2(d); online Supplementary Table 4).
Consequently, the ADMF group had the highest KITT percentage compared with the other groups (P < 0·001) (Figure 2(e); online Supplementary Table 4). The groups subjected to IF had lower HOMA-IR values compared with the CON group (P = 0·02) (Figure 2(f); online Supplementary Table 4), and HOMA-β was similar among all groups (P = 0·24) (Figure 2(g); online Supplementary Table 4). The TRF and ADF groups presented lower insulin concentration compared with the CON group (P = 0·008); moreover, the ADF group presented even lower insulin than the CR group (P = 0·042) (Figure 2(h); online Supplementary Table 4). The ADF and ADMF groups had higher leptin concentration than the CR group (P = 0·002) (Figure 2(i); online Supplementary Table 4).
Effects of intermittent fasting on serum lipid profile
The TRF group presented lower serum TC than the CON group (P = 0·011), and the other groups submitted to IF (P = 0·006). In turn, despite the ADF group presenting higher HDL compared with the CON, CR and TRF groups (P = 0·001), it also presented higher serum TG than all groups (P = 0·027), higher LDL v. CR (P = 0·012) and higher VLDL v. CR and TRF (P = 0·016). The ADMF group presented higher HDL compared with the CON and CR groups (P = 0·039) (Table 1; online Supplementary Table 5).
Lipid profile in serum of healthy rats submitted to different intermittent fasting regimens or caloric restriction

Table 1 Long description
A table comparing lipid profiles in rats under different fasting regimens. The table has 6 columns and 6 rows, including headers. The columns are labeled as CON, CR, TRF, ADF, and ADMF, each with Mean and SD sub-columns. The rows are labeled with different lipid types: TG (mg/dl), TC (mg/dl), HDL (mg/dl), LDL (mg/dl), and VLDL (mg/dl). Each cell contains numerical values representing the mean and standard deviation for each lipid type under different fasting regimens. Row 1: TG (mg/dl), CON Mean: 164-30, CON SD: 10-16, CR Mean: 156-70, CR SD: 5-03, TRF Mean: 157-60, TRF SD: 8-85, ADF Mean: 183-20, ADF SD: 8-39, ADMF Mean: 165-00, ADMF SD: 10-22. Row 2: TC (mg/dl), CON Mean: 224-20, CON SD: 16-95, CR Mean: 210-70, CR SD: 11-13, TRF Mean: 196-40, TRF SD: 10-97, ADF Mean: 232-90, ADF SD: 8-31, ADMF Mean: 226-20, ADMF SD: 10-12. Row 3: HDL (mg/dl), CON Mean: 118-20, CON SD: 1-98, CR Mean: 122-00, CR SD: 3-95, TRF Mean: 125-00, TRF SD: 1-34, ADF Mean: 141-50, ADF SD: 10-17, ADMF Mean: 133-10, ADMF SD: 5-94. Row 4: LDL (mg/dl), CON Mean: 9-13, CON SD: 0-40, CR Mean: 6-27, CR SD: 3-86, TRF Mean: 9-13, TRF SD: 0-56, ADF Mean: 11-12, ADF SD: 0-11, ADMF Mean: 9-77, ADMF SD: 0-78. Row 5: VLDL (mg/dl), CON Mean: 33-14, CON SD: 1-99, CR Mean: 31-13, CR SD: 0-99, TRF Mean: 32-01, TRF SD: 2-54, ADF Mean: 36-38, ADF SD: 1-97, ADMF Mean: 32-79, ADMF SD: 2-00.
ADF, alternate-day fasting (n 10); ADMF, alternate-day modified fasting (n 10); CON, control (n 10); CR, caloric restriction (n 10); TC, total cholesterol; TRF, time-restricted feeding (n 10); *significant difference compared with CON; †significant difference compared with CR; ‡significant difference compared with TRF; §significant difference compared with ADF (one-way ANOVA, P ≤ 0·05, Tukey’s hoc test).
Effects of intermittent fasting on sugars, cholesterol, TAG and fatty acids in liver
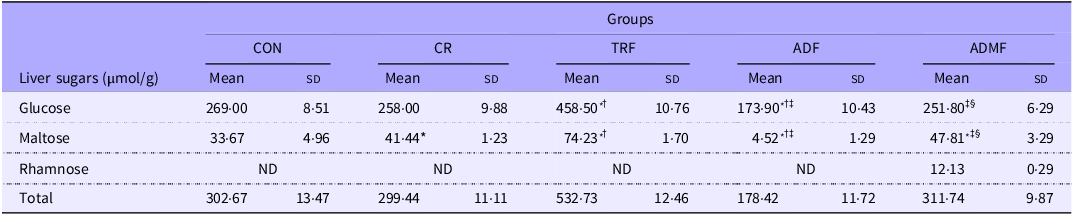
The TRF group had the highest and the ADF group the lowest glucose and maltose concentrations compared with all groups (P < 0·001). ADMF was the only group in which rhamnose was detected (Table 2; online Supplementary Table 6).
Liver sugars of healthy rats submitted to different intermittent fasting regimens or caloric restriction

Table 2 Long description
The table presents liver sugar concentrations in healthy rats subjected to various intermittent fasting regimens or caloric restriction. It consists of 5 columns and 5 rows, including headers. The columns are labeled as CON, CR, TRF, ADF, and ADMF, representing different dietary groups. The rows are labeled as Glucose, Maltose, Rhamnose, and Total, with concentrations measured in µmol/g. Each column provides the mean and standard deviation (SD) values for each sugar type and total sugar content. Notable data points include the highest glucose and maltose concentrations in the TRF group and the lowest in the ADF group. Rhamnose is only detected in the ADMF group. The table highlights significant differences in sugar concentrations across the different dietary regimens.
ADF, alternate-day fasting (n 10); ADMF, alternate-day modified fasting (n 10); CON, control (n 10); CR, caloric restriction (n 10); ND, not detected; TRF, time-restricted feeding (n 10); *significant difference compared with CON; †significant difference compared with CR; ‡significant difference compared with TRF; §significant difference compared with ADF (one-way ANOVA, P ≤ 0·05, Tukey’s hoc test).
The ADMF group presented higher liver TG than the CON and TRF groups (P = 0·019). TC was similar among all groups (P = 0·051) (Table 3; online Supplementary Table 7).
Lipid profile in the liver of healthy rats submitted to different intermittent fasting regimens or caloric restriction

Table 3 Long description
A table comparing lipid profiles in the liver of rats under different fasting regimens. The table has five columns and two rows. The columns are labeled CON, CR, TRF, ADF, and ADMF, each with Mean and SD sub-columns. The row labels are TG (mg/dl) and TC (mg/dl). Row 1: TG (mg/dl), CON Mean: 115.60, CON SD: 8.09, CR Mean: 120.80, CR SD: 6.28, TRF Mean: 111.70, TRF SD: 10.99, ADF Mean: 120.10, ADF SD: 10.29, ADMF Mean: 135.60, ADMF SD: 9.49. Row 2: TC (mg/dl), CON Mean: 128.50, CON SD: 5.46, CR Mean: 110.80, CR SD: 17.82, TRF Mean: 105.50, TRF SD: 17.04, ADF Mean: 105.00, ADF SD: 8.39, ADMF Mean: 130.90, ADMF SD: 2.47.
ADF, alternate-day fasting (n 10); ADMF, alternate-day modified fasting (n 10); CON, control (n 10); CR, caloric restriction (n 10); TC, total cholesterol; TRF, time-restricted feeding (n 10); * significant difference compared with CON; † significant difference compared with TRF (one-way ANOVA, P ≤ 0·05, Tukey’s hoc test).
All experimental groups presented a higher palmitic acid percentage (P = 0·042). Furthermore, the TRF group presented higher pentadecanoic and palmitoleic acid percentages than the CON group and the other groups submitted to IF (P = 0·013) (Table 4; online Supplementary Table 8).
Concentration of hepatic fatty acids of healthy rats submitted to different intermittent fasting regimens or caloric restriction

Table 4 Long description
The table presents the concentration of hepatic fatty acids in healthy rats subjected to various intermittent fasting regimens or caloric restriction. It includes data for five groups: CON, CR, TRF, ADF, and ADMF. The table is organized into rows and columns, with row labels indicating different fatty acids and their categories (saturated, monounsaturated, polyunsaturated), and column headers indicating the groups and their mean and standard deviation values. Each row lists the mean and standard deviation for each group. Notable fatty acids include pentadecanoic acid, palmitic acid, margaric acid, palmitoleic acid, linoleic acid, dihomo-γ-linolenic acid, and DHA. The table highlights variations in fatty acid concentrations across different groups, with specific values provided for each group.
ADF, alternate-day fasting (n 10); ADMF, alternate-day modified fasting (n 10); CON, control (n 10); CR, caloric restriction (n 10); TRF, time-restricted feeding (n 10); *significant difference compared with CON; †significant difference compared with CR ‡significant difference compared with TRF (one-way ANOVA, P ≤ 0·05, Tukey’s hoc test).
Effects of intermittent fasting on liver, adipose tissue and muscle histology
All rats showed hepatic cords, sinusoids and a central vein of homogeneous size and shape in the histological section of liver parenchyma stained with hematoxylin and eosin (Figure 3).
Liver parenchyma tissue histology (a), control; (b), caloric restriction; (c), time-restricted feeding; (d), alternate-day fasting and (e), alternate-day modified fasting of healthy male rats submitted to different intermittent fasting regimens or caloric restriction.

The CON group (Figure 4(a)) showed homogeneous size and shape adipocytes, which also occurred in the CR (Figure 4(b)), TRF (Figure 4(c)), ADF (Figure 4(d)) and ADMF (Figure 4(e)) groups. It was observed that the TRF group had the largest adipocyte size in the morphometric analysis (P < 0·001), while the CR group had the smallest size (P < 0·001), followed by ADMF < ADF < CON (P = 0·003) (Figure 4(f); online Supplementary Table 9).
Adipose tissue histology (a), control; (b), caloric restriction; (c), time-restricted feeding; (d), alternate-day fasting; (e), alternate-day modified fasting and morphometric analysis of adipocyte size (f) of healthy male rats submitted to different intermittent fasting regimens or caloric restriction. ADF, alternate-day fasting (n 10); ADMF, alternate-day modified fasting (n 10); CON, control (n 10); CR, caloric restriction (n 10); TRF, time-restricted feeding (n 10); *significant difference compared with CON; **mononuclear cell exudate; †significant difference compared with CR; §significant difference compared with TRF; #significant difference compared with ADF. (Data are presented as mean and standard deviation. Adipocyte size of groups are compared using one-way ANOVA, P ≤ 0·05, Tukey’s hoc test.).

The CON group (Figure 5(a)) had homogeneous size and shape muscle fibres. The CR group (Figure 5(b)) showed muscle fibre tears with irregularities in the sarcomeres, while the TRF group (Figure 5(c)) had homogeneous fibres, but hypotrophic. Homogeneous and hypertrophic muscle fibres were noted in the ADF (Figure 5(d)) and ADMF (Figure 5(e)) groups. The morphometric analysis showed that the ADMF group presented the largest muscle fibre size, followed by the ADF group (P < 0·001). The CR and TRF groups had lower muscle fibre sizes than the CON group (P < 0·001) (Figure 5(f); online Supplementary Table 9).
Muscle tissue histology (a), CON; (b), CR; (c), TRF; (d), ADF; (e), ADMF and morphometric analysis of the size of muscle fibres (f) of healthy male rats submitted to different intermittent fasting regimens or caloric restriction. ADF, alternate-day fasting (n 10); ADMF, alternate-day modified fasting (n 10); CON, control (n 10); CR, caloric restriction (n 10); TRF, time-restricted feeding (n 10); *significant difference compared with CON; **broken muscle fibres with sarcomere irregularities; †significant difference compared with CR; §significant difference compared with TRF; #significant difference compared with ADF. (Data are presented as mean and standard deviation. Size of muscle fibres of groups is compared using one-way ANOVA, P ≤ 0·05, Tukey’s hoc test.).

Principal component analysis
The PCA showed that the two principal components explain 63·64 % of the total data variability (PC1 39·76 %, PC2 23·88 %) (online Supplementary Figure 2). The main variables that contributed were blood glucose levels in T15 and T60 in the GTT, and the muscle fibre size, all positively associated with the ADMF group.
Discussion
Our results demonstrated that the ADF and ADMF groups stood out for improving the metabolic parameters in healthy male Wistar rats, presenting the greatest weight loss, improvements in glucose parameters and higher HDL compared with other groups. Additionally, ADMF had a smaller adipocyte area and hypertrophy of muscle fibres among the fasting regimens, followed by ADF group. On the other hand, the TRF group presented the lowest total calorie intake restriction and the highest adiposity index. Thus, the results refuted our hypothesis, as the ADF and ADMF regimens promoted the greatest health benefits compared with CR. However, the TRF regimen did not improve weight loss and exhibited the highest adiposity index and adipocyte area when compared with both CR and the other IF regimens.
The ADF group had lower calorie intake than the CON group only in the first week of the experiment. There was no difference in weekly consumption after the rats adapted to IF. The IF regimens employed were not isocaloric relative to the calorie restriction group, exhibiting natural variations in energy intake between fasting and feeding days. This pattern aligns with the international consensus on fasting terminology, which defines the adopted protocols as ad libitum feeding during the eating window. Therefore, although daily caloric intake fluctuations occurred, this characteristic is intrinsic to the IF model and does not compromise the overall comparability of total energy intake among groups.
Overall, the total caloric restriction was similar among the CR and IF groups, except for ADF, which showed a greater reduction compared with TRF. Even so, the ADF and ADMF groups presented the greatest weight loss, 5·03 % in the ADF group and 6·55 % in the ADMF group, which meets the 5 % threshold recommended by guidelines as the minimum criterion for metabolic benefits(33,Reference Jensen, Ryan and Apovian34) . Considering that the rats were healthy, this reduction can be interpreted as a preventive strategy against metabolic disorders. Evidence from the literature indicates that weight losses ≥ 5 % lead to improvements in glycaemic, lipidic and blood pressure parameters(Reference Franz, Boucher and Rutten-Ramos35–Reference Dhar, Packer and Michalopoulou37), underscoring the clinical relevance of the observed reduction, even in individuals without pre-existing metabolic alterations.
The CR, TRF and ADF groups showed lower AUC values in the GTT, which corresponded with smaller increases in blood glucose – at T60 and T90 for the CR group and at T15 and T60 for the ADF and TRF groups – even with lower insulin concentrations. The smaller the increase in glucose in this test, the more sensitive the individual is; thus, the ADF and TRF groups demonstrate greater sensitivity to glucose. This corroborates a previous study in which obese female rats exhibited similar glycaemic responses during the GTT when subjected to ADF and TRF(Reference Bilibio, dos Reis and Compagnon38).
The ADF group had higher blood glucose at T0 of the ITT, which can be explained by the fact that the ADF rats had a higher consumption than the CON, CR and TRF rats on the day of the test(Reference Soares, Cavalcante and Ferreira39), thereby justifying their higher glycaemia, considering that this test is conducted with fed animals. The ADMF group exhibited improved insulin sensitivity, as evidenced by a lower AUC in the TTI and a higher KITT, which was likely attributable to a favourable metabolic profile, characterised by greater weight loss, smaller adipocytes and increased muscle mass. The reduction in adipocyte size is associated with enhanced insulin signalling, as smaller adipocytes secrete lower levels of pro-inflammatory mediators, thereby creating a more favourable environment for insulin action(Reference Ahmed, Sultana and Greene40). Furthermore, the increased muscle mass may contribute to greater glucose uptake by skeletal muscle through enhanced translocation of the glucose transporter Type 4 to the plasma membrane, facilitating glucose entry into muscle cells and thereby potentiating the effects on insulin sensitivity(Reference Havers, Held and Schönfelder41).
The TRF group showed lower serum TC concentrations, even though it did not exhibit higher serum HDL levels – the lipoprotein responsible for reverse cholesterol transport – unlike the ADF and ADMF groups, which presented increased HDL concentrations. This reduction in serum TC may have been influenced by the higher palmitoleic acid concentration, which regulates the expression of enzymes involved in cholesterol absorption and elimination(Reference Huang, Hong and Bai42). However, the ADF group displayed higher serum LDL and TAG levels, differing from previous studies that did not report significant differences in the lipid profiles of the ADF and ADMF groups compared with the TRF group(Reference Alfheeaid, Alhowail and Ahmed43,Reference Bhoumik, Kumar and Rizvi44) .
In addition, the ADMF group showed increased hepatic TG content, which may be explained by the presence of hepatic rhamnose and the second-highest hepatic maltose concentrations, since excessive simple carbohydrates can promote TAG synthesis through de novo lipogenesis(Reference Rui45). As this group did not show an increase in serum TAG, we suggest that future studies compare hepatic and serum TAG levels under short- and long-term IF protocols to determine whether this finding reflects a transient or adaptive state.
ADF showed markedly lower glucose and maltose concentrations. This regimen imposes longer fasting intervals compared with the other interventions, promoting increased hepatic glycogenolysis to maintain blood glucose levels(Reference Hofer, Carmona-Gutierrez and Mueller46). This metabolic pattern favours greater utilisation of hepatic glycogen stores during the fasting period, followed by incomplete replenishment during the refeeding phase. Consequently, the lower hepatic sugar levels observed in this group indicate a more intense mobilisation of glycogen-derived intermediates(Reference Al-Bedak, Sakr and AL-Kolaibe47).
In contrast, the increase in hepatic sugars observed in the TRF and ADMF groups suggests an adaptive response of carbohydrate metabolism to the energetic fluctuations imposed by fasting and refeeding cycles. A previous study reported hepatic glycogen accumulation in TRF models (feeding restricted to 3 h) associated with a reduced expression of glycogen phosphorylase, the enzyme responsible for glycogen degradation. This downregulation diminishes glycogenolysis, leading to carbohydrate retention in the liver even under attenuated insulin signalling(Reference Park, Yoo and Hyun48). This excess of simple carbohydrates promotes de novo lipogenesis and consequently increases palmitic acid levels in these groups. The liver conversion of glucose into fat predominantly generates palmitic acid, a long-chain saturated fatty acid(Reference Annevelink, Sapp and Petersen49), which is associated with inflammation and several diseases, mainly cardiovascular(Reference Fatima, Hu and Gong50).
On the other hand, the TRF group presented a higher pentadecanoic acid concentration, which is an essential saturated fatty acid with anti-inflammatory properties(Reference Venn-Watson, Lumpkin and Dennis51). The increase in this fatty acid, together with lower serum total cholesterol, reduced hepatic palmitic acid and elevated palmitoleic acid levels, may reflect a favourable shift in lipid metabolism.
No histological alterations were observed in the liver of any experimental group. A previous study reported that 30 d of ADF significantly improved the severity of hepatic steatosis in mice fed a high-fat diet(Reference Deng, Liu and Wang17). It is important to note that the experimental model in the present study involved healthy rats, without prior induction of metabolic or hepatic dysfunction. Therefore, the absence of histological changes observed herein is consistent with the physiology of healthy liver tissue exposed to a short-term dietary regimen.
Regarding the histology of adipose tissue, CR displayed the smallest adipocyte size, reflecting in lower serum leptin concentrations, a hormone appetite and body weight reducer that is secreted by adipocytes in proportion to fat mass. Thus, low leptin levels resulted in less weight loss in the CR than in the ADF and ADMF groups(Reference Perakakis, Farr and Mantzoros52,Reference Perakakis and Mantzoros53) . In contrast, TRF presented a higher adiposity index and the largest adipocyte size in the morphometric analysis, although the TRF group presented similar calorie intake to the other groups during the 4 weeks. This result may be linked to the amount of hepatic sugars presented by this group, since the liver can convert glucose excess into fatty acids through de novo lipogenesis, and the new fatty acid molecules can subsequently be secreted into the circulation and stored in adipose tissue(Reference Rui45).
The CR and TRF groups presented smaller muscle fibres than the other groups. The CR regimen is known to decrease insulin-like growth factor type 1, which can trigger an anabolic response(Reference Hernández-Saavedra, Moody and Tang54), resulting in smaller muscle fibre sizes. A previous study by our research group showed a smaller area of muscle fibres in sedentary and trained rats subjected to TRF(Reference Dorand, Soares and da Silva Andrade9). Other studies have demonstrated that acute fasting (24 h) decreases activation of the mammalian target of rapamycin(Reference Sengupta, Peterson and Laplante55,Reference Wijngaarden, Bakker and van der Zon56) , which in turn prevents the breakdown of muscle proteins(Reference Hindi, Sato and Xiong57). Therefore, this may have been the mechanism, which led to atrophy of muscle cells in the TRF group. It is important to highlight that the evaluated muscle was the soleus, which plays a crucial role in maintaining venous return during sedentary upright activities such as sitting or standing(Reference McLeod58). Thus, atrophy of this muscle may impair circulatory efficiency and contribute to cardiovascular dysfunction. Moreover, the soleus is recognised as a common site of thrombosis and has been associated with the development of fatal pulmonary thromboembolisms(Reference Hirasawa, Shimizu and Haginoya59), emphasising the clinical relevance of these findings.
In contrast, the ADF and ADMF groups presented hypertrophic muscle fibres by histological analysis, which was confirmed by morphometric analysis that these groups presented larger muscle fibre sizes. Real-Hon et al.(Reference Real-Hohn, Navegantes and Ramos60) only observed hypertrophy in the gastrocnemius of Wistar rats subjected to ADF when associated with high-intensity interval training. However, they also observed an improvement in mitochondrial function from ADF, regardless of whether it was associated with high-intensity interval training or not(Reference Real-Hohn, Navegantes and Ramos60). Mitochondria are organelles that regulate metabolism and muscle function(Reference Porter, Reidy and Bhattarai61) and influence muscle hypertrophy through energy production and increased protein synthesis(Reference Romanello and Sandri62).
As a limitation of the study, we acknowledge the exclusive use of male Wistar rats. This choice was made to minimise variability arising from hormonal fluctuations of the oestrous cycle, which can significantly affect metabolic parameters and energy balance. While this decision enabled greater homogeneity and clarity in assessing the effects of different intermittent fasting regimens, it restricts the generalisability of the findings. Therefore, future studies including female subjects are warranted to explore potential sex-related differences and broaden the understanding of dietary intervention outcomes. Another limitation was the lack of direct monitoring of the rats’ circadian rhythms and physical activity, which constitute factors which may influence metabolic responses in IF regimens. However, food was provided during the rats’ active phase (dark period), thereby respecting their biological cycle and minimising potential effects of circadian misalignment. Moreover, we did not include groups subjected to different intermittent fasting regimens for an extended period to identify whether the results were only from the adaptation period or if they would be reversed over time.
Furthermore, future studies may conduct analyses such as the body composition of rats and quantify ketone bodies, which would allow greater clarity in the mechanisms through which IF demonstrates its results. However, it is essential to highlight the importance of the results of this study that compared the effects of different IF regimens frequently performed by the healthy adult human population and compared them with CR, which is the most used dietary intervention in clinical practice. In addition, we presented results that have been little explored in the literature, such as the hepatic fatty acid and sugar profiles and tissue histology associated with the main benefits of IF.
Our results demonstrated that TRF was the least effective among the IF regimens analysed in promoting improvements in the metabolic parameters of healthy male Wistar rats. Nevertheless, ADF and ADMF presented some advantages concerning the CR group, such as higher leptin concentration, which reduces caloric intake and consequently provokes greater weight loss, as well as higher HDL and greater muscle fibre size.
Supplementary material
For supplementary material/s referred to in this article, please visit https://doi.org/10.1017/S0007114525106120
Acknowledgements
The authors acknowledge Christopher Quinn for the English revision.
This work was supported by the BIOCLIN® (for donating the lipid analysis kits), Coordenação de Aperfeiçoamento de Pessoal de Nível Superior (CAPES, Brazil; financial code 001) and the Conselho Nacional de Desenvolvimento Científico e Tecnológico (grant number 303939/2025–7). The funders had no role in the design, analysis or writing of this article.
N. L. S.: Conceptualisation, data curation, formal analysis, funding acquisition, investigation; methodology, resources, project administration and roles/writing – original draft. A. D. S. A.: Investigation. M. L. V. D.: Investigation. L. M. G. D.: Formal analysis. M. C. L.: Formal analysis. A. M. T. M. C.: Formal analysis. A. A. S. B.: Formal analysis. A. F. A.: Formal analysis. M. S. L.: Formal analysis. K. S. B.: Conceptualisation, formal analysis, supervision and writing – review & editing. J. S. A.: Conceptualisation, formal analysis, funding acquisition, methodology, project administration, resources and supervision and writing – review & editing.
There are no conflicts of interest to declare.