I. INTRODUCTION
Nanoindentation has proven highly useful to extract mechanical properties of thin films and small specimens in respect to Young’s modulus and hardnessReference Oliver and Pharr1 over the last few decades. However, when studying anisotropic materials, the indentation method exhibits a severe drawback; the indentation response of anisotropic materials is a response averaging the properties of all crystal directions. As a result, the indentation modulus for single crystalline anisotropic materials does not represent in a straightforward manner the uniaxial Young’s modulus for the same crystal orientation.Reference Vlassak and Nix2, Reference Vlassak, Ciavarella, Barber and Wang3
In recent years, microcompression testing was introduced as an alternative method to investigate the mechanical properties of materials at a small scaleReference Uchic, Dimiduk, Florando and Nix4 and has yielded interesting results on size effects on a variety of materials.Reference Greer and De Hosson5, Reference Kraft, Gruber, Mönig and Weygand6 In general, a conventional nanoindenter equipped with a flat-end tip is used to compress the pillars while measuring load and displacement, thereby facilitating the determination of the engineering stress–strain curves. While most studies using microcompression testing focused on the onset of plasticity, the elastic response of micropillars has yet received less attention. A few experimental studies comment on the elastic moduli,Reference Volkert and Lilleodden7, Reference Volkert, Donohue and Spaepen8 as it was used to check the general validity of the experiments. Microcompression experiments typically exhibit deviations from macroscopic tests, and caution needs to be exercised when analyzing the experimental data.Reference Kiener, Motz and Dehm9, Reference Zhang, Schuster, Wei and Ramesh10 From the point of view of the elastic properties, the integral connection of the pillar to the base material is one main source of error. As shown by Choi et al.,Reference Choi, Uchic, Parthasarathy and Dimiduk11 a significant portion of the elastic deformation in a microcompression experiment is caused by the displacement of the substrate, whereas plasticity is mainly carried in the pillar itself. In in situ experiments on single crystalline Si pillars, the compliance of the pillar base was observed to account for almost 20% of the total applied strain.Reference Moser, Wasmer, Barbieri and Michler12
Typically in a microcompression experiment, the substrate compliance is accounted for by using the Sneddon equationReference Sneddon13 as initially used by Greer et al.Reference Greer, Oliver and Nix14 in their analysis of gold pillars. This correction procedure treats the pillar as a rigid flat punch elastically indenting an isotropic half-space. However, it was shown that the direct application of the Sneddon correction results in an overestimation of Young’s modulusReference Zhang, Schuster, Wei and Ramesh10, Reference Choi, Uchic, Parthasarathy and Dimiduk11 and requires the knowledge of the elastic material parameters for the samples. Although additional corrections accounting for the actual pillar geometry were suggested for elastically isotropic materials,Reference Choi, Uchic, Parthasarathy and Dimiduk11 those methodologies require extensive parametric studies using finite elements (FEs) to obtain solutions for anisotropic materials.
In this study, based on FE simulations and experiments, we suggest a methodology to determine the Young’s modulus of elastically anisotropic materials using microcompression tests without having prior knowledge of the material parameters. Silicon was chosen as model systems to ensure a robust numerical and experimental verification. The elastic properties of Si are well known, and Si is highly suitable for focused ion beam (FIB) machining, which is the method most commonly used for preparing the micropillars. FE simulations were performed to identify critical factors affecting the substrate compliance correction and thereby causing errors in the observed elastic properties. A theoretical framework to extract accurate values of elastic moduli was then established and verified by microcompression experiments on single crystalline Si of [111] and [100] orientations.
II. SIMULATION FRAMEWORK AND EXPERIMENTAL DETAILS
A. FE simulations
Using the commercial FE software ABAQUS (Version 6.5), a perfectly cylindrical pillar and a pillar of 5° taper angle between the sidewalls and the pillar axis were created. These two geometries are typical of the sample preparation using a FIB. The “ion lathe” methodReference Uchic, Dimiduk, Florando and Nix4 produces cylindrical pillars and minimizes the rounding of the pillar edges. Almost cylindrical pillars can also be prepared by the top–down preparation process introduced by Greer et al.Reference Greer, Oliver and Nix14 down to pillar diameters of 300 nm. The faster top–down two-step process used by Volkert and LilleoddenReference Volkert and Lilleodden7 creates slightly tapered pillars.
In our simulations, we chose a taper angle of 5°, which is higher than what can be achieved by optimizing the milling parameters but was supposed to give a clear picture of the influence exerted by the taper. In the work of Volkert and Lilleodden,Reference Volkert and Lilleodden7 a taper angle of 2° was reported for Au pillars.
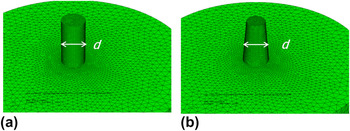
The pillar diameter d and the height L 0 were varied to investigate the effect of aspect ratios L 0/d between 1 and 8. The model boundaries are sufficiently far away from the pillar to guarantee that the boundary conditions have no significant effect on the properties investigated. Axisymmetric meshes with four-node tetrahedral elements were constructed as shown in Fig. 1. Elastic anisotropic homogeneous material behavior was assumed with the following elastic constants of Si as input parameters: C 11 = 166 GPa, C 12 = 64 GPa, C 44 = 80 GPa,Reference Brantley15 and its Zener anisotropy ratio  $A = 2C_{44} /(C_{11} - C_{12} )$ is 1.56. The results obtained from the FE simulation of Si were supported by another set of simulations using the elastic constants of Fe, C 11 = 233 GPa, C 12 = 124 GPa, C 44= 117 GPa, having a higher anisotropy ratio of 2.14 as compared to that of Si.
Geometrical model showing the undeformed meshes of (a) the cylindrical and (b) the tapered pillar.

In general, the Young’s modulus E is calculated as
 $$E = {{F\,L_{\rm{0}} } \over {A\,{\rm{\Delta }}L}}\quad,$$
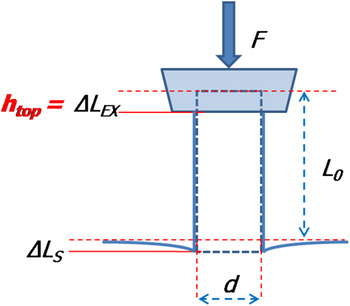
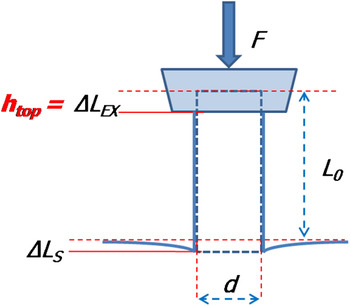
where F is the applied load, A the cross-sectional area of the pillar, L 0 the initial pillar height, and ΔL the change of the pillar height. In principle, in the microcompression experiment, the change of the pillar height ΔL is measured as the top surface displacement from instrumented indentation h top. In this measurement itself, the substrate deformation ΔL s, which results from the deflection of the material underneath the micropillars as schematically illustrated in Fig. 2, is not accounted for. Thus, the apparent modulus E ais calculated as
 $$E_{\rm{a}} {\rm{ = }}{{F\,L_{\rm{0}} } \over {A\,h_{{\rm{top}}} }}\quad.$$
Schematic of the pillars with relevant parameter: F is applied load, L 0 pillar height, d pillar diameter, ΔL EX top surface displacement, h top flat punch indenter displacement, and L Ssubstrate deformation. Changes of volume are not shown.
The effect of the taper on the base compliance was examined for a 5° taper angle and an aspect ratio of 2 as shown in Fig. 1(b). In the case of the tapered pillar, the cross section at half the height was used as the representative area A in Eqs. (1) and (2), where the nominal elastic response is expected to be the average of the top and bottom. The half-height cross section later leads to accurate modulus measurement in simulation for the tapered pillar with the aspect ratio of 2.
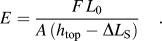
Furthermore, the modulus for different aspect ratios was determined with the substrate deformation accounted for. First, the displacement of the bottom corner node ΔL s of the pillar mesh was extracted and subtracted from h top to arrive at an accurate change in value of the pillar height ΔL, resulting in
 $$E\,\,{\rm{ = }}\,{{F\,L_{\rm{0}} } \over {A\,{\rm{(}}h_{{\rm{top}}} - {\rm{\Delta }}L_{\rm{S}} {\rm{)}}}}\quad.$$
Second, the substrate deformation was accounted for by using the Sneddon equation.Reference Sneddon13 The displacement of the substrate is given as
 $${\rm{\Delta }}L_{\rm{S}} \,{\rm{ = \Delta }}L_{{\rm{Sneddon}}} \,{\rm{ = }\,}{{\left( {{\rm{1}} - v_{\rm{sub}}^2 } \right)} \over {E_{{\rm{sub}}} }}{F \over {{\rm{2}}a}}\quad,$$
where E sub and v sub are the Young’s modulus and Poisson’s ratio of the substrate, respectively, and a is the contact radius of the indenter, which is d/2 for the cylindrical indenter.
A previous simulation studyReference Zhang, Schuster, Wei and Ramesh10 showed that the influence of the fillet at the pillar base is not critical in the elastic regime and that the deviation is less than 8% even for  $2r_c /d\, = \,1$, where r c is the fillet radius. The misalignment between the tip and the pillar affects the elastic loading curve,Reference Choi, Uchic, Parthasarathy and Dimiduk11 and can be assessed experimentally by monitoring stable stiffness behavior.Reference Greer, Oliver and Nix14 However, the effect on the unloading portion of the curve, typically used to determine the elastic modulus, is negligible, as is the influence of the friction coefficient.Reference Schwaiger, Weber, Moser, Gumbsch and Kraft16 Thus, the effects of the fillet radius between pillar and base material, on contact friction between the tip and the pillar, and slso the effects of misalignment, were not investigated in this study
B. Microcompression experiment
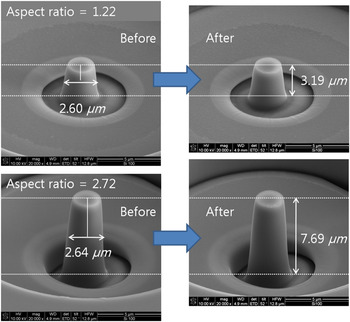
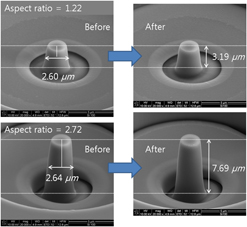
Micropillars were prepared from two different crystallographic orientations of Si, i.e., [100] and [111]. The pillars were machined using a FIB (FEI Nova 200 NanoLab Dual Beam, FEI, Hillsboro, OR) following the two-step procedure used by Volkert and Lilleodden.Reference Volkert and Lilleodden7 Pillars of 2 μm diameter and aspect ratios of approximately 1:1 and 2:1 were prepared (Fig. 3). The pillar diameter at half the pillar height was approximately 2.6 μm, and the average taper angle for an aspect ratio of 2 was 4.1°. The taper angle was calculated by arctan ( $d_{bottom} - d_{top} /2 * L_0 $), where d top is the diameter of top surface and d bottom the bottom diameter of the pillar. The dimensions of every column were determined before and after the experiments. The pillars were compressed using a Nanoindenter NanoXP (now: Agilent, Santa Clara, CA) equipped with a flat punch diamond tip of 10 μm diameter. The loading and unloading rates were 250 μN/s and load–displacement data were recorded during the experiment. Six loading–unloading cycles with incremental ramping were applied to ensure both good contact and reduced misalignment between the tip and the top surface of the micropillar and to obtain more data from each column. The machine compliance was taken into account, and the displacement was corrected for thermal drift effects by monitoring the displacement at 10% of the maximum load after the final loading as provided in the standard test methods for the nanoindenter. A total of eight experiments per aspect ratio and crystal orientation were performed. The apparent modulus E a was calculated following Eq. (2) with the stiffness F/ΔL determined from a linear fit to the first 20% of the unloading data of the load–displacement curve. The effective cross-sectional area of the tapered pillars was set at half the pillar height just as in the FE simulation.
Scanning electron microscopy images of Si pillars with aspect ratios of 1.22 and 2.72 before and after compression. No plastic deformation can be observed as indicated by the dashed lines.

III. SIMULATION RESULTS AND PROPOSED METHODOLOGY
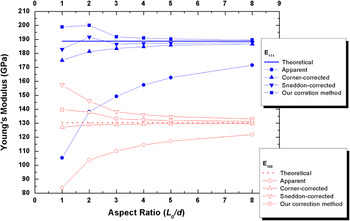
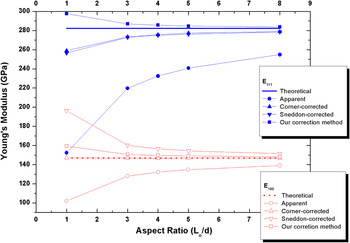
The apparent modulus E a of cylindrical pillars obtained from the simulations is shown with respect to aspect ratio for both [111] and [100] orientations in Fig. 4. The full and open circles correspond to E a of the [111] and [100] orientations, respectively. Clearly, the apparent modulus in the [111] direction ( $E_{\rm{a}}^{{\rm{[111]}}} $) is larger than that in the [100] direction (
 $E_{\rm{a}}^{[100]} $) for all aspect ratios reflecting the expected anisotropic response of the material. Although the modulus value increases with increasing aspect ratio for both orientations, the values are significantly smaller than the theoretical values, which are denoted by the dotted and solid straight lines in Fig. 4. Young’s moduli
 $E_{{\rm{th}}}^{[100]} $ and
 $E_{{\rm{th}}}^{{\rm{[111]}}} $ of 130.4 and 188.7 GPa, respectively, would be expected. The previous simulation studiesReference Zhang, Schuster, Wei and Ramesh10, Reference Choi, Uchic, Parthasarathy and Dimiduk11, Reference Yang, Ye, Lu, Liu and Liaw17 attributed the general underestimation as well as the aspect ratio dependency of the elastic modulus to the deformation of the substrate.
Results of the FE analysis: Modulus versus aspect ratio for single crystalline Si for two crystal orientations, namely [111] and [100]. Theoretical values for the uniaxial modulus are compared to the three different correction methods discussed in the text.

The different methods correcting for the deformation of the substrate are compared in Fig. 4. As denoted by the triangular symbols in Fig. 4, the modulus value corrected by the displacement of the corner node is close to the theoretical value clearly indicating that the deformation of the substrate represents a major contribution to errors in the determination of the elastic modulus. The corner-corrected value is generally lower than the theoretical one particularly for lower aspect ratios, which agrees with the results obtained by other groups.Reference Choi, Uchic, Parthasarathy and Dimiduk11, Reference Yang, Ye, Lu, Liu and Liaw17 The stress and the strain fields inside the pillar are not uniform near the corner edges of the pillar, which becomes relatively more dominant as the pillar ratio decreases. Thus, the simple displacement correction based on the corner node displacement is not sufficient to take into account the complex effect of substrate deformation and is experimentally almost impossible to perform.
Applying the Sneddon correction with a uniaxial Young’s modulus is simple and easy. However, this implies that one knows the uniaxial moduli and Poisson’s ratios beforehand. Moreover, the Sneddon correction with uniaxial Young’s moduli can lead to both overestimation and underestimation of the elastic modulus depending on crystal orientation and aspect ratio since the Sneddon’s equation was derived assuming an isotropic elastic half-space. As shown in Fig. 4, we observed maximum overestimation for  $E_{\rm{s}}^{{\rm{[100]}}} $ of 21% compared to
 $E_{{\rm{th}}}^{[100]} $ whereas the maximum underestimation for
 $E_{\rm{s}}^{{\rm{[111]}}} $ by −3% for the aspect ratio (L 0/d) = 1. The overestimation of the elastic modulus was also observed in computational studies of isotropic materials.Reference Choi, Uchic, Parthasarathy and Dimiduk11, Reference Yang, Ye, Lu, Liu and Liaw17 However, the underestimation of the modulus in case of the [111] direction clearly indicates that the Sneddon correction works differently for different orientations. The observation of this opposite trend can be corrected as follows. It is known that the Young’s modulus obtained from indentation, E ind, for an anisotropic material is not the same as the uniaxial Young’s modulus since the indentation response of anisotropic materials is a response averaging over all crystal directions. Vlassak et al.Reference Vlassak and Nix2, Reference Vlassak, Ciavarella, Barber and Wang3 theoretically derived a solution for the indentation modulus M for different crystal orientations, which is extracted directly from the indentation by
 $(\pi ^{1/2} /2\beta )/(S/A^{1/2} )$, where S is the indentation stiffness of the sample, β is a geometrical constant, and A is the maximum contact area of the indenter. Based on Vlassak’s solution, the indentation modulus of single crystalline Si for [100] and [111] orientations are calculated as
 $M_{\rm{c}}^{{\rm{[100]}}} $ = 165.3 GPa,
 $M_{\rm{c}}^{{\rm{[111]}}} $ = 175.9 GPa. According to the indentation theory, M is equivalent to the plane stress modulus K, which has a relation with Young’s modulus through
 $K = E/(1 - v^2 )$. The plane stress moduli from the theoretical uniaxial values can then be calculated as
 $K_{{\rm{th}}}^{{\rm{[100]}}} $ = 141.5 GPa,
 $K_{{\rm{th}}}^{{\rm{[111]}}} $ = 195.0 GPa (the Poisson’s ratio is also anisotropic for the cubic structure.Reference Brantley15, Reference Ballato18, Reference Franca and Blouin19 For single crystalline Si, v 111 is 0.18 and v 100 is 0.28). Since
 $K_{{\rm{th}}}^{{\rm{[100]}}} $ is smaller than
 $M_{\rm{c}}^{{\rm{[100]}}} $, the substrate response is apparently more compliant if K is used instead of M in Eq. (4). In other words, the correction ΔL Sneddon becomes bigger, which leads to a larger correction of the modulus and causes the overestimation of Young’s modulus in Eq. (3). On the other hand,
 $K_{{\rm{th}}}^{{\rm{[111]}}} $ is bigger than
 $M_{\rm{c}}^{{\rm{[111]}}} $ , which results in an underestimation of Young’s modulus. Thus, as shown in Eq. (5), we suggest using the indentation modulus M as effective modulus shown in the Sneddon’s equation instead of the uniaxial modulus E to correct for the substrate compliance of elastically anisotropic materials.
 $${\rm{\Delta }}L_{\rm{S}} \,{\rm{ = \Delta }}L_{{\rm{Sneddon}}} \,{\rm{ =\, }}{{\rm{1}} \over M}{F \over d}\quad.$$
By inserting Eq. (5) into Eq. (3), we can rearrange the equation of the adjusted Young’s modulus as follows
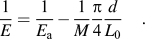 $${{\rm{1}} \over E}{\rm{\, =\, }}{{\rm{1}} \over {E_{\rm{a}} }} - {{\rm{1}} \over M}{{\rm{\pi }} \over {\rm{4}}}{d \over {L_{\rm{0}} }}\quad.$$
Using Eq. (6), value of the modulus can successfully be extracted from microcompression tests as denoted by the rectangular symbols in Fig. 4. The correction for E [100] is markedly improved since the difference between  $K_{{\rm{th}}}^{{\rm{[100]}}} $ and
 $M_{\rm{c}}^{{\rm{[100]}}} $ is significant. Compared to the theoretical values, the maximum deviation decreases from 21% to 7.4% for the aspect ratio of 1. For E [111], our correction method results in a maximum overestimation of 6%, whereas the Sneddon correction with the uniaxial elastic constants results in an underestimation of 3%. However, the overestimation at low aspect ratio should be expected if our correction method is physically more relevant than that with uniaxial modulus because the overestimation was unavoidable even for isotropic materials.Reference Choi, Uchic, Parthasarathy and Dimiduk11, Reference Yang, Ye, Lu, Liu and Liaw17 It should also be noted that the maximum point was observed in the Sneddon correction for
 $E_{\rm{S}}^{{\rm{[111]}}} $ at aspect ratio of 2. Since E a [in Eq. (6)] is also a function of the aspect ratio, the maximum value can occur depending on the materials parameters M or K.
The validity of this theoretical approach was also checked with the simulation of Fe micropillar testing as shown in Fig. 5. The same trend of overestimation and underestimation of Sneddon’s correction with Young’s modulus of the [100] and [111] orientations, respectively, can be seen, whereas the Sneddon correction using the indentation modulus M 100 = 223.0 GPa, M 111= 245.3 GPa also results in overestimation but with smaller deviation from the theoretical Young’s modulus values.
Results of the FE analysis: Modulus versus aspect ratio for single crystalline Fe for two crystal orientations, namely [111] and [100]. Theoretical values for the uniaxial modulus are compared to the three different correction methods discussed in the text.

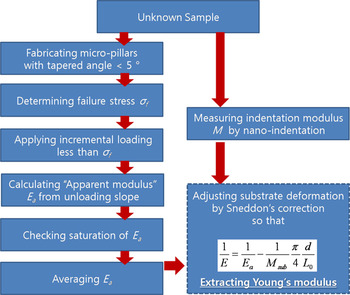
Based on the simulation, we propose the methodology depicted in Fig. 6 for determining the elastic modulus. The deformation of the pillars should be in the elastic regime. Furthermore, an aspect ratio of the pillars larger than 2 is recommended to determine a more accurate value of the Young’s modulus. It is noteworthy that the method does not require prior knowledge or assumption of any elastic constant of the material including Poisson’s ratio. Before the method was verified experimentally as explained Sec. IV, the taper effect had also been investigated by simulation. The apparent elastic modulus E afor an aspect ratio of 2 with a 5° taper angle is 104.65 GPa for the [100] orientation and 140.08 GPa for the [111] orientation. Since the apparent modulus of the straight pillar with aspect ratio of 2 is 103.84 GPa for the [100] orientation and 138.25 GPa for the [111] orientation, the effect of the taper angle is negligible for both orientations. Therefore, the substrate correction derived based on the pillars without taper can be applied to the case of the tapered Si pillars investigated in this study.
Experimental procedure to extract Young’s modulus, requiring microcompression testing and conventional nanoindentation, e.g., with a Berkovich tip. Note that the knowledge of any material parameters prior to the testing is not necessary.

IV. EXPERIMENTAL VERIFICATION
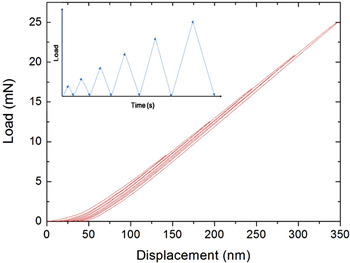
First, the fracture stress of the Si micropillars was determined; a pillar having an aspect ratio of 2 was compressed until failure. Failure occurred at a load of 37 mN. For all other tests, the maximum load was then set to 25 mN lying well within the elastic regime. In the case of materials that deform plastically, the maximum load corresponds to the onset of plastic yield. A typical multiple loading curve of the Si pillars is shown in Fig. 7. It can be seen that the curve is initially bent upwards, which is typically assigned to a slight misalignment of the flat punch and the pillar surface.Reference Choi, Uchic, Parthasarathy and Dimiduk11
Representative multiple loading curves of a microcompression test on a Si [111] pillar. The loading portions of the curves are initially bent upwards, indicating a slight misalignment between the flat punch and the pillar surface. For the measurement of Young’s modulus, the slope of the unloading curves is determined.

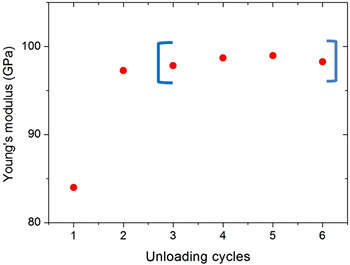
As shown in Fig. 8, the apparent modulus value determined from the experimental data is smaller in the first loading cycle (displacement of 140 nm) and reaches a stable value for larger displacements. This indicates that for the larger displacements, the influence of misalignment is reduced, and it no longer affects the stiffness value determined from the unloading response. The final modulus value for each test is calculated by averaging the modulus values of the cycles from three to six. A similar approach has been applied by Greer et al.Reference Greer, Oliver and Nix14 The stiffness response of a pillar was monitored during loading with respect to the displacement of the pillar top. Initially, the stiffness was less than its theoretical value and increased in a nonlinear manner due to misalignment. As the displacement increased further, the misalignment adjusted and the stiffness showed a linear increase expected for plastic deformation. As shown in Fig. 3, there is no change in the pillar heights following microcompression tests confirming purely elastic deformation.
Apparent modulus as obtained from the multiple load–displacement curves of a representative pillar sample in Fig. 7. The unloading portions of the different loading cycles were analyzed. The stiffness was determined from a linear fit to the first 20% of the unloading curve.

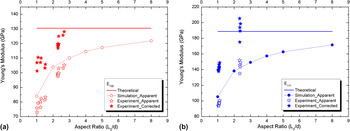
Young’s moduli from the experimental microcompression tests are plotted together with the simulation results in Fig. 9. For both orientations, the open stars correspond to the experimentally determined apparent modulus, and the full star symbols denote the modulus corrected by the suggested method. In addition, the circles represent the apparent modulus from the simulations, whereas the solid lines denote the theoretical Young’s modulus. As summarized in Table I, for Si with [100] orientation, the apparent Young’s modulus is 79.4 GPa and 100.8 GPa for the average aspect ratios of 1.19 and 2.39, respectively. For the [111] direction, the experiment yields 97.9 GPa and 145.1 GPa for the average aspect ratios of 1.07 and 2.36, respectively. Although the apparent modulus of experimental values are smaller than that of simulations, the experimental values are in reasonably good agreement with the simulation results underestimating Young’s modulus and increasing with increasing aspect ratio as shown in Fig. 9.
Experimental results of Young’s modulus of Si determined by microcompression tests of (a) [100] pillars and (b) [111] pillars. For correction, the procedure outlined in Fig. 6 was applied.

Experimental measurement of Young’s modulus of single crystalline Si by microcompression test. The average value together with one standard deviation is given.

Following the procedure outlined in Fig. 6, we performed nanoindentation on both Si (100) and Si (111) wafers to obtain the indentation moduli M 100 = 173.1 ± 2 GPa and M 111 = 187.4 ± 3 GPa, which were used as input in Eq. (6). The values of experimentally obtained indentation moduli are higher than the theoretically calculated ones by approximately 8%. This may be caused by the geometry difference between a Berkovich indenter and a flat punch indenter in the nonideal experimental situation, which will certainly change the stress field. Additionally, Si undergoes phase transformation during indentation, which affects the modulus measurement as well.Reference Kailer, Nickel and Gogotsi20–Reference Jang, Lance, Wen, Tsui and Pharr22 In general, caution needs to be exercised while determining elastic moduli from nanoindentation experiments. The Oliver–Pharr analysis, which is typically used to determine hardness and modulus, is based on an elastic analysis and may not predict the contact areas correctly for materials in which pileup occurs.Reference Bolshakov and Pharr23 The indents themselves need to be inspected to ensure an adequate identification of the contact areas and thus the modulus, which may be overestimated by as much as 20–30% in materials with limited work hardening.
The apparent elastic modulus determined from the microcompression of Si pillars was then corrected using Sneddon’s correction with the indentation modulus Eq. (6). The modification of Eq. (6) is necessary to apply to the tapered pillars since the bottom diameter in Eq. (5) is not the same as the half-height effective diameter. The bottom diameter can be written as  $d_{bottom} = \beta \ast d_{eff} $, where
 $\beta = 1 + (L_0 /d_{eff})\ast \tan \theta $. Here, d eff is the half-height effective diameter and θ a taper angle. The average β values for the tested pillars are 1.17. The corrected modulus results are summarized in Table I as well. For Si with [100] orientation, Young’s modulus was determined as 106.5 and 123.2 GPa for the average aspect ratios of 1.19 and 2.39, respectively. These values show the deviation from the theoretical values of −18.1% and −5.3%. For the [111] direction, the experiments yield 142.5.2 and 192.4 GPa for the average aspect ratios of 1.07 and 2.36, respectively. Here, the deviation from the theoretical value is −24.5% and 2.0%. From these results, it is confirmed that the aspect ratio of the pillars should be greater than 2. Interestingly, the experimentally corrected modulus for aspect ratio of 1 is quite small, smaller than those of simulations. This is probably related to the quite inhomogeneous stress and strain state at the bottom of the pillar for smaller aspect ratio caused by the boundary conditions. This cannot be fully accounted for by our approach. For the case of plastic deformation, an aspect ratio of at least 3:1 has been recommended due to the top and bottom constraints affecting the deformation in the bottom and top thirds of the pillars.Reference Uchic, Dimiduk, Florando and Nix4, Reference Greer, Oliver and Nix14 For elastic deformation and aspect ratios greater than 2.4, however, the correction method suggested in this paper works well to determine the anisotropic Young’s modulus of single crystalline silicon without having prior knowledge of the elastic constants.
V. SUMMARY
It was shown that microcompression can be applied to determine Young’s modulus for elastically anisotropic materials, as exemplified for two different orientations of single crystalline Si. While there is a clear difference in the apparent Young’s moduli for the different orientations, a significant underestimation of Young’s modulus was observed resulting from the substrate deformation as observed in both FE simulation and experiment. This effect decreases with increasing values of aspect ratio. The apparent modulus values from the simulation are in good agreement with those from the experiments. We suggested the experimental procedure to measure Young’s modulus of anisotropic materials from microcompression test. The procedure based on the Sneddon correction with indentation modulus requires no prior knowledge of elastic properties to correct for the effect of substrate compliance. Young’s moduli of single crystalline silicon in the [100] and [111] directions were determined within −5.3% and 2.0% deviation from the literature values, respectively, for the aspect ratio of 2.4.
ACKNOWLEDGMENTS
The authors thank Prof. Joost Vlassak for helpful discussions and calculation of indentation moduli. This research was supported by the Deutsche Forschungsgemeinschaft (DFG) in the framework of the DFG Research Group FOR714 and Converging Research Center Program through the Ministry of Education, Science and Technology in Korea (2010K001435).