


1. Introduction
Nearly one in five people in the OECD is now aged 65 or over, and this share is projected to exceed a quarter by 2050 (OECD, 2024). This demographic transformation poses a critical dual challenge for aging democracies around the world: it simultaneously intensifies fiscal pressures arising from higher pension spending combined with fewer working-age individuals, just as it bolsters the political influence of an aging electorate, making pension reform especially difficult. A longstanding literature has contributed to our understanding of the electoral politics of pension retrenchment, highlighting risks of electoral backlash by older citizens against the governing party that implements the reform (Pierson, Reference Pierson1994, Reference Pierson1996; Häusermann, Reference Häusermann2010; Starke, Reference Starke and Greve2021). However, we still lack causal evidence on whether pension expansions can increase political participation among older citizens. Addressing this question is important because pensions constitute a large share of welfare state spending (often rivaling or exceeding public healthcare expenditures [OECD, 2024]). Thus, understanding the political responsiveness of an increasingly powerful older electorate is also crucial for understanding contemporary political dynamics in aging democracies (Vlandas, Reference Vlandas2026).
There are competing expectations about the likely impact of pension expansions on older voters’ political participation. On the one hand, parts of the policy feedback literature found that benefit expansions can mobilize beneficiaries through both material resource effects and psychological mechanisms. Recent examples include Medicaid (Clinton and Sances, Reference Clinton and Sances2018), minimum wages (Markovich and White, Reference Markovich and White2022), basic income (Loeffler, Reference Loeffler2023; Hirvonen et al., Reference Hirvonen, Schafer and Tukiainen2024), and various social cash transfers (De La, Reference De La and Ana2013). There is also a strong correlation between income and turnout, both among retired public sector workers in Illinois and within the US elderly population more broadly (Supplementary Appendix A0). Thus, large and salient increases in income could plausibly raise individuals’ political participation even later in life. On the other hand, recent evidence points to important limits to such mobilization effects. Several studies find null, conditional, or more indirect effects of income changes on adult political behavior (Akee et al., Reference Akee, Copeland, Costello, Holbein and Simeonova2018; Broockman et al., Reference Broockman, Rhodes, Bartik, Dotson, Miller, Krause and Vivalt2024; Hamel, Reference Hamel2025). Older voters also represent a particularly hard case for policy feedback effects, as they already exhibit relatively high baseline participation and more entrenched voting habits (Green and Shachar, Reference Green and Shachar2000; Plutzer, Reference Plutzer2002; Fowler, Reference Fowler2006; Denny and Doyle, Reference Denny and Doyle2009; Coppock and Green, Reference Coppock and Green2016; De Kadt, Reference De Kadt2017). As a result, habit formation and ceiling effects could limit the scope for additional mobilization.
Given these competing expectations, whether greater pension generosity increases turnout among elderly voters remains an open question. To address this gap, we analyze a 1998 pension reform in Illinois that granted a substantial and permanent benefit increase to public-sector employees who retired after a legislated cutoff date. This quasi-experimental setting, in combination with administrative data, enables us to employ a regression discontinuity design (RDD) to causally estimate the effect of a 36% increase in pension income on retirees’ subsequent political participation. Our analysis reveals no discernible mobilizing effect across twelve subsequent elections. This null finding holds consistently across various subgroups, including individuals with lower pre-reform income levels who experienced the largest relative gains, and across both Democrats and Republicans. These results suggest that even considerable material benefits may be insufficient to alter the political participation of older citizens, at least in the case of US public employees. Our findings thus contribute to the ongoing scholarly debates on policy feedback, habit formation, and the politics of welfare state reforms, as well as the unique political dynamics of aging democracies.
2. Methodology
2.1. Institutional context: pension reform in Illinois
In 1998, Illinois reformed its pension formulas for two public-sector retirement systems: the State Employees’ Retirement System and the State Universities Retirement System. The reform replaced a stepped formula with a flat-rate multiplier of 2.2% for each year of service (The Civic Federation, 2015). This “2.2 formula” raised the replacement rate for a typical long-serving worker from around 50% to 68.2% (see Supplementary Appendix A1 for further details). Crucially, the increased benefits were only granted to individuals retiring on or after January 1, 1998. Employees who had retired before that date remained under the previous formula. This created a sharp and lasting benefit gap between otherwise similar retirees, based solely on their retirement date.Footnote 1
The reform passed with bipartisan support and was signed into law by Republican Governor Jim Edgar in his final year in office, shortly before he was succeeded by another Republican, George Ryan. Several features of the reform make it a strong case for testing the political effects of benefit expansions. First, the financial stakes were exceptionally high: eligible retirees received an average increase of over $10,000 in annual benefits, representing on average a 36% rise in benefit level. This exceeds the relative income gains from minimum wage increases that have been shown to mobilize low-wage voters (Markovich and White, Reference Markovich and White2022). Second, the reform changed the defined-benefit pension formula, generating a large, permanent, and predictable income increase. Unlike most private-sector workers, a significant portion of US state and local government workers are not covered by Social Security (Supplementary Appendix A1.3), which makes them highly dependent on their public pension (Quinby et al., Reference Quinby, Aubry and Munnell2020; State Universities Retirement System of Illinois, 2023). This is the case for public-sector retirees in Illinois who experience retirement income changes primarily through statutory benefit formulas (Supplementary Appendix A1.2). Third, public-sector workers are more likely to be members of trade unions, which actively disseminate information about policy changes. Such informational channels are central to policy feedback mechanisms, as material gains can more strongly translate into political behavior if beneficiaries recognize and attribute the policy change. Taken together, these features created a salient, high-stakes policy change which makes it a strong test of whether there are any policy feedback effects among elderly voters.
2.2. Data and matching
We construct a unique individual-level dataset by combining two administrative sources: public pension records from the State of Illinois and the complete Illinois State Voter File (Illinois State Board of Elections, 2022). We match individuals across datasets using information about the first name, last name, and age of every individual. This process allowed us to link the pension records of 93,606 public employees to their official turnout history for every presidential election and midterm election (including gubernatorial and other state-level contests) from 1992 to 2020 based on the voter file of Illinois (>8.7 m voters). Consistent with recent work using administrative records (Markovich and White, Reference Markovich and White2022), individuals in the pension database who could not be matched to the voter file are treated as non-voters. Reassuringly, turnout among uniquely matched retirees in the 2020 presidential election closely aligns with expectations for public-sector workers and exceeds the statewide average, suggesting that the matching procedure does not introduce systematic bias (Supplementary Appendix A2 on the matching procedure).
2.3. Empirical strategy
We estimate the causal effect of pension benefit increases on turnout using a sharp RDD. The forcing variable,  ${X_i}$ is the number of days between an individual’s retirement date and the January 1, 1998 cutoff. Our design compares individuals who retired just before the cutoff and those who retired just after. Therefore, it does not compare retirees to non-retired individuals or include those who are still working. Crucially, the narrow bandwidth of the RDD ensures that individuals in the treatment and control groups are of similar ages and part of the same generation, effectively controlling for life-cycle and generational effects on voting that can confound other observational designs (Blais et al., Reference Blais, Gidengil and Nevitte2004; Kostelka and Blais, Reference Kostelka and Blais2021). We estimate the local average treatment effect (LATE),
 $\lambda $, on the binary outcome for voting (
 ${Y_i}$) using the following local linear regression:
 \begin{equation*}{Y_i} = \alpha + \lambda {D_i} + {\beta _1}\left( {{X_i} - c} \right) + {\beta _2}{D_i}\left( {{X_i} - c} \right) + {\delta _K}{K_i} + {\epsilon _i}\end{equation*}
where  ${D_i}$ is the treatment indicator for individual
 $i$;
 $c$ is the cutoff value;
 ${K_i}$ is a vector of control variables including gender, retirement age, and final salary; and
 ${\epsilon _i}$ is the error term. Covariates are included for precision; identification does not rely on conditioning on them, and results are robust to specifications omitting covariates (Supplementary Appendix A3.3). We use the optimal bandwidths from Calonico et al. (Reference Calonico, Cattaneo and Titiunik2014). The validity of the design is supported by a series of tests including power analysis, sorting, and jackknife estimations (Supplementary Appendix A4).
3. Results
To visualize the difference in benefit levels between eligible and ineligible individuals, the top panel of Figure 1 plots the pension benefit levels for public employees against the number of months before and after the reform’s implementation. The large and sharp discontinuity at the cutoff provides clear evidence of an immediate and strong effect of the reform on generosity levels. In contrast, the bottom panels show no visible descriptive difference in political participation between retirees on either side of the threshold.Footnote 2
This figure shows pension benefits and turnout by retirement date. The top panels display the average annual pension benefit level of retirees in 2021 (y-axis) by their month of retirement (x-axis) for both state and state university employees. The bottom panels plot the corresponding turnout rates for these same individuals. In all panels, the vertical line indicates the reform-specific cutoff date of January 1, 1998. In the lower panels, the circles denote turnout in presidential elections, while triangles represent turnout in midterm/gubernatorial (state-level) elections. Orange and blue symbols distinguish between the eligible (treatment) and non-eligible (control) groups, respectively. Midterm/gubernatorial bins are based on smaller sample sizes than presidential bins and therefore may appear more variable due to sampling noise. Quadratic lowess curves are overlaid on the panels to aid visual identification of any discontinuity at the cutoff.

Figure 1 Long description
Two scatter plots under the heading State Employees (SRS). SRS pension benefits plot: The vertical axis label reads Pension Benefits (in dollars). The horizontal axis label reads Date of Retirement. The horizontal axis shows Jan 1988, Jul 1988, Jan 1989, Jul 1989, Jan 1990, Jul 1990, Jan 1991, Jul 1991, Jan 1992, Jul 1992, Jan 1993, Jul 1993, Jan 1994, Jul 1994, Jan 1995, Jul 1995, Jan 1996, Jul 1996, Jan 1997, Jul 1997, Jan 1998, Jul 1998, Jan 1999, Jul 1999, Jan 2000, Jul 2000, Jan 2001, Jul 2001, Jan 2002, Jul 2002, Jan 2003, Jul 2003, Jan 2004, Jul 2004, Jan 2005, Jul 2005, Jan 2006, Jul 2006, Jan 2007, Jul 2007, Jan 2008, Jul 2008, Jan 2009, Jul 2009, Jan 2010, Jul 2010, Jan 2011, Jul 2011, Jan 2012, Jul 2012, Jan 2013, Jul 2013. The vertical axis shows 0k, 20k, 40k, 60k, 80k, 100k. A vertical dashed line is drawn at Jan 1998. Points appear in two groups separated by the dashed line. A fitted curve is drawn for the points before Jan 1998 and another fitted curve is drawn for the points after Jan 1998. The fitted curve after Jan 1998 is positioned higher than the fitted curve before Jan 1998. SRS turnout rate plot: The vertical axis label reads Turnout Rate. The horizontal axis label reads Date of Retirement. The horizontal axis shows the same date labels from Jan 1988 through Jul 2013. The vertical axis shows 0 percent, 25 percent, 50 percent, 75 percent, 100 percent. A vertical dashed line is drawn at Jan 1998. Points appear in two horizontal bands across the date range. A fitted curve is drawn for the points before Jan 1998 and another fitted curve is drawn for the points after Jan 1998. The fitted curves remain within the same two bands across the dashed line. Two scatter plots under the heading State Universities (SURS). SURS pension benefits plot: The vertical axis label reads Pension Benefits (in dollars). The horizontal axis label reads Date of Retirement. The horizontal axis shows the same date labels from Jan 1988 through Jul 2013. The vertical axis shows 0k, 20k, 40k, 60k, 80k, 100k. A vertical dashed line is drawn at Jan 1998. Points appear in two groups separated by the dashed line. A fitted curve is drawn for the points before Jan 1998 and another fitted curve is drawn for the points after Jan 1998. The fitted curve after Jan 1998 is positioned higher than the fitted curve before Jan 1998. SURS turnout rate plot: The vertical axis label reads Turnout Rate. The horizontal axis label reads Date of Retirement. The horizontal axis shows the same date labels from Jan 1988 through Jul 2013. The vertical axis shows 0 percent, 25 percent, 50 percent, 75 percent, 100 percent. A vertical dashed line is drawn at Jan 1998. Points appear in two horizontal bands across the date range. A fitted curve is drawn for the points before Jan 1998 and another fitted curve is drawn for the points after Jan 1998. The fitted curves remain within the same two bands across the dashed line. Legend text at the bottom: election type: general election; midterm or gubernatorial election. eligibility status: eligible; not eligible.
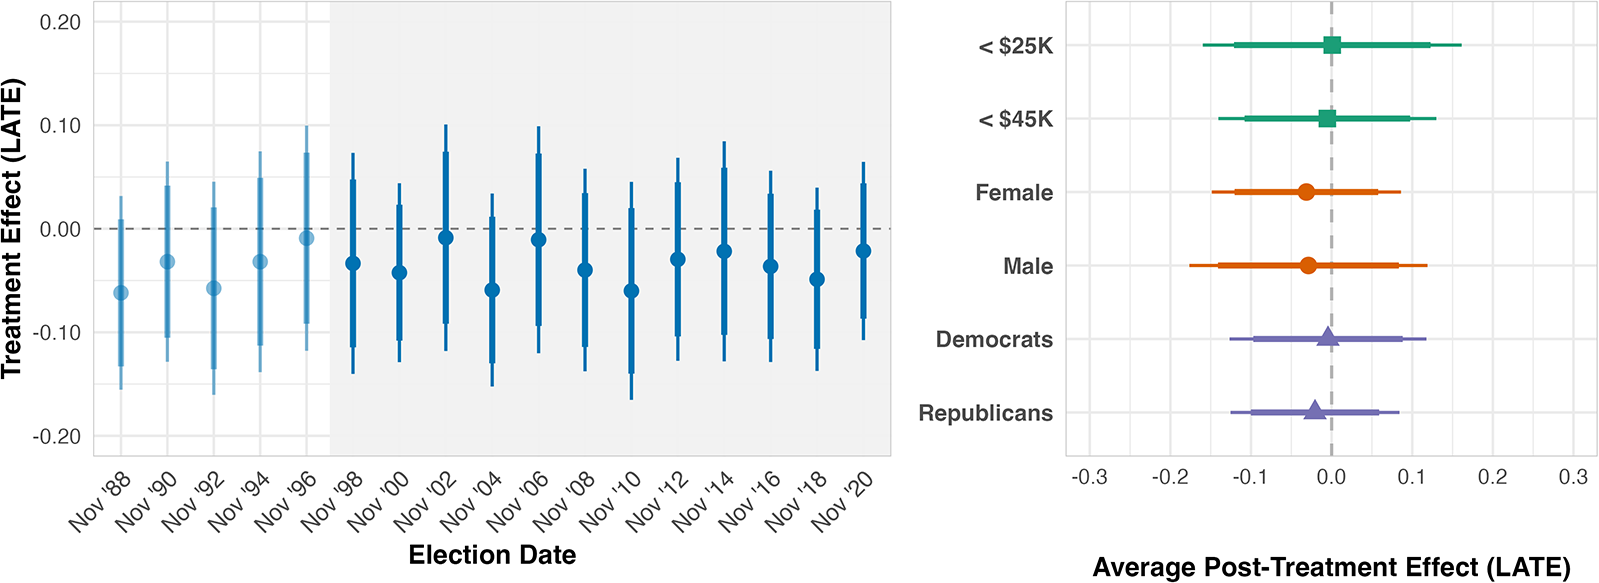
Figure 2 tests this more formally by plotting the RDD estimates ( $\lambda $) for each election. Estimates from the pre-reform period (unshaded area) serve as a placebo test. As expected, all point estimates before the reform are statistically indistinguishable from zero, confirming the absence of preexisting differential trends between the two groups.
This figure shows RDD estimates of pension benefit effect on turnout over time and across subgroups. The left panel plots the local average treatment effect ( $\lambda $) on voter turnout for each election, with the grey shaded area indicating the post-treatment period, for both occupations combined. The right panel plots the average post-treatment LATE across various subgroups. All estimates are derived from the RDD specification:
 ${Y_i} = \alpha + \lambda {D_i} + {\beta _1}\left( {{X_i} - c} \right) + {\beta _2}D\left( {{X_i} - c} \right) + {\delta _K}{K_i} + {\epsilon _i}$, where the outcome (
 ${Y_i}$) is a binary turnout indicator, and all models include covariates for gender, salary, and years of service. In both panels, the thick and thin error bars represent the 95% and 99% confidence intervals, respectively, based on robust standard errors. The results show a consistent null effect both over time and across all tested subgroups. All models use the optimal bandwidth selection method and robust standard errors (HC1) as proposed by Calonico et al. (Reference Calonico, Cattaneo and Titiunik2014).

Figure 2 Long description
Panel A shows a dot-and-whisker plot of treatment effects on voter turnout over time. The y-axis is labeled ′Treatment Effect (LATE)′ ranging from negative 0.3 to positive 0.3. The x-axis lists election dates from November 1998 to November 2022. Points represent local average treatment effects with error bars for 95 percent and 99 percent confidence intervals. Most effects cluster around zero, with no significant pre- or post-treatment differences. Panel B displays a dot-and-whisker plot of average post-treatment effects across subgroups. The x-axis is labeled ′Average Post-Treatment Effect (LATE)′ from negative 0.3 to positive 0.3. The y-axis lists subgroups: less than 25K, less than 50K, female, male, Democrats and Republicans. Points with error bars indicate confidence intervals, mostly crossing zero, showing no significant subgroup differences. No notable outliers are present.
For the post-treatment period, we can distinguish between potential short- and long-term effects. If the reform had an information effect, making retirees feel valued or increasing their trust in government, we would expect to see it immediately following the reform’s adoption. However, the estimate for the difference between treated and control public retirees in the first post-reform election in November 1998 is indistinguishable from zero. Similarly, if the benefit increase had a cumulative “resource” effect, gradually easing financial constraints of the retirees that benefited from the reform over time, we would see an effect emerge in later years. Yet, the estimates remain close to zero across all twelve subsequent elections, spanning more than two decades. In other words, the pension increase failed to mobilize the treated retired voters in both the short and long term. This null finding is robust to a large battery of statistical tests, including alternative standard errors (Supplementary Appendix A3.1), functional forms and higher-order local polynomial fits (Supplementary Appendix A3.2), control sets (Supplementary Appendix A3.3), bandwidth choices (Supplementary Appendix A3.4), stacked RD estimates pooling elections (Supplementary Appendix A3.6),Footnote 3 and jackknife leave-one-election-out (Supplementary Appendix A4.1).Footnote 4
Moreover, power calculations indicate that the stacked design is well powered to detect effects substantially smaller than those observed in prior studies of income-based mobilization (Supplementary Appendix A4.2). We also check whether sorting is an issue (Supplementary Appendix A4.3) and, where necessary, replicate our results with a donut hole approach (Supplementary Appendix A3.5). One possible concern is a ceiling effect due to high baseline turnout among public employees. However, this is unlikely to be the primary driver of our null result since the overall turnout in our sample (76.7%) was well below 100%. In addition, there is a clear and strong income gradient in voter turnout, even among retirees both in the general US population and in our sample (see Supplementary Appendix A0).
Next, we examine whether the average null effect conceals heterogeneity across subgroups. Although median income in the sample is relatively high, a substantial share of retirees falls into lower-income brackets. Policy feedback theory suggests that mobilization should be most likely among these lower-income individuals, who face greater financial constraints and thus benefit more from material gains. However, as the right panel of Figure 2 illustrates, we find no discernible effect even within this group (Supplementary Appendix A5.1), despite their lower baseline propensity to vote and steeper income–turnout gradients (Supplementary Appendix A0). The absence of an effect among those with the most to gain casts doubt on a straightforward resource-based account of policy feedback among elderly voters. Finally, we observe similarly small and statistically insignificant estimates across other subgroups, including those defined by partisanship (Supplementary Appendix A5.2) and gender (Supplementary Appendix A5.3).
4. Conclusion
Although there is a strong positive correlation between income and voting among elderly US voters, we provide the first causal evidence that a large, permanent increase in pension benefits did not affect the electoral participation of public-sector retirees. Our results contribute to the longstanding literature on the electoral politics of pension reforms (Pierson, Reference Pierson1994, Reference Pierson1996; Häusermann, Reference Häusermann2010; Starke, Reference Starke and Greve2021). Taken together, these findings suggest an important asymmetry: while losses may lead to a political backlash, gains do not necessarily mobilize beneficiaries. More broadly, our results are consistent with the idea that the mobilizing power of economic resources is limited when confronted with entrenched voting habits in older age. In this sense, policy feedback effects on political participation may be weaker or altogether absent among populations with more deeply ingrained behavioral patterns.
As we have sought to maximize internal validity, our research design focuses on policy changes affecting a specific group of voters, namely highly unionized public-sector employees, who have previously been shown to respond politically to minimum wage increases (Markovich and White, Reference Markovich and White2022). At the same time, this reform took place in a particular institutional and geographic context: the state of Illinois in the United States. Because defined-benefit pensions have declined sharply in the US private sector in favor of defined-contribution plans, external validity to other contemporary private-sector retirement arrangements is uncertain; our design is best read as a test of whether large, permanent late-life income gains can mobilize turnout in a hard-case setting. The extent to which these findings generalize to other countries remains an open question for future research. Moreover, while our study finds no effect on the decision to vote, we cannot rule out the possibility that the reform affected who retirees voted for or shaped other political attitudes such as political interest, policy preferences, or trust in government.
Beyond contributing to the policy feedback literature by examining a new policy domain (pensions) and a distinctive voter group (retirees), our findings highlight a potential scope condition for resource-based theories of participation: the powerful and persistent force of habit. In contexts where political participation is already highly routinized, even large and salient income gains may fail to translate into higher turnout. More broadly, our results suggest that the political consequences of economic gains may be more limited—and more context-dependent—than resource-based models of participation often imply.
Data availability statement
The code required to reproduce the analyses in this study is available in the Harvard Dataverse at https://doi.org/10.7910/DVN/LEJTLA (Ganslmeier et al., Reference Ganslmeier, Klymak and Vlandas2026). While the underlying datasets cannot be shared directly, detailed instructions on how to access them are provided in the replication materials. The Illinois voter database can be requested from the relevant authorities for a fee. The pension payment database is publicly accessible and can be downloaded from https://pensions.illinoisanswers.org/.
Declaration of interests
The authors declare none.
Ethics and consents
The research meets all ethical guidelines, including adherence to the legal requirements of the study country, and has received ethical approval.
Funding statement
The authors disclosed receipt of the following financial support: This work was supported by the Economic and Social Research Council (ES/P000649/1).
Supplementary material
The supplementary material for this article can be found at https://doi.org/10.1017/psrm.2026.10116. To obtain replication material for this article https://url.uk.m.mimecastprotect.com/s/OIT4C59nnH0Y5BngizfBfkcvT_?domain=doi.org.




 Open access

