
I. INTRODUCTION
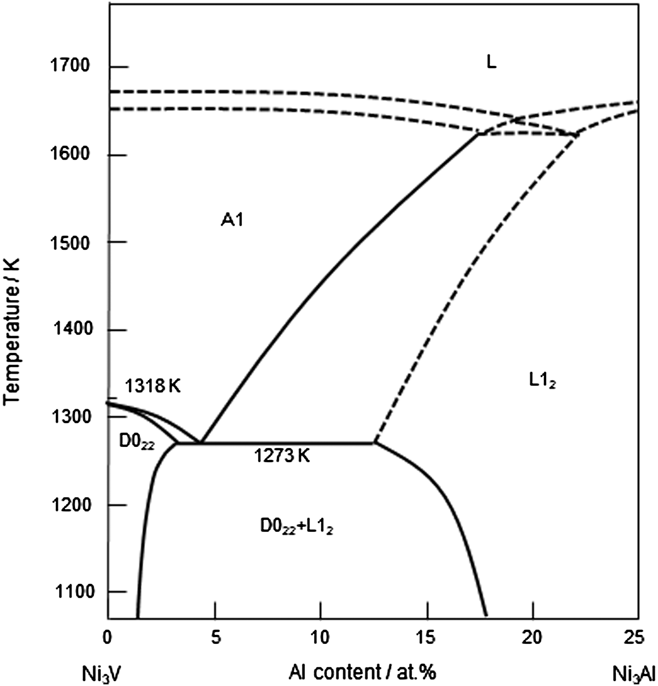
The present authors have recently developed a new type of two-phase intermetallic alloys composed of Ni3Al (L12: a = 0.3572 nm) and Ni3V (D022: a = 0.3542 nm and c/a = 2.036) phases. Reference Nunomura, Kaneno, Tsuda and Takasugi1–Reference Kawahara, Moronaga, Kaneno, Kakitsuji and Takasugi7 The microstructure is composed of Ni3Al and Ni solid solution (A1: fcc) phases at a high temperature, and the Ni solid solution phase is decomposed into a (Ni3Al + Ni3V) microstructure by a eutectoid reaction at a low temperature (∼1273 K) as shown in Fig. 1. Reference Hong, Mishima and Suzuki8,Reference Kobayashi, Sato, Hayashi, Konno, Kaneno and Takasugi9 The so called dual two-phase microstructure is thus comprised of whole intermetallic (ordered) phases with high structural coherency, leading to high microstructural stability at a high temperature. The dual two-phase intermetallic alloys have been found to exhibit excellent strength and hardness at high temperatures due to their fine, coherent, and stable microstructure and thereby are expected to be used for high-temperature structural and wear-resistant applications such as high-temperature dies, molds, and tools.
Longitudinal pseudo-binary phase diagram between Ni3V and Ni3Al. Reference Kobayashi, Sato, Hayashi, Konno, Kaneno and Takasugi9

For wear-resistant applications, coating processes such as thermal spraying and cladding by welding have been practically applied. Recently, laser cladding has been widely used as a surface modification processing because of many advantages over other conventional techniques such as thermal spraying and arc welding. Reference Li, Liu, Geng and Nie10–Reference Tosto, Pierdominici and Bianco15 Laser cladding has a high potential for coatings with low substrate dilution, minimal distortion, and strong metallurgical bonding with the substrate, leading to refurbishment or improvement of corrosion, wear, and other surface-related properties. Also, the laser cladding is convenient for alloying intermetallics with other elements, controlling the microstructure and thereby enhancing properties of the intermetallic alloys. However, there has been no report in which the Ni-base intermetallic alloy coating layer composed of the Ni3Al and Ni3V phases was fabricated by laser cladding although there are some reports in which the Ni3Al intermetallic compound and superalloy coating layers were synthesized by laser cladding. Reference Li, Liu, Geng and Nie10–Reference Tosto, Pierdominici and Bianco15
In this study, the two-phase Ni3Al and Ni3V intermetallic alloy coating layer was laser clad on the substrate of stainless steel 304, adopting appropriate laser cladding parameters for laser power and powder feed rate. An emphasis was placed on whether attractive two-phase microstructures and hardness are reserved in the coating layer fabricated by laser cladding. With this purpose, postannealing was conducted in the as-clad coating layer after laser irradiation. The microstructures of the coating layers were characterized by scanning electron microscopy (SEM), electron probe microanalyzer (EPMA), and transmission electron microscopy (TEM). Also, Vickers hardness in the coating layers was measured and correlated with the microstructures of the coating layers.
II. EXPERIMENTAL PROCEDURE
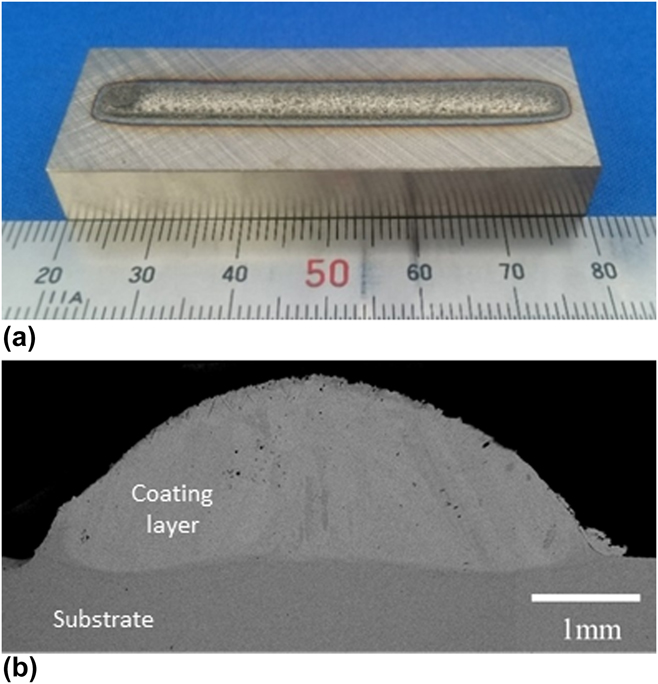
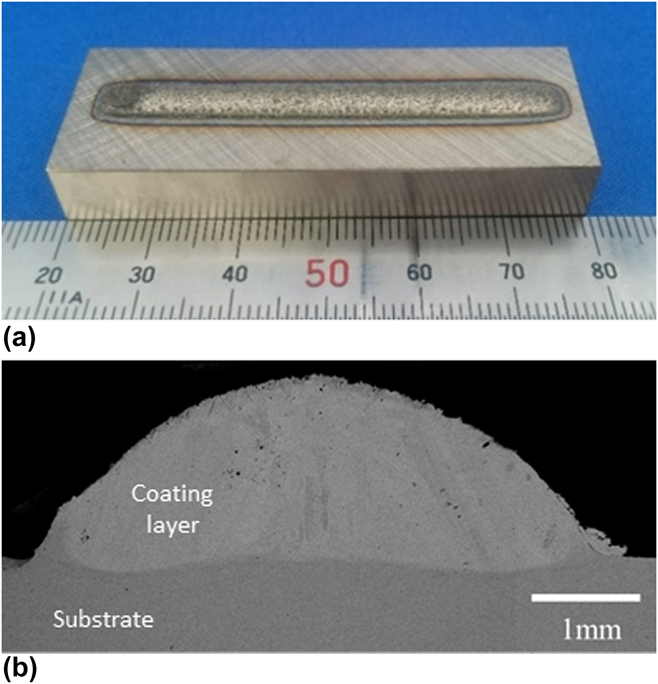
Gas atomized powder of Ni base two-base intermetallic alloy with a particle size of less than 125 µm was used as the feeding powder for laser cladding. The blocks of SUS304 stainless steel with a size of 60 × 20 × 10 mm were used as the substrate as shown in Fig. 2(a). The SUS304 is one of most widely used heat resistance alloys and is therefore suitable for the substrate material in our starting study. Before laser cladding, the substrate was washed with ethanol to obtain a clean surface. The nominal chemical compositions of the feeding powder of the Ni base two-phase intermetallic alloy and the substrate of SUS304 are listed in Table I. It has been observed by the present authors that the Ni base two-phase intermetallic alloy containing Nb exhibits not only a typical dual two-phase microstructure via stabilizing the eutectoid microstructure in the channel regions but also substantial solid solution hardening by Nb atoms dissolving in two constituent phases, Reference Kawahara, Kaneno, Kakitsuji and Takasugi6,Reference Kawahara, Moronaga, Kaneno, Kakitsuji and Takasugi7,Reference Moronaga, Kaneno, Tsuda and Takasugi16,Reference Edatsugi, Kaneno, Semboshi and Takasugi17 therefore being favorable to the coating material.
(a) An overview of the coating layer clad on the SUS304 substrate and (b) macrograph showing the cross section of the coating layer.
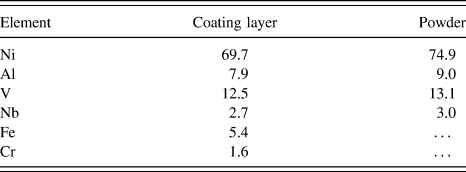
Nominal chemical compositions of the feeding powder and substrate.

a B is an extra number (wt%); the number is not included in the total 100 at.% (100 wt%) summing other elements.
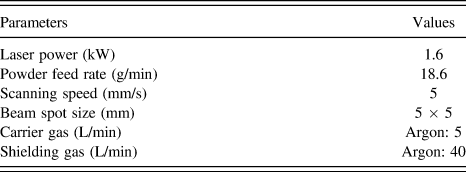
Laser cladding experiments were carried out on a Laserline LDM-2000-60 machine (Laserline, GmbH, Mulheim-Karlich, Germany) equipped with a continuous wave diode laser (a wave length of 940 nm) having a maximum power of 2 kW. A coating was fabricated by delivering the feeding powder with an argon carrier gas coaxially with a laser beam into the molten pool generated on the substrate. Also, the argon shielding gas was used to avoid oxidation during the laser cladding process. As shown in Fig. 2(a), the laser cladding on the substrate was carried out in the conditions of a single bead and a single layer on the substrate. In a previous study, Reference Okuno, Kaneno, Yamaguchi, Takasugi, Semboshi and Hagino18 the effects of laser power and powder feed rate on the microstructure and hardness of the present Ni base two-phase intermetallic coating have been investigated, fixing a scanning speed at 5 mm/s and a laser beam size with 5 × 5 mm. The laser processing parameters listed in Table II were adopted in this study, referring the previous study. Reference Okuno, Kaneno, Yamaguchi, Takasugi, Semboshi and Hagino18
Laser processing parameters.

The fabricated coating layer was cut into several disks with a thickness of approximately 1 mm, in perpendicular to the scanning direction of the laser beam. One of the cut coating layers was used as an as-clad coating layer. Others were annealed in vacuum at 1553 K for 5 h and at 1248 K for 24 h and subsequently furnace cooled at a rate of 10 K/min to room temperature, to investigate the effect of postannealing on the two-phase microstructure and hardness. The cut surfaces of the coatings were mechanically abraded on SiC paper and electrochemically polished in a mixture solution of 15 vol% H2SO4 + 85 vol% CH3OH at 263 K. The polished surfaces were available for SEM and EPMA observations as well as for Vickers hardness measurement. A microstructural observation was performed using a scanning electron microscope (FE-SEM: JSM-7001F operating at 15 kV [JEOL Ltd., Tokyo, Japan]). The profiles of the chemical compositions in the coating layers were analyzed by an electron probe micro analyzer (EPMA: JXA-8530F equipped with a wave dispersive spectroscopy [WDS] operating at 15 kV [JEOL Ltd., Tokyo, Japan]).
The TEM specimens with a diameter of 3 mm and a thickness of approximately 0.1 mm were cut from the coating layers. They were mechanically abraded and finally polished by low-angle ion milling using Gatan Model 691 with an argon ion beam accelerated at 4 kV. The TEM observation was performed using a JEM-2000FX microscope operating at 200 kV (JEOL Ltd., Tokyo, Japan), mostly with a beam incident from [001] of the Ni3Al or Ni3V phase.
Vickers hardness tester with a load of 0.1 kg was used to measure the micro-hardness at every 0.1 mm step along the direction from the coating top to the substrate.
III. RESULTS
A. Overview and macrograph
Figure 2(a) shows an overview of the coating layer clad on the SUS304 substrate. The surface of the coating layer is continuous and smooth with no cracks. Figure 2(b) shows the macrograph of the cross-section of the coating layer. The width and height of the coating layer is approximately 5 and 1.5 mm, respectively. It can be seen that the coating layer is composed of columnar grains with a size of several hundred μm (the detail will be shown in Fig. 4). Also, the coating layer appears to be well bound with the substrate. The penetration depth of the coating layer into the substrate is very small. The dilution ratio was estimated to be approximately 0.075.
B. Hardness and composition profiles in the coating layers
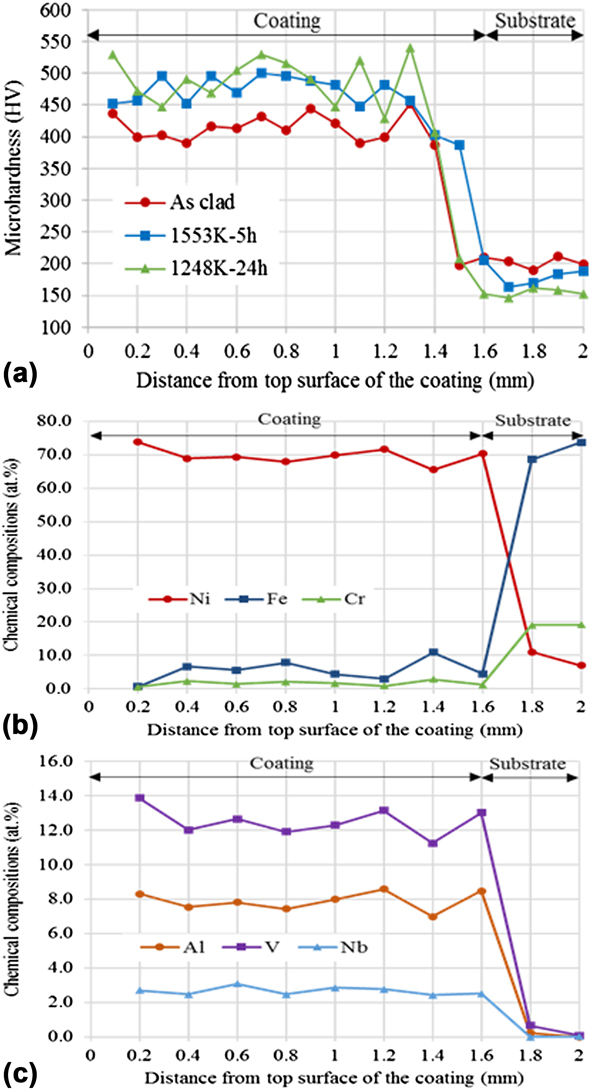
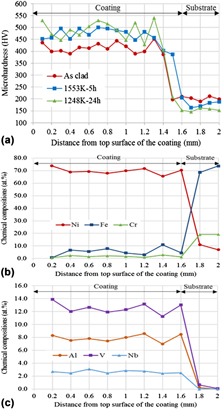
Figure 3(a) shows the hardness profiles as a function of distance from the top surface for the coating layers that were as-clad and annealed at 1553 K for 5 h and at 1248 K for 24 h. The hardness in the as-clad coating layer ranges between 390 and 450 HV. On the other hand, the annealed coating layers are harder than the as-clad coating layer, i.e., ranging between 450 and 500 HV (1553 K for 5 h) and between 430 and 540 HV (1248 K for 24 h). It is noted that the hardness of the as-clad coating layer was somewhat lower than that of the cast alloy but that of the annealed one was comparable to that of the cast alloy. Reference Kaneno, Soga, Tsuda and Takasugi19 Also, the scattering of the hardness values measured in the coating layer annealed at 1553 K for 5 h as well as in the as-clad coating layer was smaller than that of the coating layer annealed at 1248 K for 24 h. In all the coating layers, the hardness across the interface between the coating layer and substrate sharply changes in a narrow zone.
(a) Hardness profiles and (b, c) chemical composition profiles as a function of distance from the top surface of the coating layer.
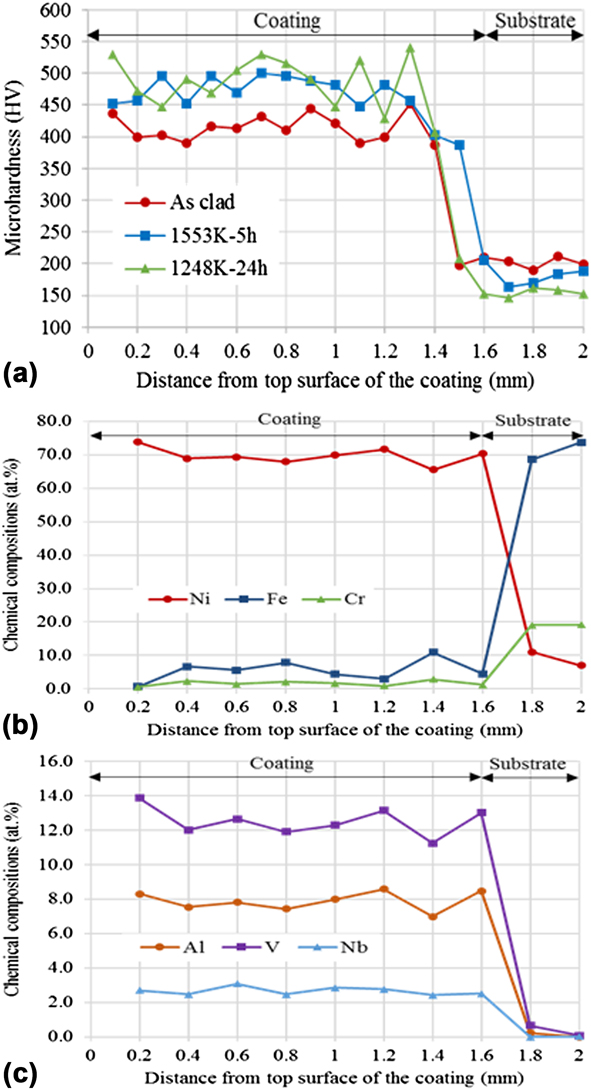
Figures 3(b) and 3(c) show the chemical composition profiles of Ni, Al, V, Nb, Fe, and Cr as a function of distance from the top surface of the as-clad coating layer. Ni, Al, V, and Nb are elements stemming from the cladding material (i.e., raw materials of the gas atomized powders) while Fe, Cr, and Ni are elements stemming from the substrate material. First, it has to be noted that the coating layer is somewhat diluted with Fe and Cr: the average contents of Fe and Cr in the coating layer were approximately 5.4 and 1.6 at.%, respectively. In the coating layer, the chemical compositions of all elements including Fe and Cr are kept almost constant. There is basically no compositional gradient for each element in the cladding layer. Such a feature reflects the fact that Fe as well as Cr are diluted from the substrate and homogeneously distributed by a substantial circulation in the molten pool. Also, the chemical compositions of all elements across the interface between the coating layer and substrate sharply change in a narrow zone as the hardness profile does because of the solid–liquid reaction. The diffusion distances of the elements from the molten pool into the substrate during the cladding process has to be very short in the solid phase (the substrate). Table III lists the average chemical composition for each element in the coating layer (within 1.6 mm from the top surface of the coating layer). The chemical compositions of the atomized powder are also listed for comparison. The content of each element Ni, Al, V, and Nb was slightly reduced due to the dilution with Fe and Cr although the compositional ratio among Ni, Al, V, and Nb contained in the coating layer is kept almost the same as that in the raw powder material, i.e., the Ni base two-phase intermetallic alloy.
Average chemical composition for each element in the coating layer (at.%).

C. Microstructural observation
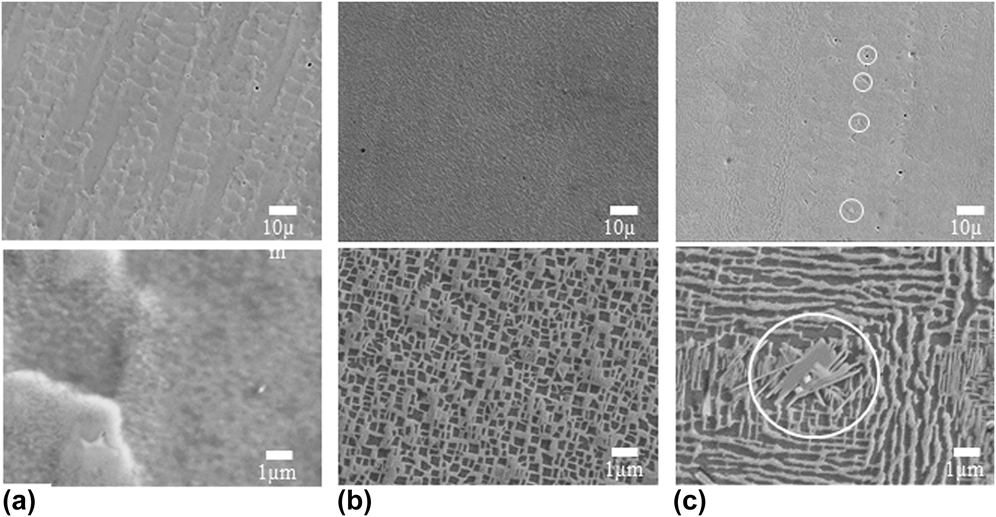
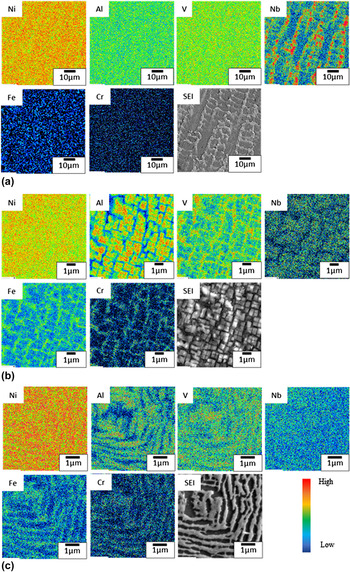
Figure 4 shows the SEM secondary electron images (SEM-SEIs) of the microstructures of the coating layers that were as-clad and annealed at 1553 K for 5 h and at 1248 K for 24 h. In the as-clad coating layer [Fig. 4(a)], the microstructure exhibits columnar dendrites growing along the solidification direction, with a dendrite spacing of a few ten μm. During the laser cladding process, the heat flow perpendicular to the substrate surface causes unidirectional columnar dendrites solidified from the molten pool on the substrate. The feature of the detailed and magnified microstructure corresponding to Fig. 4(a) will be described in the following TEM observation. Figure 5(a) shows elemental mapping in the as-clad coating layer. Nb is enriched in the dendritic region, but other elements appear to be distributed uniformly through the entire microstructure. In the as-clad coating layer, it is thus ambiguous whether a two-phase microstructure, i.e., eutectoid reaction into the Ni3Al and Ni3V phases takes place or not.
Microstructures of the coating layers that were (a) as-clad and annealed (b) at 1553 K for 5 h, and (c) at 1248 K for 24 h. The SEM images posted on the upper and lower rows were taken at low and high magnifications, respectively. Precipitates marked by a white circle in (c) are assumed to be Nb-rich precipitates.

Elemental mappings in the coating layers that were (a) as-clad, (b) annealed at 1553 K for 5 h, and (c) at 1248 K for 24 h.

In the coating layer annealed at 1553 K for 5 h [Fig. 4(b)], it was observed that the two-phase microstructure composed of primary Ni3Al precipitates and channel regions takes place as clearly shown in the image taken at a high magnification. The size of the primary Ni3Al precipitates varies between 200 and 500 nm. Also, the two-phase microstructure introduced by the laser cladding was finer than that of the two-phase intermetallic alloys containing Nb made by ingot metallurgy. Reference Kaneno, Soga, Tsuda and Takasugi19 It should be pointed out that the two-phase microstructure was formed even though Fe (5.4 at.%) and Cr (1.6 at.%) are contained in the coating layer (Table I). Any third-phase precipitates or dispersions other than the constituent phases (Ni3Al and Ni3V) were not observed in the SEM images taken at a low magnification. Figure 5(b) shows elemental mapping in the coating layer annealed at 1553 K for 5 h. It is evident that Al and Nb are enriched in the primary Ni3Al precipitates while V, Fe, and Cr are enriched in the channel regions, where the major constituent is the Ni3V phase.
It was found that the microstructure of the coating layer annealed at 1248 K for 24 h exhibits a peculiar lamellar-like microstructure accompanied by needle-like precipitates as shown in Fig. 4(c). The lamellar-like microstructures were observed in all the areas although the lamellar width or length varied from area to area. Figure 5(c) shows elemental mapping in the coating layer annealed at 1248 K for 24 h. Al-enriched and V-enriched regions are well separated. Therefore, it is supposed that the lamellar-like microstructure is composed of the Ni3Al and Ni3V phases formed by a eutectoid reaction, as predicted from the phase diagram shown in Fig. 1. Reference Hong, Mishima and Suzuki8,Reference Kobayashi, Sato, Hayashi, Konno, Kaneno and Takasugi9 Also, Fe and Cr are enriched in the V-rich phase whose alloying behavior is similar to that in the microstructure of the coating layer annealed at 1553 K for 5 h. It has to be noted that the precipitates were observed within the dendritic region, where Nb was highly enriched in the as-clad state as described earlier. Taking the present EPMA and XRD results (not shown in this text) into consideration, the precipitates are identified to be Ni3Nb (D0 a ). The previous study actually reports that Ni3Nb was precipitated in the microstructure of the Ni base two-phase intermetallic alloy containing 3 at.% Nb. Reference Soga, Kaneno and Takasugi21
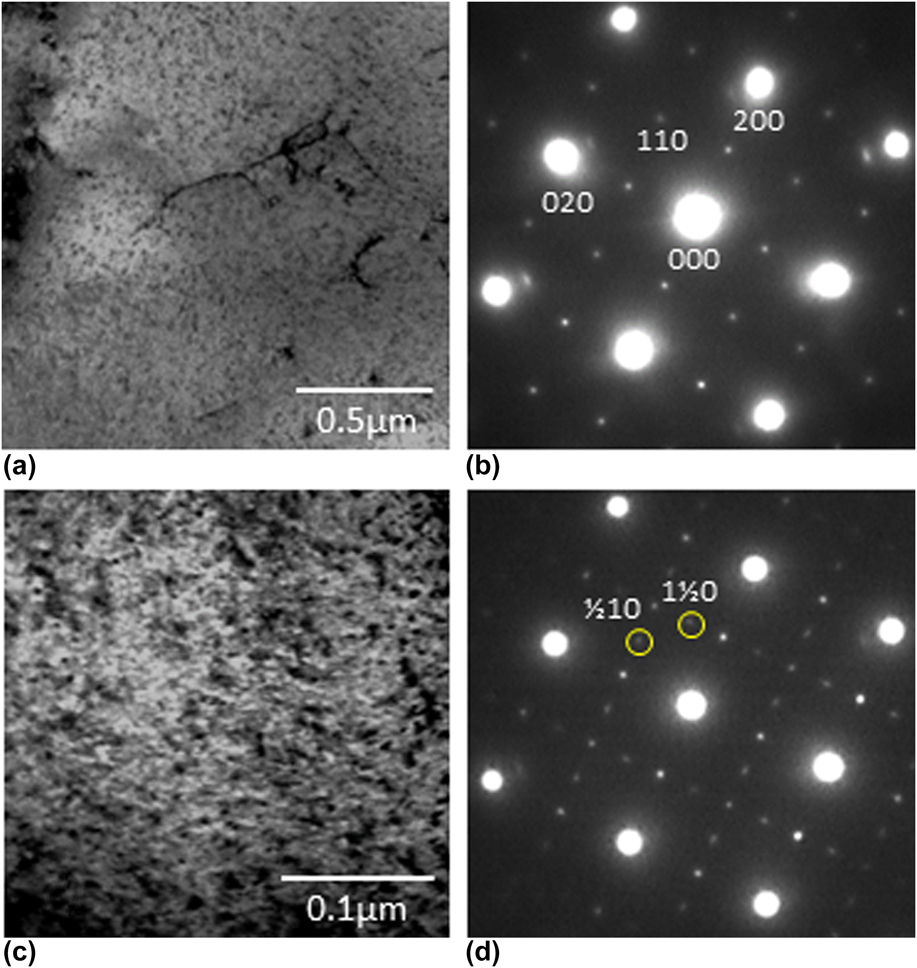
Figure 6 shows the TEM bright field (BF) images and corresponding selected area diffraction patterns (SADPs) of the microstructures of the as-clad coating layer. The observed microstructures were inhomogeneous and separated into two kinds of regions. One is the region where the microstructure is somewhat featureless and the corresponding SADP indicates that the Ni3Al phase is present, but the Ni3V phase is absent. However, it cannot be denied from this TEM observation that the Ni sold solution phase remains in the microstructure because a majority of the diffraction spots from the Ni solid solution phase may be superimposed on the diffraction spots form the Ni3Al phase. Other is the region that the microstructure exhibited distinctive contrast, and the corresponding SADP shows the Ni3V phase as well as the Ni3Al phase present. However, the two-phase microstructure composed of the cuboidal Ni3Al phase surrounded by the channel regions was not observed.
TEM (a, c) BF images and (b, d) (SADPs) of the microstructures of the as-clad coating layer. The images in the upper row (a, b) were taken from the region where the microstructure is featureless while those in the lower row (c, d) were taken from the region where the microstructure exhibits distinctive contrast. Two diffraction spots, 1/2 1 0 and 1 1/2 0 marked by a yellow circle indicate the presence of the D022 X and Y variant structures.
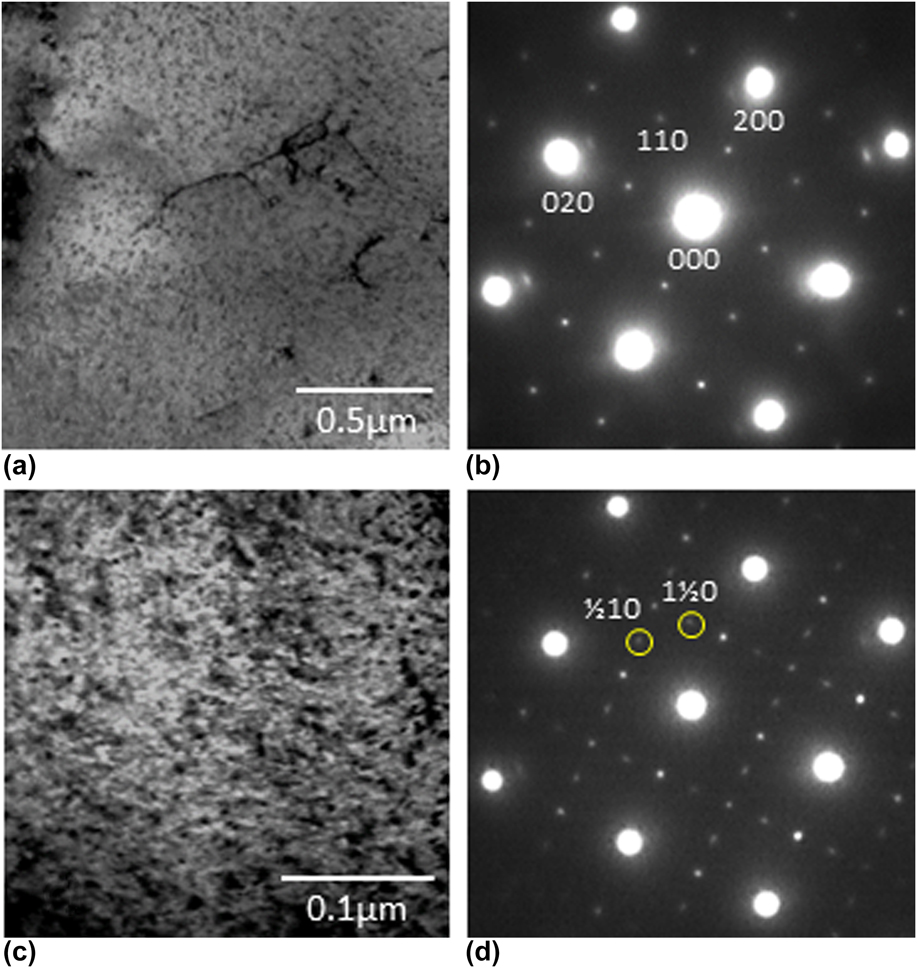
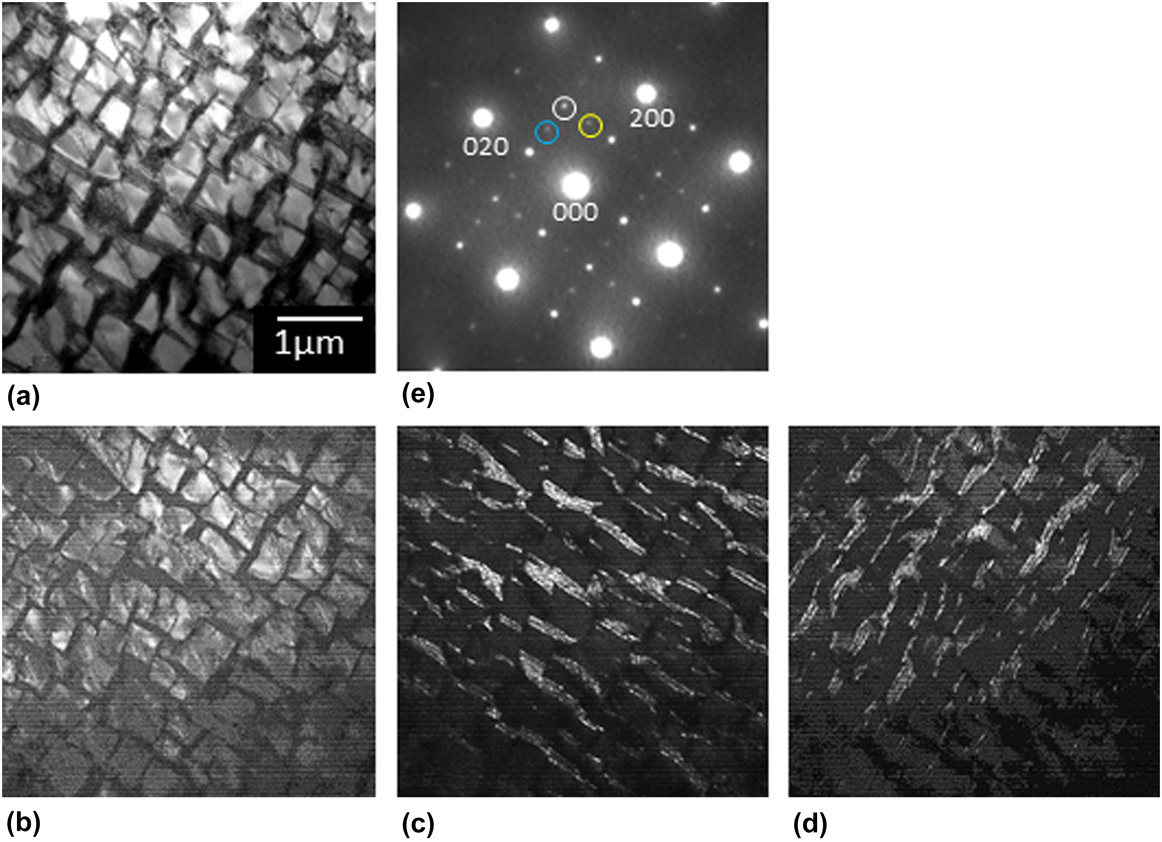
Figure 7 shows the TEM BF and dark field (DF) images and corresponding SADP of the microstructure of the coating layer annealed at 1553 K for 5 h. In this case, the microstructure exhibited a typical two-phase microstructure, as it has been observed in a number of two-phase intermetallic alloys made by ordinary ingot metallurgy such as arc melting and vacuum induction melting. Reference Nunomura, Kaneno, Tsuda and Takasugi1–Reference Kawahara, Moronaga, Kaneno, Kakitsuji and Takasugi7,Reference Moronaga, Kaneno, Tsuda and Takasugi16–Reference Soga, Kaneno and Takasugi21 It was identified from the observed SADP [Fig. 7(e)] and corresponding DF images [Figs. 7(b)–7(d)] that the Ni3Al and Ni3V phases are actually present. Having {100} cubic planes, the primary Ni3Al precipitates with a size of approximately 500 nm were aligned, the feature of which is similar to that observed in the most γ/γ′-type Ni-base superalloys. The Ni3V phase is present in the channel regions orthogonaly aligned along two 〈001〉 directions. Interestingly, the Ni3V phase composed of the D022 X variant structure is dominant in the channels along [100] while the Ni3V phase composed of the D022 Y variant structure is dominant in the channels along [010]. Reference Moronaga, Kaneno, Tsuda and Takasugi16 Thus, it is demonstrated that the eutectoid microstructure is well developed in the coating layer annealed at 1553 K for 5 h. Using the TEM foil specimen on which the BF, DF, and SADP observations were carried out, the EPMA analysis was conducted. Consequently, it was shown that approximately 6.5 at.% Fe and 2.1 at.% Cr are contained in the microstructural region shown in Fig. 7(a), in agreement with their content values shown in the composition profile measured in the coating layer [Figs. 3(b) and 3(c)].
TEM (a) BF and (b–d) DF images and (e) the SADP of the microstructure of the coating layer annealed at 1553 K for 5 h. Three DF images shown in (b), (c), and (d) were taken using three diffraction spots corresponding to L12, D022 X and Y variant structures marked by while, yellow and blue circles in (e), respectively.

Figure 8 shows the TEM BF and DF images and corresponding SADP of the microstructure of the coating layer annealed at 1248 K for 24 h. The lamellar-like microstructure composed of the Ni3Al and Ni3V phases was developed with a spacing less than 1 μm, in contrast to those observed in the coating layers that were as-clad and annealed at 1553 K for 5 h. The SADP indicates that there is a coherent orientation relationship between the Ni3Al and Ni3V phases as observed in the microstructure in the coating layer annealed at 1553 K for 5 h. Here, the diffraction spot corresponding to the X variant structure [marked by a yellow circle in Fig. 8(d)] was strong but that corresponding to the Y variant structure [marked by a blue circle in Fig. 8(d)] was very weak. This result indicates that all the Ni3V phases in the lamellae are composed of an almost same single kind of variant structure, i.e., X variant structure. The development of such a lamellar-like microstructure may be associated with annealing at a low temperature (1248 K) below the eutectoid temperature (∼1273 K).
TEM (a) BF and (b, c) DF images, and (d) the SADP of the microstructure of the coating layer annealed at 1248 K for 24 h. Two DF images shown in (b) and (c) were taken using two diffraction spots corresponding to L12 and D022 X variant structure marked by white and yellow circles in (d), respectively.

IV. DISCUSSION
In this study, it was shown that the microstructures in the coating layers were different from those in the two-phase intermetallic alloys made by ingot metallurgy. Reference Nunomura, Kaneno, Tsuda and Takasugi1–Reference Kawahara, Moronaga, Kaneno, Kakitsuji and Takasugi7 In the bulk ingot alloys that were melted using power sources such as induction or arc, cast and homogenized at high temperatures, followed by furnace cooling with and without annealing at temperatures below the eutectoid temperature, the dual two-phase microstructure, i.e., the eutectoid microstructure in the channel regions were substantially developed. Also, it has been observed that the developed dual two-phase microstructures were rather stable even tough exposing for longer time at temperatures below the eutectoid temperature. In the as-clad coating layer, the eutectoid microstructure was not fully developed, that is, the Ni solid solution is supposed to remain. The low hardness observed in the as-clad coating layer (390–450 HV) may be due to the incomplete eutectoid microstructure. There may be two reasons for such incomplete development of the eutectoid microstructure and low hardness: one is that the rapid cooling after laser irradiation prevented the complete development into the two intermetallic phases. Another is that Fe and Cr mingled in the coating layer affected the microstructure and reduced the hardness of the coating layer. In a previous study using cat alloy, it was shown that Cr is the element stabilizing the Ni solid solution phase, alternatively, destabilizing the two intermetallic phases, Ni3Al and Ni3V. Reference Kobayashi, Sato, Hayashi, Konno, Kaneno and Takasugi9 Alloying behavior similar to Cr had to take place in Fe stemming from the substrate: it was actually found in a latest study that Fe is more soluble in the Ni solid solution phase than in the two intermetallic phases although the microstructures relating to size and morphology of the cuboidal Ni3Al phase and volume fraction of the channel were not so much affected. Reference Kato, Okuno, Kaneno and Takasugi22 Thus, it is deduced that in the as-clad coating layer diluted with Fe and Cr, an imperfect eutectoid microstructure was induced in cooperation with rapid cooling after laser irradiation. The fact that lower hardness than the as-cast alloy was observed in the as-clad coating Reference Kaneno, Soga, Tsuda and Takasugi19 [see Fig. 3(a)] has to reflect the imperfect eutectoid microstructure.
In the coating layer annealed at 1553 K for 5 h, the microstructure accompanied with the primary cuboidal Ni3Al and the channel regions took place as it has been repeatedly observed in the two-phase intermetallic alloys made by ingot metallurgy. Reference Nunomura, Kaneno, Tsuda and Takasugi1–Reference Kawahara, Moronaga, Kaneno, Kakitsuji and Takasugi7 In this case, the inhomogeneous microstructure involving the incomplete eutectoid microstructure in the as-clad coating layer is solid-solutionized in the A1 phase region by annealing at 1553 K for 5 h and successively transformed during furnace cooling, according to the phase diagram shown in Fig. 1. Consequently, hardness higher (450–500 HV) than the as-clad coating layer was obtained in the coating layer annealed at 1553 K for 5 h. Here, the elemental mapping [Fig. 5(b)] shown on the two-phase microstructure of the coating layer annealed at 1553 K for 5 h is of great interest. The previous study Reference Kobayashi, Sato, Hayashi, Konno, Kaneno and Takasugi9 predicted that Nb is more soluble in the sequence, Ni3V > Ni3Al > Ni solid solution while Cr is more soluble in the sequence, Ni solid solution > Ni3V > Ni3Al. In the coating layer annealed at 1553 K for 5 h, Nb is supposed to be certainly enriched in the primary Ni3Al phase at a high temperature, where the Ni solid solution phase is equilibrated with the Ni3Al phase. However, Nb still remained in the Ni3Al phase at low a temperature, where the Ni3Al phase is equilibrated with the Ni3V phase, in disagreement with the prediction for the partition of Nb. It is suggested that achieving the equilibrium partition of Nb between the Ni3Al and Ni3V phases was prevented due to the low diffusivity of Nb and brief annealing time (5 h). On the other hand, Cr as well as Fe enriched in the Ni solid solution phase at a high temperature became involved in the Ni3V phase (composing the channel region) at a low temperature due to high diffusivity, in agreement with the prediction for the partition of Cr.
In the coating layer annealed at 1248 K for 24 h, the eutectoid reaction into the two intermetallic phases, Ni3Al and Ni3V, took place, but the resultant microstructure was quite different from that annealed at 1553 K for 5 h: the lamellar-like microstructure composed of the Ni3Al and Ni3V phases was observed. The formation of such a microstructure may be attributed to the annealing sequence by which the as-clad coating layer was directly annealed at low temperatures below the eutectoid temperature, skipping annealing at high temperatures. Thereby, the inhomogeneous microstructure formed in the as-clad coating layer changed to the lamellar-like microstructure by the eutectoid reaction without precipitating cuboidal Ni3Al, according to the phase diagram shown in Fig. 1. The result that the lamellar spacing between the two phases [Figs. 4(c) and 5(c)] was smaller than the spacing between the cuboidal Ni3Al precipitates [Figs. 4(b) and 5(b)] may be attributed to lower diffusivity of the constituent elements at 1248 K than at 1558 K. Also, it is suggested that the highest hardness (430–540 HV) in the coating layers observed in this study is due to the lamellar-like microstructure in which the Ni3Nb is precipitated. Also, it is likely that the large scattering of the hardness of the sample annealed at 1248 K is due to large fluctuation of the lamellar spacing, originally stemming from inhomogeneous elemental distribution introduced during laser cladding. The inhomogeneous elemental distribution is supposed to be not improved because of low annealing temperature. Last, the partition behavior of Cr and Fe between the Ni3Al and Ni3V phases [Fig. 5(c)] is consistent with the prediction: Cr and Fe are more soluble in the Ni3V phase than in the Ni3Al phase at low temperatures, where the Ni3Al phase is equilibrated with the Ni3V phase. Reference Kobayashi, Sato, Hayashi, Konno, Kaneno and Takasugi9,Reference Kato, Okuno, Kaneno and Takasugi22
V. CONCLUSIONS
The microstructure and hardness of the Ni base two-phase intermetallic alloy laser clad on the SUS304 were evaluated by Vickers hardness measurement, SEM, EPMA, and TEM observations, focusing on the effect of postannealing after laser irradiation. The following results were obtained from the present study:
-
(1) The fabricated laser clad coating layer has no cracks and porosities and was also well bound with the substrate. Also, the laser clad coating layer was diluted with approximately 1.6 at.% Cr and 5.4 at.% Fe stemming from the substrate. The compositional gradient from the substrate to the coating layer was sharp and confined to a narrow zone.
-
(2) In the as-clad coating layer, an inhomogeneous microstructure was observed, accompanying neither primary cuboidal Ni3Al precipitates nor the eutectoid microstructure consisting of Ni3Al and Ni3V phases in the channel region. The hardness in the as-clad coating layer was lower than that in the postannealed coating layers.
-
(3) In the coating layer annealed at 1553 K for 5 h, a dual two-phase microstructure composed of the primary cuboidal Ni3Al precipitates surrounded by the channel regions in which the major constituent is the Ni3V phase was observed. The hardness in the coating layer annealed at 1553 K was higher than that in the as-clad coating layer.
-
(4) In the coating layer annealed at 1248 K for 24 h, a lamellar-like eutectoid microstructure consisting of the Ni3Al and Ni3V phases was developed. The hardness in the coating layer annealed at 1248 K was the highest in the coating layers observed in this study.
ACKNOWLEDGMENT
This work was supported in part by JSPS KAKENHI Grant Number 26289263.