


Introduction
The Greenland ice sheet (GIS) may have been responsible for rapid sea-level rise during the last interglacial period (Reference Cuffey and MarshallCuffey and Marshall, 2000). Recent studies indicate that it is likely to make a faster contribution to future sea-level rise than previously believed (Reference Parizek and AlleyParizek and Alley, 2004; Reference Rignot and KanagaratnamRignot and Kanagaratnam, 2006). Some of its larger outlet glaciers have accelerated to as much as double their former speeds, and have thinned by tens of meters per year during the last 5–15 years (Reference ThomasThomas and others, 2000, Reference Thomas, Abdalati, Frederick, Krabill, Manizade and Steffen2003; Reference Joughin, Abdalati and FahnestockJoughin and others, 2004; Reference ThomasThomas, 2004). Recently, Reference Rignot and KanagaratnamRignot and Kanagaratnam (2006) documented major increases in ice discharge on many of the outlet glaciers draining the interior. These recent changes may, in part, reflect adjustment to recent warming trends, but these alone cannot explain ongoing rapid thinning, and most of the outlet glaciers appear to be undergoing ice-dynamical changes (Reference ThomasThomas and others, 2000, Reference Thomas, Abdalati, Frederick, Krabill, Manizade and Steffen2003; Reference Van der VeenVan der Veen, 2001; Reference ThomasThomas, 2004; Reference Rignot and KanagaratnamRignot and Kanagaratnam, 2006). The response of these outlet glaciers to climate change can occur much more rapidly than that of the interior ice, and can therefore contribute to short-term changes in sea level. Moreover, rapid thinning of peripheral outlet glaciers has been proposed by Reference HughesHughes (1986, Reference Hughes1998) as an initiator of increased discharge of interior ice, with potentially severe impacts on coastal communities through a rise in global sea level as more ice is discharged into the oceans. Consequently, it is important to investigate possible causes for ongoing rapid changes in order to understand how the GIS may respond to future climate change.
So far, few studies have investigated the significance of the recent rapid changes of Greenland outlet glaciers within the broader context of retreat since the Last Glacial Maximum (LGM) and, more significantly, retreat following the temporary glacier advance during the Little Ice Age (LIA) (Reference WeidickWeidick, 1968; Reference Ten BrinkTen Brink, 1975; Reference Forman, Marín, van der Veen, Tremper and CsathoForman and others, 2007). Moreover, long-term records of outlet glacier change are usually based on time series of calving-front positions (Reference WeidickWeidick, 1968, Reference Weidick1991, Reference Weidick1995). Such records can be misleading on tidal glaciers, whose floating terminus can either advance or retreat without any substantial changes farther up-glacier. For example, Reference Sohn, Jezek and van der VeenSohn and others (1998) inferred large seasonal variations in the position of the calving front of Jakobshavn Isbræ, postulated to be associated with surface ablation. A more comprehensive record that includes long-term time series of surface elevation, calving-front and ice-marginal position and ice-velocity changes is needed to assess the significance of recent changes and to provide input for modeling studies.
Jakobshavn Isbræ is the major drainage outlet on the west coast of Greenland, draining approximately 7% of the ice sheet. Reference Rignot and KanagaratnamRignot and Kanagaratnam (2006) report that the flux discharge increased from 24 km3 a−1 in 1996 to 46 km3 a−1 in 2005. Repeat airborne laser altimeter surveys along a 120 km long profile, conducted almost every year over the northern part of the glacier since 1991, indicate that thickening prevailed from 1991 to 1997, followed by more recent thinning, reaching several meters per year 20 km up-glacier from the terminus, and lower thinning rates farther inland (Reference Thomas, Abdalati, Frederick, Krabill, Manizade and SteffenThomas and others, 2003). On a longer timescale, the position of the calving front retreated ∼25 km up the fjord to 5 km seaward from the grounding line over the period 1850–1950 (Reference WeidickWeidick, 1995). Subsequently, the calving front remained stationary, with annual oscillations of ±2 km around the stable position (Reference Sohn, Jezek and van der VeenSohn and others, 1998). In recent years, however, the terminus position has retreated and is currently near the grounding line (Weidick and others, 2004; Reference JoughinJoughin, 2006). Clearly, these observations indicate major ongoing changes in this principal drainage route for inland ice.
The unresolved question is whether the ongoing thinning and retreat are unusual or, perhaps, a manifestation of longer-term behavior of the ice sheet, such as recovery from the general warming following the LIA maximum glacier extent and thickness. To address this question, a history of surface elevations is needed. While terminus positions may offer a general picture of glacier behavior, they cannot be used to accurately reconstruct the history of mass changes, since during much of its retreat the terminus was likely to have been floating and thus susceptible to small and short-lived climate perturbations. For the Jakobshavn region, the instrumental record dates back to aerial photography conducted by Kort- og Matrikelstyrelsen (KMS; Danish National Survey and Cadastre) in the 1940s. We use these photographs to reconstruct time series of surface-elevation changes between the 1940s and 1985. Glacier histories extending farther back in time must be based on glacial geomorphological information retrieved from formerly glaciated regions. With the objective of reconstructing the glacier history over the last two centuries, a field camp was established on the northern margin of Kangia Isfjord, close to the head of the fjord, on the eastern end of Nunatarsuaq (‘Great Nunatak’), just above the trimline (Fig. 1). This, Camp-2, was occupied for several days during July 2003, to establish a retreat sequence, to map fresh lateral moraines and to provide field-based validation for trimline mapping from multispectral satellite images (Reference Csatho, van der Veen and TremperCsatho and others, 2005; Reference Van der Veen and CsathoVan der Veen and Csatho, 2005).
(a) Orthophotograph of Jakobshavn Isbræ with geographic and glaciological features and transects. Photograph taken on 9 July 1985, provided by KMS, Denmark. (b) Location of Jakobshavn drainage basin on shaded-relief digital elevation model of Greenland. Coordinates in Universal Transverse Mercator projection system (Zone 22) are given outside the image.

The objective of this paper is to provide a longer-term record for the Jakobshavn drainage basin and to place recent changes in the broader context of retreat since the LIA. To this effect, we employ a suite of data and measurement techniques, as well as observations reported earlier in the literature, to derive the first quantitative history of elevation change of the lower part of Jakobshavn Isbræ. This record is compared with climate data from the nearby coastal station at Ilulissat airport to discuss possible causes for the observed intermittent thinning since the LIA.
Photogrammetric Measurements
To unravel the complex pattern of thinning that followed the LIA, surface elevations over a large part of Jakobshavn Isbræ should be precisely measured at regular time intervals. Surface elevations along a few trajectories have been repeatedly measured since the early 1990s by NASA’s Airborne Topographic Mapper (ATM) laser altimetry system (Reference Thomas, Krabill, Frederick and JezekThomas and others, 1995, Reference Thomas, Abdalati, Frederick, Krabill, Manizade and Steffen2003; Reference ThomasThomas, 2004). However, these measurements refer only to the last 15 years and they should be placed in a broader temporal context to assess their significance and evaluate the longer-term behavior. This section provides a summary of available data, comments on previous work and describes the data selected and the measurements performed for this study.
Available data and previous work
A wealth of geospatial information is available about the evolution of the terminus position, extent and ice motion of Jakobshavn Isbræ. Terrestrial photographs, paintings, verbal descriptions and books provide the earliest observations (e.g. Reference HammerHammer, 1883; Reference Koch and WegenerKoch and Wegener, 1930). Note that in this paper, a distinction is made between terminus position and ice-marginal extent, with the latter referring to the position of the land-based ice margin in the regions north and south of Kangia Isfjord (Jakobshavn Isfjord).
The first photogrammetric survey in the Jakobshavn region was conducted during the 1930s to create 1 : 250 000 scale topographic maps (Reference WeidickWeidick, 1968). Subsequent regional surveys covering Jakobshavn Isbræ include acquisition of Trimetrogon aerial photographs by the US Air Force during and immediately after World War II, and repeat surveys of the catchment basins of all major outlet glaciers between 68° and 72° N in 1957–58 and 1964 as part of the Expéditions Glaciologiques Internationales au Groenland (EGIG) (Reference BauerBauer, 1968; Reference Carbonnell and BauerCarbonnell and Bauer, 1968). Additional vertical aerial photographs were collected in the 1940s, 1953 and 1959 (Reference WeidickWeidick, 1968). Finally, a comprehensive coverage of the ice-free coastal areas of Greenland was obtained between 1978 and 1987. KMS performed a rigorous aerial triangulation with this photography, using control points established by GPS (global positioning system) measurements. Table 1 lists aerial photography collected at various times between 1940 and 1990. The table also contains relevant information about these diverse photographic missions. Most of the photography and related metadata, such as camera calibration protocols, are archived by KMS.
List and availability of aerial photographs collected over Jakobshavn Isbræ since the 1940s. Bold dates indicate aerial photographs used in this study. OAP: oblique aerial photograph; NL: not located yet; VAP: vertical aerial photograph; TAP: Trimetrogon aerial photograph; IGN: Institut Géographique National, France; Kucera: Kucera International Inc., Dayton, OH, USA

The primary purpose of these aerial surveys was to create and update maps. The photographs were also used to determine the fluctuation of the terminus position of Jakobshavn Isbræ, to map advance/retreat along the ice-sheet margin and to estimate thinning since the LIA by measuring elevation difference between the trimline and the ice-sheet boundary (Reference WeidickWeidick, 1968, Reference Weidick and Péwé1969, Reference Weidick1995). As part of the EGIG program, Reference BauerBauer (1968) and Reference Carbonnell and BauerCarbonnell and Bauer (1968) determined ice velocities along profiles across the fjord using repeat aerial surveys from 1958 and 1964. Finally, comprehensive studies of ice velocities and elevations were undertaken with repeat photography obtained in 1985–86 (Reference Fastook, Brecher and HughesFastook and others, 1995; Reference Johnson, Prescott and HughesJohnson and others, 2004).
All these previous studies were carried out using local reference systems that were not well documented, if at all. Moreover, most results are published in the form of hard-copy maps, and no digital datasets are available. Thus, it is very difficult to compare these results. Consequently their use for long-term change detection is unfortunately rather limited.
Selected aerial photographs and scanning
We obtained diapositives and metadata from five aerial surveys from KMS. Figure 2 shows the flight-lines and exposure centers and Table 2 contains relevant information. Although aerial photographs might have been acquired prior to the A44 mission, we have so far been unsuccessful in locating these older photographs. This logistic problem is not unique, as it is increasingly difficult to locate historical photographs and obtain the technical information necessary to render them useful for quantitative analysis and change detection, as knowledgeable people retire. Another oddity is the date of mission A44; no metadata are available nor is a date printed on the film (as is customary). Based on circumstantial evidence, we tentatively assigned a date of 1944, but this must still be verified.
Information about aerial photographs used in this study. GSD: ground sampling distance

Index map of aerial photogrammetry flights, shown on a Landsat Enhanced Thematic Mapper Plus (ETM+) satellite image acquired on 7 July 2001. Colors denote the year of data acquisition (green – 1944?; purple – 1953; magenta – 1959; orange – 1964; red – 1985), and circles mark the exposure centers of aerial photographs.

In order to apply some image processing and to make measurements on digital photogrammetric workstations (soft-copy workstations), we converted the diapositives to digital images with our RasterMaster photogrammetric precision scanner. We selected a suitable pixel size based on the film quality (mainly its resolution). It is important to adequately represent the inherent film resolution to allow identification of fine details on the digital images. This is crucial for orienting images of different epochs. Table 2 lists the pixel size and its associated ground sampling distance.
Orientation of historical photographs
For change detection it is an absolute prerequisite to establish a common three-dimensional (3-D) reference frame for all sensory input data, such as images obtained by different camera systems, profiles measured by laser altimetry or elevations obtained from local surveys. The major technical challenge in using historical photography for change detection is the orientation of images obtained from different missions. This entails the determination of the camera’s perspective center and its attitude during the time of exposure. The classic approach of using ground-control points (GCPs) poses a problem for a number of reasons. For instance, it is nearly impossible to obtain reliable information about GCPs used to orient historical photography because they are usually defined in poorly documented local reference systems. Although it is possible to determine GCPs now with GPS, the cost of field campaigns to remote areas is prohibitive. Therefore we have established the necessary control points photogrammetrically, briefly described below.
Of the five selected sets of aerial photographs, the 1985 mission is of particular interest because it is oriented to the World Geodatic System 1984 (WGS84) reference frame by way of aerial triangulation, using control points measured by GPS. The results, including the control points and exterior orientation data, are available from KMS. As NASA’s repeat laser altimetry missions are recorded in the same system, it makes sense to use WGS84 as the common reference frame.
To orient the older photographs (1944–64) used in this study, we proceed as follows. Identical point features in the 1985 and older photographs are manually identified and measured. With the available orientation data it is possible to determine the 3-D location of these measured points in the 1985 photography with respect to the WGS84 reference frame. This renders the necessary GCPs for orienting the older photography to the common reference system, performing a bundle block adjustment. The procedure is summarized below, and Table 3 contains the most relevant results.
Measure identical point features in 1985 and photography from earlier flight.
Compute 3-D position of measured points in 1985 photography in WGS84 system.
Perform aerial triangulation with the earlier flight, using points from previous step as GCPs.
Surface elevations in oriented earlier flight are now in WGS84 reference system.
Results from orienting historical photographs by bundle block adjustment
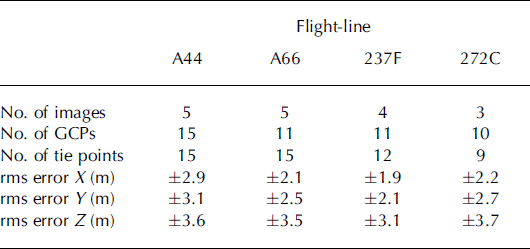
Using a block adjustment for orienting older photographs offers several advantages, among them the possibility of formally assessing the accuracy of the results. The variance component, σ 0, indicates the measurement accuracy. Under good circumstances one can expect an rms (root-meansquare) error of ±1 pixel, corresponding to 1–2 m. The actual errors are larger (see Table 3), which is not surprising, considering the rather poor image quality and unaccounted film distortions of historical photographs. The accuracy of points and the exterior orientation parameters are formally obtained from the variance–covariance matrix. Rather than listing all individual point errors we determined an average rms error. This is mainly influenced by the number and distribution of GCPs and their accuracy. The results in Table 3 confirm the success of our orientation method. The planimetric rms error of an arbitrary point is less than 3 m and just about 4 m for elevations.
Profile measurements
As outlined earlier, NASA has repeated laser altimetry missions along the profiles shown in Figure 1 since the early 1990s. Our goal was to determine ice elevations at the same locations on old photographs. We performed this operation manually on a soft-copy workstation, as briefly described here.
With the orientation data now established for historical photography, one can set up a stereo model on the soft-copy workstation. The models are absolutely oriented with respect to WGS84, the common reference frame for this project. Any 3-D point can be projected to the two images of the stereo model, mathematically emulating the image-formation process. The soft-copy workstation allows the cursor to be positioned in both images on the projected image points and automatically centers the displayed sub-images at these locations. If the projected 3-D point is on the visible surface of that stereo model then the operator perceives the cursor location in three-dimensions right on the surface.
We now employ this principle for measuring elevations along the ATM profiles. The ATM profile points are projected to the stereo model. Because the ice surface changed between ATM and aerial flights, the projected ATM points are not on the visible surface and the operator must find the ice surface by moving the measuring mark up and down at the projected location. For the operator to see stereoscopically, good image contrast must exist around these points. Since this is not always the case, the operator moves within the profile direction or slightly across until satisfactory conditions are found. Once the cursor is on the ice surface, the position is recorded. The operator then proceeds to the next profile point.
The elevation accuracy of the profiles can be derived theoretically by way of error propagation, taking into account measurement and interpretation errors, as well as orientation errors. This leads to an rms error in elevation of about ±3.8 m.
Ancillary Measurements
Trimline elevation
The highest ice-elevation stand reached during the LIA is readily observed in the field as a sharp boundary, called the trimline, separating vegetated terrain and rocks that were stripped bare of any vegetation during glacier advance. This trimline can be mapped using multispectral satellite images because exposed bedrock and freshly deposited sediments have distinctly different spectral-reflectance characteristics to surfaces covered with vegetation or lichens. Reference Csatho, van der Veen and TremperCsatho and others (2005) applied surface classification procedures to Landsat Enhanced Thematic Mapper Plus (ETM+) images to distinguish between the trimline zone and other surface classes (such as different snow facies, lichen and vegetation-covered surfaces, and open water). The authors identified 14 different surface classes based on their spectral signature. Figure 3 shows a simplified classification map indicating the major surface covers, which clearly distinguishes the recently exposed surfaces devoid of lichens and vegetation from surfaces that deglaciated earlier. The inland boundary of the region classified as ‘trimzone’ corresponds to the position of the LIA trimline.
Trimline zone around Jakobshavn Isbræ from supervised classification of multispectral Landsat ETM+ imagery acquired on 7 July 2001 (modified from Reference Csatho, van der Veen and TremperCsatho and others, 2005).

Although spatial changes in margin position can be determined accurately by classification of multispectral imagery, elevations are needed to assess the associated lowering of the ice surface and related ice-volume loss. We measured trimline elevations manually on a soft-copy workstation from 1985 aerial photographs. Fresh rock and moraine surfaces are usually brighter than lichen-covered older rock surfaces, and trimzones are therefore characterized by light tones on black-and-white aerial photographs or visible bands of satellite imagery (e.g. Fig. 4a). This brightness contrast, together with changes in image texture, forms the basis of the traditional measurement of trimline elevation using photo-interpretation. To aid the identification of trimlines, we projected the boundaries of the trimzone from the classification map, shown in Figure 3, onto the aerial photographs. This multisensor approach, using both the classification of multispectral satellite imagery and visual clues, such as image brightness and texture from black-andwhite stereo photographs, resulted in a robust and accurate 3-D mapping of the trimlines. Trimline elevation was measured along both sides of Kangia Isfjord. Figure 6 shows a segment along Nunatarsuaq.
(a) Aerial photograph acquired in 1964 showing transect starting at Camp-2, perpendicular to Jakobshavn Isbræ on the southern slope of Nunatarsuaq (for location see Fig. 1: EE’). Circles mark stations where geomorphologic features were mapped; numbered stations with bold circles are located on morainal ridges. (b) Photograph showing a morainal ridge at station 103. (c) Elevations along Camp-2 transect. All stations, up to 117, are numbered and bold numbers mark stations where lateral moraines are mapped. Elevations measured along the transect are also marked.

Lateral moraines
A closer inspection of the trimzone near Camp-2 on Nunatarsuaq revealed a succession of lateral moraines; a close-up of a morainal ridge is shown in Figure 4b. These lateral moraines are believed to have been formed during periods of interrupted thinning, and can thus be used to infer the history of intermittent surface lowering. To map these moraines, we measured surface elevations along a profile line (Fig. 4a, transect EE’). Figure 4c shows the resulting elevation profile. As discussed later in this section, these measurements produced accurate elevations of lateral moraines and other glacial geological features. However, assigning dates to these elevations proved to be a major challenge. Lichenometry was attempted, but the sparse lichen cover below the trimline prevented establishment of a statistically significant lichen-growth curve. Moreover, calibration of lichen growth could only be accomplished using surfaces of known exposure in the town of Ilulissat, ∼60 km west, at the mouth of the fjord where conditions for lichen growth are likely to be very different to those close to the ice margin. Therefore, dating of the lateral moraines, marked by bold numbers along the profile shown in Figure 4b is based on results from aerial photographs and other data presented here.
To accurately map elevations along the profile extending from the trimline to the ice surface, differential carrier-phase GPS data were collected along the profile on 22 July 2003, using Javad GPS receivers (on loan from the Center for Mapping at The Ohio State University). Static GPS stations were surveyed at stations 100, 103 and 104, and kinematic GPS surveys with an observation every 30 s were conducted along a trajectory connecting all numbered stations along the transect. A local GPS base station was running simultaneously at station 120, near the camp, for the entire duration of the transect survey. The GPS data were processed by GPSurvey (Trimble Inc.). First, the position of the base station was computed with respect to the International GNSS Service (IGS) station operating in Kellyville, near Kangerlussuaq airport, ∼250 km south of Jakobshavn Isbræ (GPS observations and precise position of Kellyville, as well as precise satellite orbits, from IGS). Next, the static and kinematic surveys were processed relative to the local base station. The estimated accuracy for the static survey is better than 5 cm, slightly worse for the kinematic survey.
Positions of stations 109 and 113–19 were determined using a Toshiba total station, comprising an electronic theodolite (10 arcsec accuracy) and an electronic distance-measurement unit (0.05 m accuracy). The instrument was set up at the base station (120) and at stations 109 and 116. From these three stations, the other sites were determined by measuring point vectors. The point accuracy of ±0.35 m was determined using error propagation from redundant observations in the triangle formed by stations 120, 109 and 116.
Terminus positions
To augment the record of terminus positions presented by Reference Sohn, Jezek and van der VeenSohn and others (1998), positions measured on new data (aerial photographs, Landsat ETM+ and Advanced Space-borne Thermal Emission and Reflection Radiometer (ASTER) satellite imagery) or inferred from more recent laser altimetry data have been added. A summary of these positions is given in Table 4.
Terminus positions of Jakobshavn Isbræ since 1946. Calving-front position is measured up-glacier, at the middle of the fjord, relative to western boundary of the Tissarissoq Ice Bay (Fig. 5). Bold numbers mark terminus positions determined in this study. D: day of the year, starting on 1 January; MD: modified day of the year, D + 365 for D < 100; CF: calving front position; AP: aerial photograph; TAP: Trimetrogon AP; DISP: declassified intelligence satellite photograph; ATM: Airborne Topographic Mapper; Landsat: Landsat ETM+; SAR: synthetic aperture radar. ATM measurements along profile AA′

Results
Terminus position
At the termination of the LGM, the ice margin retreated from an advanced position near the western end of Disko Island, ∼150 km west of the mainland coast at Ilulissat, to the mouth of Kangia Isfjord. A submarine moraine shoal, also called Isfjeldbanken (the iceberg bank), provided a temporary semi-stable terminus position (Fig. 5a; Reference WeidickWeidick, 1992; Reference Long and RobertsLong and Roberts, 2003). Retreat from the mouth of the fjord started 8000 BP at a rate of ∼20 m a−1 (Reference WeidickWeidick, 1992). During the Holocene climatic optimum, ∼4000–5000 BP, the calving front was at the current position at the head of the fjord, or perhaps even farther inland (Reference Weidick, Oerter, Reeh, Thomsen and ThoringWeidick and others, 1990, 2004; Reference WeidickWeidick, 1992). The timing of the termination of this retreat has been inferred from occurrences of marine shells in the neoglacial moraines surrounding Tissarissoq at the western side of the ‘Ice Bay’ (Fig. 5a), and from radiocarbon dating of a walrus tusk collected at ∼60 m above present-day sea level, yielding an age of 4290 ± 100 BP (Reference WeidickWeidick, 1992). According to Reference HammerHammer (1883) (referred to by Weidick and others, 2004), local legends suggest that this area used to be free of ice, serving as hunting grounds. This would imply that progress of the calving front to a more advanced position, ∼25 km west of Ilulissat, may have been as recent as during the LIA (AD 1500–1900) (Weidick and others, 2004).
Fluctuation of terminus position of Jakobshavn Isbræ. (a) Long-term retreat between 1850 and 2003 shown on a Landsat ETM+ image acquired 7 July 2001 (terminus positions from Reference GeorgiGeorgi (1959) and from this study). Hatched area shows calving front location between 1946 and fall 1998. Twenty-first-century positions are 2001 Su.: 7 July 2001 (green); 2002 Su.: 3 September 2002 (orange), 2003 Sp.: 23 March 2003 (cyan) and 2004 Su.: 27 June 2004 (blue). (b) Seasonal variation of terminus positions listed in Table 4, shown as function of the day of the year. Terminus position is relative to the western boundary of the Ice Bay. Red shows the best-fit curve to data points from 1946–98, green to points from 1999–2002 and blue to points after 2002.

The first to conduct scientific observations on Jakobshavn Isbræ was H. Rink, who traveled by sledge to the southern side of the calving front in April 1851 and visited the north side later that year (Reference RinkRink, 1857). According to his maps, the glacier terminus extended just beyond the western edge of Nunatarsuaq. Since then, the position of the terminus has been observed quite frequently, first through direct observations, then by aerial photography and, more recently, using satellite imagery. Figure 5a shows terminus positions since the LIA maximum advance.
Engell gave a review of the 19th-century observations (Reference EngellEngell, 1903), while Reference GeorgiGeorgi (1959) and Reference WeidickWeidick (1968) discussed observations in the first part of the 20th century. It should be noted here that Reference WeidickWeidick (1968) included the observation of Nordenskiöld (1870) who claimed to have observed a terminus position more advanced than that reported by Rink, which would imply a slight terminus advance over the period 1850–70. However, according to Reference EngellEngell (1903), the observations made by Nordenskiöld are of little value because he could not observe the glacier terminus and his writings do not contain sufficient information to allow for a reconstruction of the terminus position. For this reason, this position is not included in Figure 5a.
The terminus occupied a quasi-stable position between 1946 and 1998 that is believed to be related to a rise of the channel floor, as well as a pronounced bedrock protuberance, the ‘Ice Rumple’, in the Tissarissoq Ice Bay (Reference Clarke and EchelmeyerClarke and Echelmeyer, 1996). The topographic high, marked in Figure 1, rises from the bottom of the fjord to ∼400–550 m below sea level (Reference Echelmeyer, Clarke and HarrisonEchelmeyer and others, 1991) and acts as an important pinning point. As noted by Reference EngellEngell (1903) and Reference Sohn, Jezek and van der VeenSohn and others (1998), the position of the calving front fluctuates on a seasonal basis around the average position. Using all available terminus positions (summarized in Table 4), the seasonal variation in calving-front position can be investigated further by plotting it as a function of time (Fig. 5b). Note that the position is measured in the up-glacier direction from the western boundary of the Ice Bay, as marked in Figure 5a. The data shown in Figure 5b can be divided into three groups: those applying to the periods 1946–98, 1999–2002 and after 2002. This grouping reflects the general trend of a prolonged period of a more-or-less steady terminus during the second half of the 20th century (1946–98), the initial period of thinning of the floating terminus (1999–2002) and its retreat to the head of the fjord (2003–present). Starting in 1999, the magnitude of the summer retreat increased from ∼4 km (Fig. 5b, red curve) to 7 km (green curve). During the winter months the terminus still advanced to its quasi-stable position, however. The last winter advance of the quasi-stable period took place in March 2002, followed by a period of continuous break-up and recession of the calving front by an additional 10 km to the head of the fjord (Fig. 5a and b, blue curve). By May 2003, a major retreat had occurred and the glacier segment in the Tissarissoq Ice Bay had become isolated and had partially disintegrated; most of the floating part surveyed by Reference Echelmeyer, Clarke and HarrisonEchelmeyer and others (1991) has been replaced by a mix of icebergs and sea ice.
Seasonal variations in terminus position are similar to those reported by Reference Sohn, Jezek and van der VeenSohn and others (1998), with terminus retreat starting around the end of April, followed by advance starting in late summer/early fall. Assuming a constant ice velocity of 7 km a−1,the authors inferred that the calving rate during summer is almost six times that during winter. The assumption of constant ice velocity throughout the year was based on observations reported by Reference Echelmeyer and HarrisonEchelmeyer and Harrison (1990), but this may not be applicable to more recent times. Reference Zwally, Abdalati, Herring, Larson, Saba and SteffenZwally and others (2002) observed increased ice discharge following surface-melt events, which would suggest greater ice speeds during late spring and summer. Indeed, Reference Luckman and MurrayLuckman and Murray (2005) detected seasonal variations in surface velocity in 1995, and observations of Reference Truffer, Amundson, Fahnestock and MotykaTruffer and others (2006) revealed several speed-up events in 2006. If Jakobshavn Isbræ is now subject to seasonal variations in glacier speed, Figure 5b suggests that summer calving rates must be exceptionally large to cause terminus retreat in spite of maximum forward ice motion.
Surface elevation
We investigated the overall pattern of surface change since 1944 by comparing surface elevations derived from repeat aerial photogrammetry and from airborne laser scanning along the two longitudinal and two transverse profiles shown in Figure 1. These profiles follow trajectories of ATM laser scanning measurements, repeatedly flown by NASA since the early 1990s. Elevations have been measured along profile AA′ almost every year, but the other profiles were surveyed only two or three times between 1993 and 2004. To generate the profiles shown in Figures 6–9, first the average elevations within ∼70 m by 70 m sections of the ATM laser altimetry swaths are determined by fitting planar surface patches (‘platelets’). Then surface elevations are measured at the center of these platelets from stereo aerial photographs using the approach described above. To reduce random measurement errors and the effect of surface roughness, elevations are averaged within 200 m intervals along the profiles. Surface-elevation trends along transects AA′ and BB′ between 1944 and 1964 are estimated by fitting polynomial functions to the raw photogrammetric measurements (Figs 6b and 7). Temporal changes of surface elevations at selected locations (Fig. 1: NIS/CC′, NIS/DD′, NIS/Camp-2, SIS/Camp-2) are shown in Figure 10.
Surface-elevation changes between 1944 and 2003 from stereo aerial photography and ATM measurements along the north tributary of Jakobshavn Isbræ (transect AA′ in Fig. 1). (a) Solid curves are elevations measured by aerial photogrammetry, represented by fitted polynomials (1944–64) or averaged within 200 m sections (1985). Dashed curves are smoothed elevations derived from ATM laser scanning data. Gray line marks average elevation in 1984–86 from Reference Echelmeyer, Clarke and HarrisonEchelmeyer and others (1991). (b) Surface elevations measured by aerial photogrammetry and fitted polynomials.

Surface-elevation changes between 1944 and 2003 from stereo aerial photography and ATM measurements along the south, main, tributary of Jakobshavn Isbræ (transect BB’ in Fig. 1). Solid curves are elevations measured by aerial photogrammetry, represented by fitted polynomials (1944–64) or averaged within 200 m sections (1985). Dashed curves are smoothed elevations derived from ATM laser scanning data. Gray line marks average elevation in 1984–86 from Reference Echelmeyer, Clarke and HarrisonEchelmeyer and others (1991). ‘Bumps’ in 2003 profile are icebergs.


Surface-elevation changes between 1985 and 2003 from stereo aerial photography and ATM measurements across the glacier near the grounding line of Jakobshavn Isbræ (transect DD′ in Fig. 1). ATM measurements were performed on different dates along CC′ and DD′.

Time series of surface-elevation changes between 1944 and 2003 from stereo aerial photography and ATM measurements at selected locations marked in Figure 1. (a) North tributary at Camp-2 (solid curve, NIS/Camp-2) and south tributary at Camp-2 (dashed curve, SIS/Camp-2). Average elevations of tributaries in 1984–86 from Reference Echelmeyer, Clarke and HarrisonEchelmeyer and others (1991) are also shown as red diamond and blue square. Elevation minimum in 1999 indicates retreat of calving front upstream of Camp-2, followed by a readvance in 2001. (b) Middle of the north tributary near the calving front (NIS/CC′) and near the head of the fjord (NIS/DD′).

Table 5 summarizes ice surface-elevation changes and thickening/thinning rates derived from observations along the Camp-2 traverse on the north fjord wall (Fig. 1: EE′; Fig. 4) and from repeat aerial photography and laser altimetry over the northern tributary of Jakobshavn Isbræ (Fig. 1: NIS/Camp-2; Fig. 10). These data are inferred from lichenometry (1880–1902), field observations (1902–33; Reference Weidick and PéwéWeidick, 1969), aerial photogrammetry (1944–85) and airborne laser scanning (ATM) measurements (1993–2003; Reference Thomas, Abdalati, Frederick, Krabill, Manizade and SteffenThomas and others, 2003). Thickness changes (δH) are derived assuming hydrostatic equilibrium:

where ρ ice = 0.9 Mg m−3 is ice density and ρ sw =1.02 Mg m−3 is sea-water density.
Time series of ice surface-elevation changes and thickening/thinning rates derived from observations along the Camp-2 traverse on the north fjord wall (Fig. 1: EE′; Fig. 4) and from repeat aerial photography and laser altimetry over the north ice stream of Jakobshavn Isbræ (Fig. 1: NIS/Camp-2; Fig. 10). Thickening/thinning rates of the floating tongue (after the late 1940s) are derived from surface-elevation changes by assuming hydrostatic equilibrium, ρ ice = 0.9 Mg m−3 and ρ sw = 1.02 Mg m−3. EDTGS: elevation difference between trimline and glacier surface; RMSE elevation: standard deviation of surface elevation within 200 m sections. RMSE of thickness changes (dh/dt) is derived by error propagation; errors are assumed only in surface elevations (rms errors of elevations)

We use these data, complemented by the transect of lateral moraines shown in Figure 4b, to construct a quantitative history of elevation and thickness change since the LIA and to identify distinct periods of glacier behavior. All elevation data (GPS, laser altimetry and photogrammetry) are referenced to the WGS84. This elevation is ∼26 m higher in the Jakobshavn area than elevations relative to sea level.
LIA–1902
At the camp site near the grounding line, the trimline is at 300 m elevation. While the precise date of maximum LIA extent is not well constrained for this region of Greenland, it is generally assumed to be between AD 1850 and 1880 (Reference Weidick, Oerter, Reeh, Thomsen and ThoringWeidick and others, 1990), although Weidick and others (2004) suggest the LIA lasted until AD 1900.
The surface below the LIA trimline is mostly devoid of lichens, except for a narrow zone (up to 15 m high) immediately below the trimline, in which the rocks are partially covered, mostly with young black epilithic lichen, including Pseudophebe minuscula and P. pubescens. Below this zone, lichens are sparser, larger colonies are rare and rocks and exposed bedrock lack the typical dark appearance characteristic of lichen-covered rocks. If retreat and thinning had occurred gradually since the LIA, one would expect a steady increase in lichen density towards higher elevations. The fact that lichens are scarce below the LIA trimline may indicate that these surfaces were ice-covered fairly recently.
There is corroborating evidence for a high glacier stand following the LIA. According to Reference WeidickWeidick (1968, p.40), ‘the readvances of 1890 can be seen to have given glaciers generally an extent near to their historical maximum’. This statement does not apply to the position of the calving terminus of Jakobshavn Isbræ (which retreated steadily from 1850 onward), but rather to positions of surrounding margins terminating on land. Of particular relevance is the observation made by Engell during his visit to the glacier in 1902: ‘the retreat, which has been historically documented, manifests itself also through a lower surface elevation. Both at the camp site, as well as on the Nunatak, the surface has lowered 6–7 m. Over this elevation, the rock walls are white-grey, and lichen are absent. At higher elevations the rocks are covered with lichen and therefore dark in appearance. The boundary between these surfaces is very sharp’ (Reference EngellEngell, 1903, p.122). This suggests that in 1902 the ice surface was near its LIA maximum and that the narrow band of lichen-free rock described by Engell indicates glacier thinning over the period 1850–1902. This band has since become covered with lichens but still lacks other vegetation and probably corresponds to the narrow zone immediately below the trimline observed at our camp site. Rocks at lower elevations with noticeably fewer lichens were deglaciated more recently, that is, after 1902.
1902–44
Comparison of ice surface elevations derived from the 1944 aerial photographs with trimline elevations shows large surface lowering, increasing towards the ice sheet (Fig. 6). While trimline elevations indicate that the glacier surface was relatively steep during the LIA (gradient ≈ 0.025), by 1944 the gradient decreased to 0.006. However, the 1944 surface profile is still convex, suggesting the terminus and calving front remained grounded. At the location of the Camp-2 transect the glacier surface was at 109.6 m elevation in 1944 (Table 5). Thus, averaged over the period 1902–44, surface lowering from the estimated 1902 ice surface elevation of 287.7 m amounted to 4.25 m a−1. As it appears that the terminal region was grounded during this entire period, this surface lowering may be equated with actual glacier thinning.
According to Weidick’s compilation of surface changes (Reference Weidick and PéwéWeidick, 1969), the surface-lowering rate was not uniform between 1902 and 1944. While the ice surface was near its LIA maximum in 1902, by the time Koch visited the glacier in 1913 the trimzone had increased in width to 60–90 m at the calving front (Reference Koch and WegenerKoch and Wegener, 1930). The surface lowering slowed between 1913 and 1933, and the glacier was still only 120 m below the trimline when the area was surveyed during a topographic mapping mission in 1931–33 (Reference Weidick and PéwéWeidick, 1969). We mapped several lateral moraines between the estimated 1913 and 1933 glacier surface elevations. These lateral moraines at stations 108, 110 and 114 (at elevations 187, 200 and 219.8 m, respectively; Fig. 4b) indicate that surface lowering was intermittent, and halts in the retreat of Jakobshavn Isbræ signaled cold periods and slower thinning. Intermittent thinning with halts during this period has been suggested by Weidick, based on observations of lichen colonies and moraines near the lake Nunatap Tasia on Tissarassoq (Reference Weidick and PéwéWeidick, 1969).
1944–53
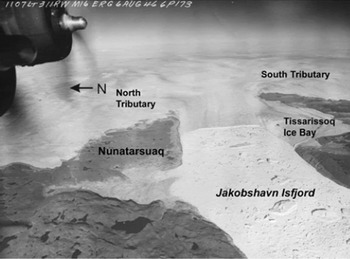
As noted above, the convex surface profile suggests Jakobshavn Isbræ remained grounded in 1944. However, an oblique aerial photograph acquired by the US Air Force shows that by 6 August 1946 the terminus had retreated to the middle of the Tissarissoq Ice Bay (Fig. 11). This position, located near the Ice Rumple that served as a pinning point stabilizing the calving front until 1998, indicates that the terminus may have become afloat by 1946. By 1953, the elevation profiles along the lower reach of the glacier were near horizontal, with very small surface slope, characteristic of floating ice tongues (Figs 6 and 7). Over this period, the average rate of surface lowering at the Camp-2 transect was ∼1.6 m a−1. As it appears that the terminus became ungrounded at some time during this interval, the actual rate of thinning is likely to have been greater than this (up to 18 m a−1 if the terminus was floating over the entire interval). We assume the glacier started to float in 1948, to obtain an estimated 7.5 m a−1 thinning rate (Table 5).
Trimetrogon aerial photograph of Jakobshavn Isbræ, acquired by the US Air Force on 6 August 1946 (courtesy of KMS).
1953–59
Between 1953 and 1959 the surface lowering continued at an average rate of 1.2 m a−1, corresponding to a thinning rate of 10.3 m a−1, over the northern tributary (Table 5), while surface lowering of the southern tributary was more modest (Fig. 10). By 1959 the average surface elevation of the northern tributary along transect AA′ was ∼88 m (Fig. 6). The southern tributary was higher, with an average elevation of ∼110 m, measured along BB′ (Fig. 7).
1959–85
Surface lowering continued at a low rate, 0.2 m a−1, corresponding to 1.7 m a−1 thinning, at the Camp-2 traverse between 1959 and 1985 (Table 5). By 1985 the glacier surface had become more undulating. Reference Echelmeyer, Clarke and HarrisonEchelmeyer and others (1991) attributed the uneven structure to strong interaction between the slower-moving, thin northern tributary and the faster, thicker southern tributary. The two tributaries were separated by a suture, made of large seracs (Reference Echelmeyer, Clarke and HarrisonEchelmeyer and others, 1991). This feature, named ‘Zipper’ by T. Hughes because of its similarity in appearance and function to a zipper, was first described by Reference Echelmeyer, Clarke and HarrisonEchelmeyer and others (1991). The Zipper was defined by a sharp step of ∼25 m elevation at the middle of the glacier in 1985 (red curve in Fig. 8). Comparison of the elevation profiles across the glacier in Figure 8 suggests that this step was not a permanent feature, but was the result of a pronounced lowering of the northern tributary between 1944 and 1985. For example, Figure 10 shows that below Camp-2 the northern tributary was ∼20 m lower than the southern tributary between 1950 and 1990.
Reference Echelmeyer, Clarke and HarrisonEchelmeyer and others (1991) estimated that the average elevation of the northern tributary, measured on the raised bench just north of Zipper, was 54–56 m a.s.l. in 1984–86. This elevation, corresponding to 80–82 m in the WGS84 reference system used in this study, is in excellent agreement with the mean elevation measured from the 1985 photographs over the floating tongue (Figs 6 and 10). Similar good agreement was found over the southern tributary, where Reference Echelmeyer, Clarke and HarrisonEchelmeyer and others (1991) estimated 80 m elevation, corresponding to 106 m on WGS84 (Figs 7 and 10).
1985–94
During 1985–94 the thinning trend that had continued since the LIA maximum glacier extent reversed, and the glacier started to thicken. Thickening was first detected by repeat laser altimetry measurements between 1991 and 1997 (Reference Thomas, Krabill, Frederick and JezekThomas and others, 1995, Reference Thomas, Abdalati, Frederick, Krabill, Manizade and Steffen2003). Our results indicate that thickening started earlier, probably in the mid-1980s. The average thickening rate between 1985 and 1994, which we derived from aerial photogrammetry and ATM measurements, was ∼16 m a−1 below Camp-2 (Table 5; Fig. 6) and reached 25 m a−1 at the calving front (Fig. 8). Only slight thickening has been detected over the southern tributary, however (Fig. 7). Time series of surface elevations at different locations indicate that the surface-elevation change followed a similar trend in different parts of the glacier, but changes over the northern tributary were more pronounced (Fig. 10).
1994–97
By 1997 the surface of Jakobshavn Isbræ reached the 1953 level (Figs 6 and 10). Due to the rapid thickening of the northern tributary between 1985 and 1994 (Fig. 10), the elevation differences between the northern and southern tributaries were greatly reduced near the calving front (Fig. 8), and were negligible at the DD′ transect near the grounding line (Fig. 9).
1997–present
While some thinning was detected in 1997, rapid thinning started only in 1999. By 2001, thinning predominated over the whole Jakobshavn drainage basin (Reference Thomas, Abdalati, Frederick, Krabill, Manizade and SteffenThomas and others, 2003). Reference ThomasThomas (2004) provides an excellent summary of observed changes and their interpretation.
Ice-margin extent
After reaching its LIA maximum extent, the ice-sheet margin started to retreat in 1850. The retreat was interrupted by halts and readvance as described by Reference Weidick, Oerter, Reeh, Thomsen and ThoringWeidick and others (1990). The retreat around Kangia Isfjord (Jakobshavn Isfjord) was asymmetric, starting with a rapid retreat in the region where the southern tributary enters the fjord. The easternmost nunataks south of the fjord, represented as a wide trimline zone in Figure 3, were already exposed at the beginning of the 20th century (Reference EngellEngell, 1904). However, north of Jakobshavn Isbræ, the ice margin remained close to its LIA maximum until 1946 (Fig. 12). Comparison of ice-sheet margin positions measured from 1944, 1953, 1959, 1964 and 1985 aerial photographs and 2001 Landsat ETM+ satellite imagery, shows that rapid retreat of the ice margin here started as recently as the 1940s and continued until the 1980s (Fig. 12). This marginal retreat, also noticed by Reference Sohn, Jezek and van der VeenSohn and others (1998), is in contrast with the readvance of the ice-sheet margin, observed in most regions of West Greenland after the 1950s (Reference WeidickWeidick, 1991).
Retreat of ice-sheet margin from the LIA around Nunatarsuaq, north of Kangia Isfjord. Ice-sheet boundaries, measured from aerial photographs, are shown on Landsat ETM+ satellite imagery acquired on 7 July 2001.

Discussion
It is well established that the margin of the ice sheet in the Jakobshavn region has fluctuated since the LIA. Based on historical evidence, Weidick concludes that the retreat of the glaciers was interrupted by an advance or halt around 1890 and again in the early 1920s (Reference WeidickWeidick, 1968, 1969, Reference Weidick1984). Our results indicate that Jakobshavn Isbræ partook in the complex regional pattern of thickening and thinning. At the end of the LIA, the glacier thinned and retreated, followed by an advance during which the surface reached almost to the LIA trimline. Since then, the glacier has thinned, albeit interrupted by periods of standstill and possibly slight readvance during which moraines were deposited at the glacier margin.
Several periods of distinctly different behavior of the lower reach of Jakobshavn Isbræ can be identified since the post-LIA maximum stand in 1902. Initially, during the first half of the 20th century, thinning rates were modest. Higher thinning rates, reaching 5–11 m a−1, detected during the periods 1902–13 and 1930–59 are probably associated with regional warming trends. Between 1910 and 1930, average winter and spring temperatures increased rapidly (0.5°C a−1; Fig. 13). Although the precise timing of onset of thinning is somewhat ambiguous, it seems reasonable to attribute the early period of terminal thinning of Jakobshavn Isbræ to local warming.
Seasonal-average temperatures at Ilulissat airport.

Continued thinning caused the calving front to become ungrounded sometime in the late 1940s. The associated release of resistance to flow may have resulted in enhanced creep rates and thinning of the adjacent grounded portion of the glacier lasting until the mid-1980s, although at a progressively decreasing rate. Between 1953 and 1997 the north and south tributaries and the land-based ice sheet around them exhibited markedly different behavior. Thinning of the north tributary continued until 1985 (e.g. Fig. 6) during a period when the calving front was stationary, with only minor annual fluctuations. Over the south tributary, thinning subsided in the 1960s. North of the fjord, aerial photographs and satellite imagery indicated continuous retreat of the ice margin until the present, while in the south the initial retreat was followed by a readvance in the 1960s.
Repeat airborne laser-altimetry surveys indicate that for the brief period 1993–97 the glacier thickened by several meters (Reference Thomas, Krabill, Frederick and JezekThomas and others, 1995). Our results suggest that thickening of the northern tributary may have started as early as 1985, and near the calving front the average thickening reached 25 m a−1. Thickening rates on the south tributary were modest and by 1997 the 20–25 m elevation difference between the tributaries, observed in the mid-1980s by Reference Echelmeyer, Clarke and HarrisonEchelmeyer and others (1991), had disappeared. Reference Thomas, Krabill, Frederick and JezekThomas and others (1995) argue that this thickening does not represent a trend, as it is likely to reflect interannual variability in surface accumulation and ablation. In particular, the very cold summer of 1992 may have contributed significantly to this brief period of thickening. Reference Joughin, Abdalati and FahnestockJoughin and others (2004) note that this interval of thickening corresponds to slowing of the glacier between 1985 and 1992, followed by near-constant speeds until 1997. The period of thickening was short-lived, and ∼1997 the glacier started thinning and has continued to do so at increasing rates.
It is tempting to speculate about the causes for this erratic behavior of thinning and thickening. It may be that, as suggested by Reference WeidickWeidick (1968, p.45), the ice margin responds with a delay of a few years to two decades to fluctuations in climate. The results discussed in this study suggest that the response of Jakobshavn Isbræ to climate forcings involved complex ice dynamics as well.
As pointed out earlier, the calving front became ungrounded in the late 1940s. The release of basal drag resulted in a significant decrease in back pressure on the grounded portion of the glacier, leading to increased longitudinal stretching and consequent glacier thinning. While thinning of the north tributary occurred subsequent to the ungrounding of the terminus, the rate of inland thinning gradually decreased to zero in the mid-1980s. This scenario contradicts the instability mechanism proposed by Reference HughesHughes (1986, Reference Hughes1998), according to which the initial perturbation should be self-sustained and amplified. Whether further thinning and possible glacier collapse was averted by local cooling trends (albeit rather modest (Reference BoxBox, 2002; Fig. 13)) or by adjustment of drainage from the interior to the perturbation at the terminus, remains unresolved.
A second observation of interest concerns the recent collapse of the floating terminus and increase in glacier speed. Measurements of glacier speed indicate an acceleration in flow from an average of 5.7 km a−1 in May 1997 to 9.4 km a−1 in October 2000, followed by a further increase to 10 km a−1 over the summer of 2001 (Reference Joughin, Abdalati and FahnestockJoughin and others, 2004). Thus, retreat of the calving front, which started during the summer of 2002 (Weidick and others, 2004), occurred after the increase in glacier speed. While part of the increase in velocity may be in response to reduced back-stress as the floating tongue thinned, this observation suggests there may have been other contributing factors. In particular, continued thinning of the grounded parts would lower the effective basal pressure and thus lead to increased basal motion, as has been suggested to be the case on Helheim Glacier, East Greenland (Reference PfefferPfeffer, 2007).
Conclusions
Although many questions remain, this study clearly shows that the recent history of Jakobshavn Isbræ is more complex than suggested by the record of terminus position and trimline elevation. Indeed, the record of intermittent thinning, combined with changes in ice-marginal extent and position of the calving front, together with changes in velocity, implies that the behavior of the lower parts of this glacier represents a complex ice-dynamical response to local climate forcing and interactions with drainage from the interior. Existing models are incapable of capturing the interplay among the multitude of processes involved, and consequently any suggested explanation of the inferred intermittent thinning and retreat of Jakobshavn remains speculative to some extent. The data presented in this study should be invaluable for modelers to test and validate their models.
Acknowledgements
We thank Y. Ahn, W. Lee and T. Yoon, graduate students at The Ohio State University, for photogrammetric measurements and data processing, A. Nielsen (KMS) for aerial photographs, V. Gataulin for geomorphologic mapping and J. Box for temperature data. We are grateful to R. Thomas (EG & G Inc.) for stimulating and insightful discussion about the dynamics of Jakobshavn Isbræ. We also thank M. Truffer, an anonymous reviewer and the scientific editor R. Bindschadler for helpful comments. This research was supported by NASA’s Polar Program (NNG06GH08G and NAG5-10978) and by the US National Science Foundation under grants 0520427 and 0424589.



