INTRODUCTION
Climate change has been widely accepted to have played an important role in the development of civilizations (Berglund, Reference Berglund2003; Buckley et al., Reference Buckley, Anchukaitis, Penny, Fletcher, Cook, Sano, Nam, Wichienkeeo, Minh and Hong2010). It has also been established that many collapsed civilizations or ancient sites in the world have been destroyed by climate change, including the final collapse of the Maya civilization in Mesoamerica (Hodell et al., Reference Hodell, Brenner, Curtis and Guilderson2001; Haug et al., Reference Haug, Günther, Peterson, Sigman, Hughen and Aeschlimann2003; Kennett et al., Reference Kennett, Breitenbach, Aquino, Asmerom, Awe, Baldini and Bartlein2012; Douglas et al., Reference Douglas, Demarest, Brenner and Canuto2016) and the Akkadian civilization in western Asia (Weiss and Bradley, Reference Weiss and Bradley2001; Enzel et al., Reference Enzel, Bookman, Sharon, Gvirtzman, Dayan, Ziv and Stein2003), the abandoned occupation in the Sahara of Africa (Kuper and Kropelin, Reference Kuper and Kropelin2006), the social crises in the tropical Pacific basin (Nunn et al., Reference Nunn, Hunter-Anderson, Carson, Thomas, Ulm and Rowland2007), the distress on institutions across Europe (Lamb, Reference Lamb1995), and the demise of Angkor in Southeast Asia (Buckley et al., Reference Buckley, Anchukaitis, Penny, Fletcher, Cook, Sano, Nam, Wichienkeeo, Minh and Hong2010). In China, some cases of the collapse of settlements were thought to be associated with climate change, such as in the Xinjiang oases zone (Zhang et al., Reference Zhang, Wang, Yimit, Shi, Ruan, Sun and Li2011; Jia et al., Reference Jia, Fang and Zhang2017), in eastern Qinghai Province (Dong et al., Reference Dong, Jia, An, Chen, Zhao, Tao and Ma2012), in northern Shaanxi Province (Zhang et al., Reference Zhang, Wang, Yimit, Shi, Ruan, Sun and Li2011; Cui and Chang, Reference Cui and Chang2013), and in the city of Liangzhu in the Yangtze delta (Liu et al., Reference Liu, Sun, Thomas, Zhang, Finlayson, Zhang, Chen and Chen2015). Wagner et al. (Reference Wagner, Tarasov, Hosner, Fleck, Ehrich, Chen and Leipe2013) presented the spatial and temporal distributions of archaeological sites in northern China from the middle Neolithic to the late Bronze Age (ca. 8000–500 BC) and attributed the change in settlements to a weaker summer monsoon. However, the complexity of the issue is that the rise and fall of civilizations and settlements were influenced by interactions among multiple natural and social factors; thus, not all ancient settlements resulted from climate change, even those in climate-sensitive regions such as northeast China.
Modern northeast China is the largest commodity grain base among the major grain production bases in China. The region could provide 34.7% of the total surplus grain of China (Yin et al., Reference Yin, Fang, Tian and Ma2006). Except for the southernmost region of northeast China, alternations between agriculture and animal husbandry have occurred throughout most of northeast China over the past 1000 yr. Although agriculture in northeast China is significantly affected by temperature changes because of the relatively high latitudes, the transformation of farming and grazing and the rise and fall of settlements in northeast China were also directly related to ethnic and socioeconomic factors, which is different from the close relationship between agriculture-pastoral transition and climate change in the farming-pastoral zone of northern China (Zhang et al., Reference Zhang, Fang, Ren and Suo1997).
The abandoned settlements in this region are important records of human civilization that could be used for better understanding the relationship between climate change and human civilization in the historical period. Northern China was alternately controlled by nomadic people and farming people during the historical periods. Nomads have no farming tradition, and they tended to live in removable yurts. The agricultural people had farming traditions, and they tended to settle down for agricultural production. Hence, the settlements of towns and villages in this region are generally related to the occupation of farming groups throughout history. The settlements of towns and villages in this region are generally related to the occupation of farming groups in the history. The distribution of relic settlements could be used to reflect land reclamation in northeast China. Ancient settlements related to agriculture in the Liao and Jin dynasties in the West Liao River basin and Xila Mulun River basin in northeast China have been discussed (Han, Reference Han2003; Li et al., 2006; Han et al., Reference Han, Zhao and Zhang2012), and the spatial distribution of the ancient settlements was affected by altitude, topography, and distance from the river (Han, Reference Han2004). The settlement names recorded in different forms that could show the land use status of the newly reclaimed area have been used to understand the land development processes since the Qing dynasty; the agricultural area was mainly restricted in Liaoning Province in the middle nineteenth century, and the northern boundary of cultivation had extended to the middle of Heilongjiang Province from the late nineteenth century to the early twentieth century (Zeng et al., Reference Zhang, Wang, Yimit, Shi, Ruan, Sun and Li2011).
Although the agricultural background of settlement distribution in northeast China in the Liao, Jin, and Qing dynasties is clear, the variations in settlement distributions among the dynasties and their possible influencing factors in the past millennium need further discussion. This article seeks to analyze the impacts of climatic and social factors on the spatial and temporal distributions of settlements in northeast China over the past 1000 yr to understand the complexity of the relationships between the rise and fall of settlements and climate change.
REGIONAL ENVIRONMENT AND HISTORY
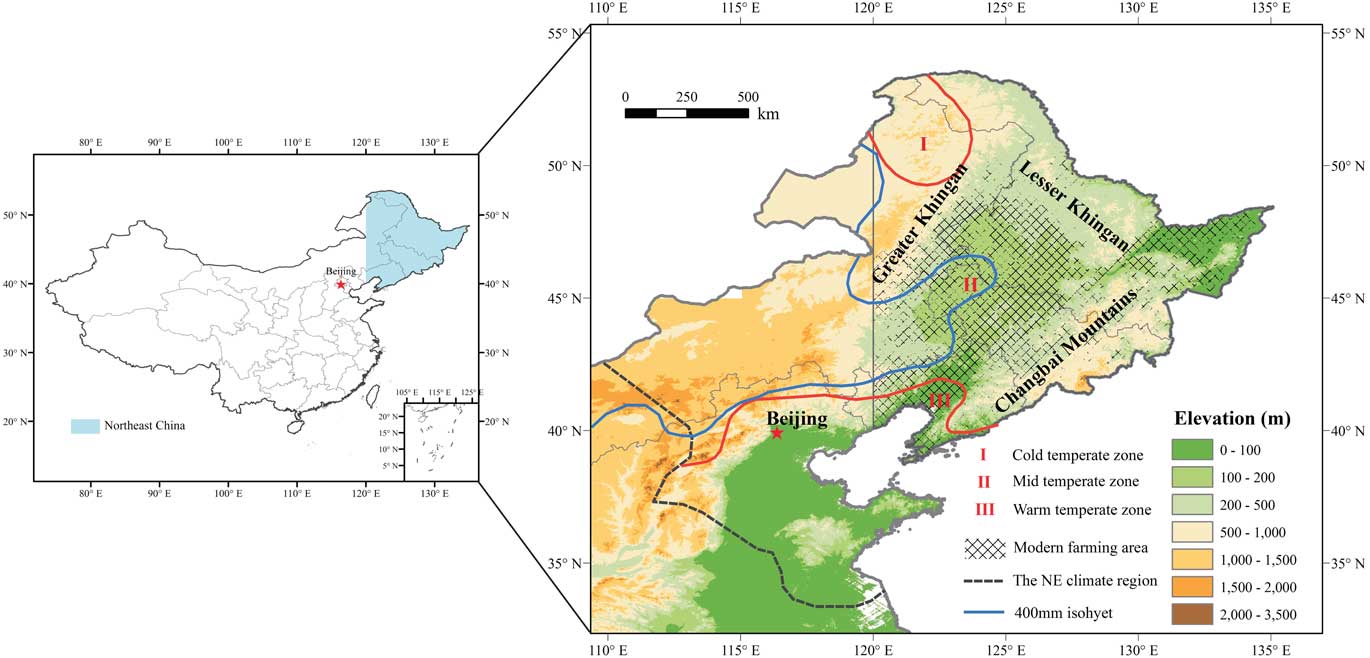
In this study, northeast China was defined as the area within 37°–55°N, 120°–136°E, which covers approximately 95.3×10⁴ km2. It contains all of the Liaoning, Jilin, and Heilongjiang Provinces and the eastern part of Inner Mongolia (east of 120°E). The terrain of northeast China features the Northeast China Plain in the central area, which is lower than approximately 150 m, and is surrounded by mountains with elevations that primarily range from 1000–1500 m, including the Greater Khingan range to the west, the Lesser Khingan range to the north, and Changbai Mountain to the east (Fig. 1) (Zhao et al., Reference Zhao, Fang and Wang2015).
(color online) Overview of northeast China. The black dashed line is the northeast (NE) climate region (Ge et al., Reference Ge, Zheng, Hao, Shao, Wang and Luterbacher2010). The modern farming area is from the Data Center for Resources and Environmental Sciences, Chinese Academy of Sciences (http://www.resdc.cn). The temperate zone and 400 mm isohyet are from the Atlas of Chinese Geography (Zheng et al., Reference Zheng, Bian, Ge, Hao, Yin and Liao2013).

Northeast China crosses cold-temperate, middle-temperate, and warm-temperate zones, and the mean annual temperature is −4°C to 10°C from the north to the south. The annual precipitation generally ranges from 400 to 700 mm (Zhao et al., Reference Zhao, Fang and Wang2015). Although the northern and western regions of northeast China are too cold or too dry to grow crops, most of northeast China is suitable for agriculture. The accumulated temperature (≥10°C), the algebraic sum for the daily interval departures of the average temperature of the air from 10°C (Dong et al., Reference Dong, Liu, Tao, Xu and Wang2009), in most of the central region ranges from 2400°C to 3400°C, where the planting system allows a single annual harvest for the crops of spring wheat, soybeans, and rice. Winter wheat, precocious cotton, and warm temperate fruits can grow normally in southern Liaoning Province, where the accumulated temperature (≥10°C) can reach more than 3400°C to meet the need of the planting system of three harvests in 2 yr. However, crops in northeast China are easily damaged by low temperature (Jin and Zhu, Reference Jin and Zhu2008).
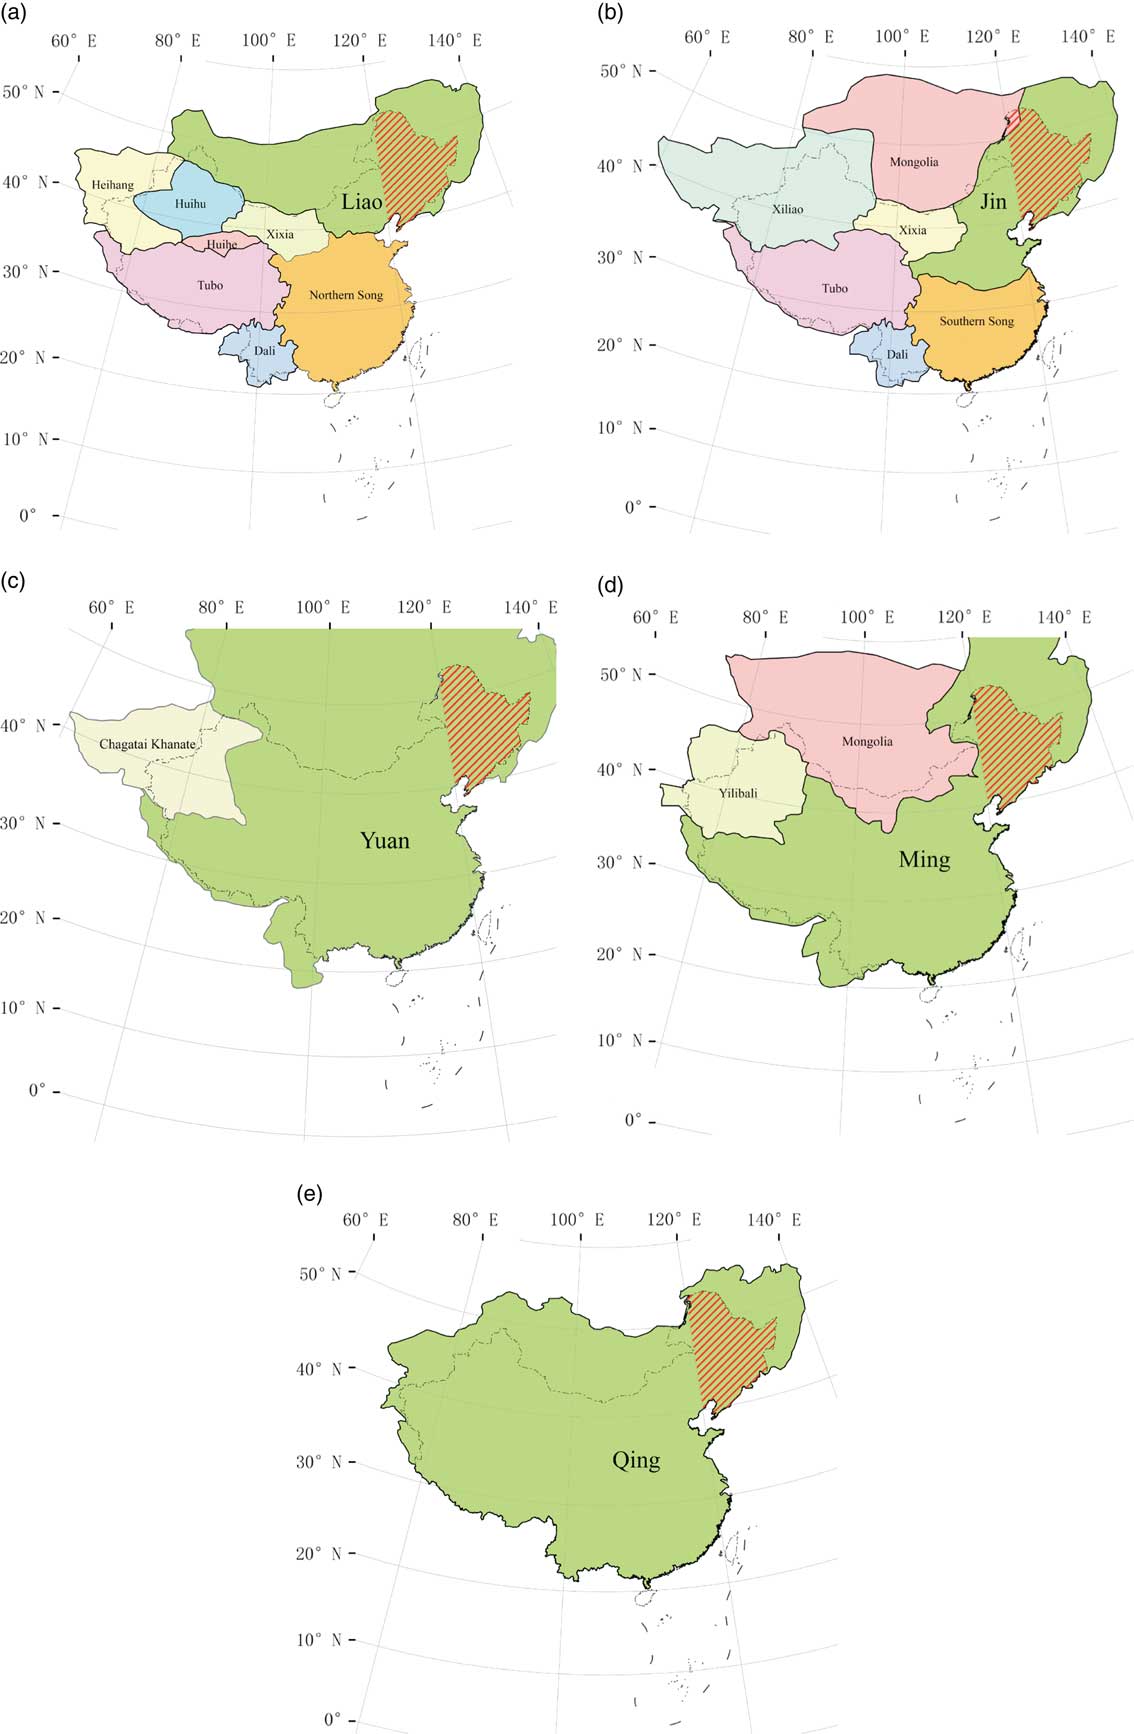
Northeast China was the birthplace of many northern nomadic and hunting peoples throughout the history of China. From the Qin dynasty (221–206 BC) to the Five Dynasties period (AD 907–960), northeast China was divided by various ethnic forces (Fig. 2). After the Khitan people conquered the Bohai state and unified northeast China in AD 926, it was mainly occupied by the Khitan (the Liao dynasty, AD 916–1125), Jurchen (the Jin dynasty, AD 1115–1234), Mongolian (the Yuan dynasty, AD 1279–1368), Manchu (the Ming dynasty, AD 1368–1644), and Han (the Qing dynasty; since AD 1860, the prohibitive migration policy of the Qing dynasty was abolished) peoples (Han, Reference Han1999). The Khitan people of the Liao dynasty originally were nomads and gradually accepted an agricultural economy under the influence of the agricultural groups of the Han and the Bohai peoples. On the basis of agriculture in the Liao dynasty, the Jurchen people of the Jin dynasty continued to encourage migrants and expand the scale of agricultural production to reach the historical peak of agricultural development in northeast China (Han, Reference Han1999). The Mongolian people in the Yuan dynasty were nomads who lacked a farming tradition and did not accept the development of agriculture in northeast China (Wu, Reference Wu1997). Although the Ming dynasty had set up military and civil fortresses in the modern Liaoning Province, the primary purpose was military defense, and cultivation was less developed (Li, Reference Li1986, Reference Li2003). In the Qing dynasty, most of the lands in the modern Jilin and Heilongjiang Provinces were wild because a prohibitive migration policy had been adopted to strengthen and secure the Manchu nationality’s presence and land ownership in northeast China from AD 1668 to 1860 (Yi, Reference Yi1993; Han, Reference Han1999; Li, Reference Li2003). After AD 1860, when the Qing government abolished the prohibitive migration policy and opened the royal paddocks and public wildernesses for cultivation, the largest migrations and land cultivation activities occurred. The agricultural lands gradually extended from south to north into the present Heilongjiang Province (Ye et al., Reference Ye, Fang, Ren, Zhang and Chen2009).
Northeast China in the regimes of China during the Liao (AD 916–1125) (a), Jin (AD 1115–1234) (b), Yuan (AD 1279–1368) (c), Ming (AD 1368–1644) (d), and Qing (AD 1644–1911) (e) dynasties (Tan, Reference Tan1982). The area shown with red slashes is the research region of northeast China. (For interpretation of the references to color in this figure legend, the reader is referred to the web version of this article.)
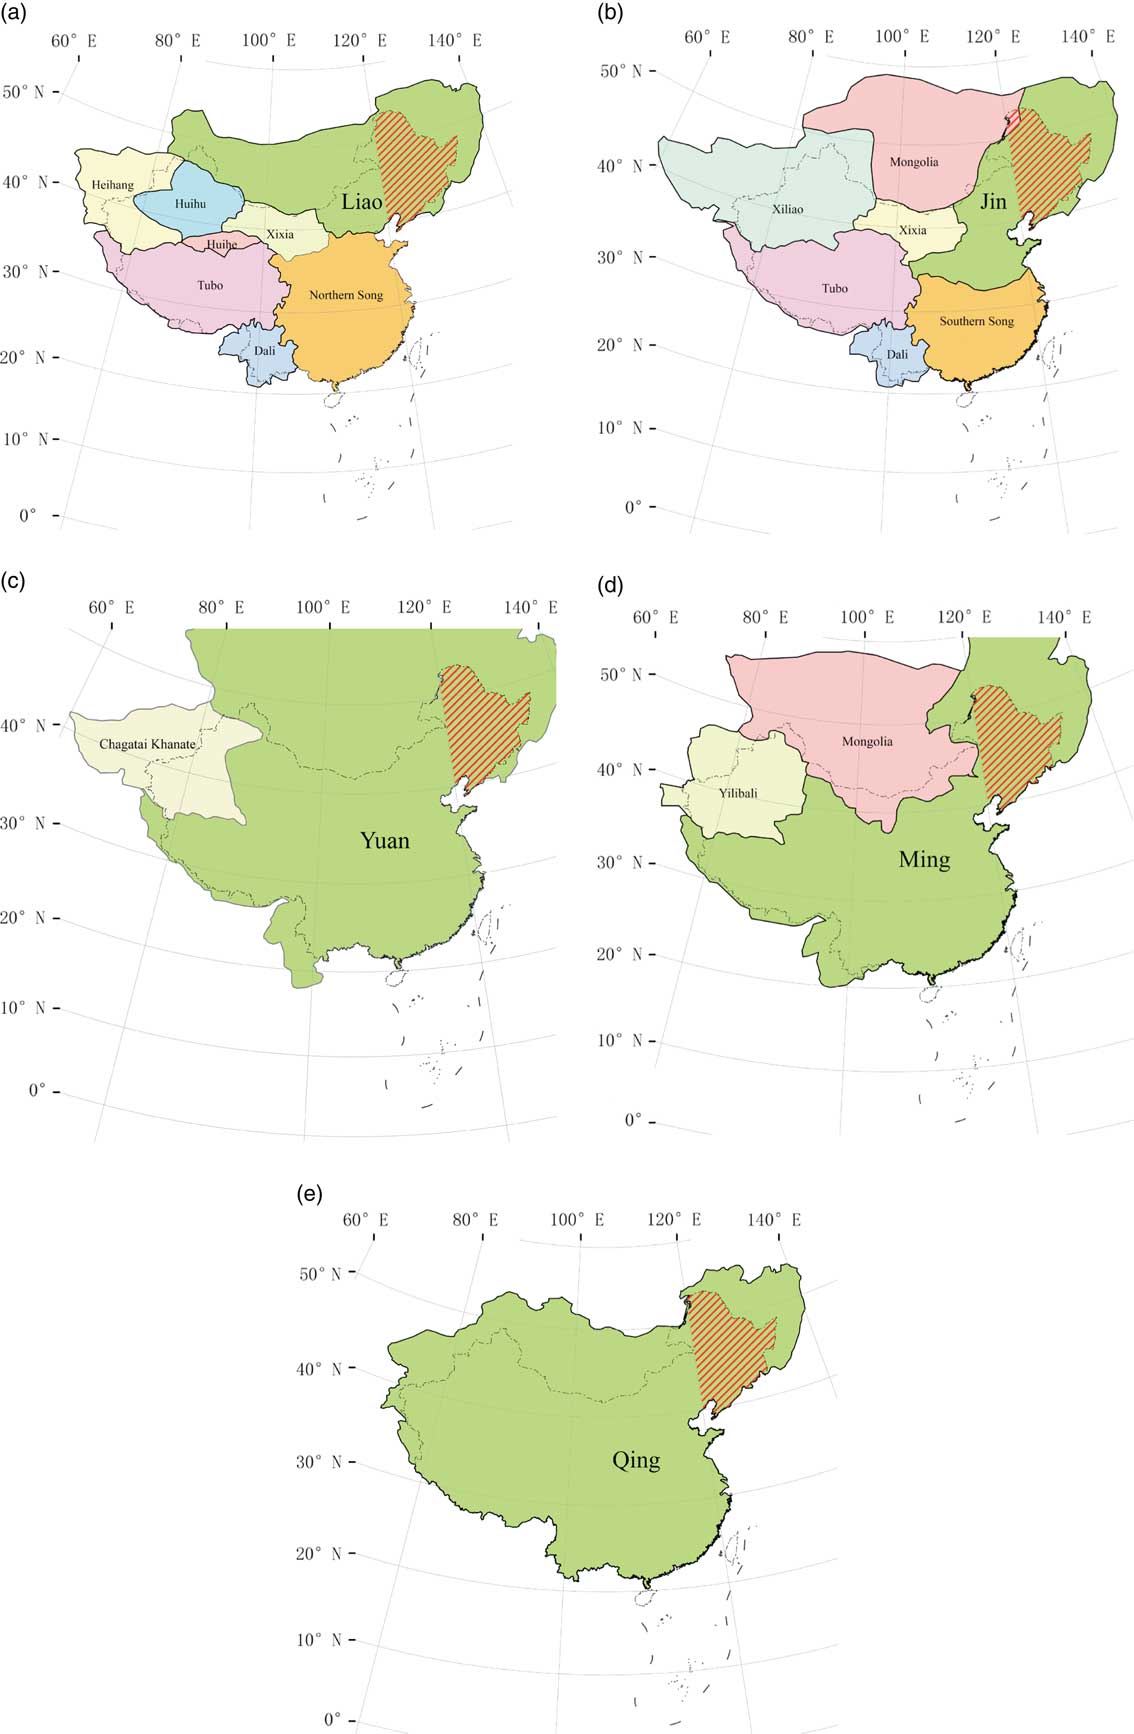
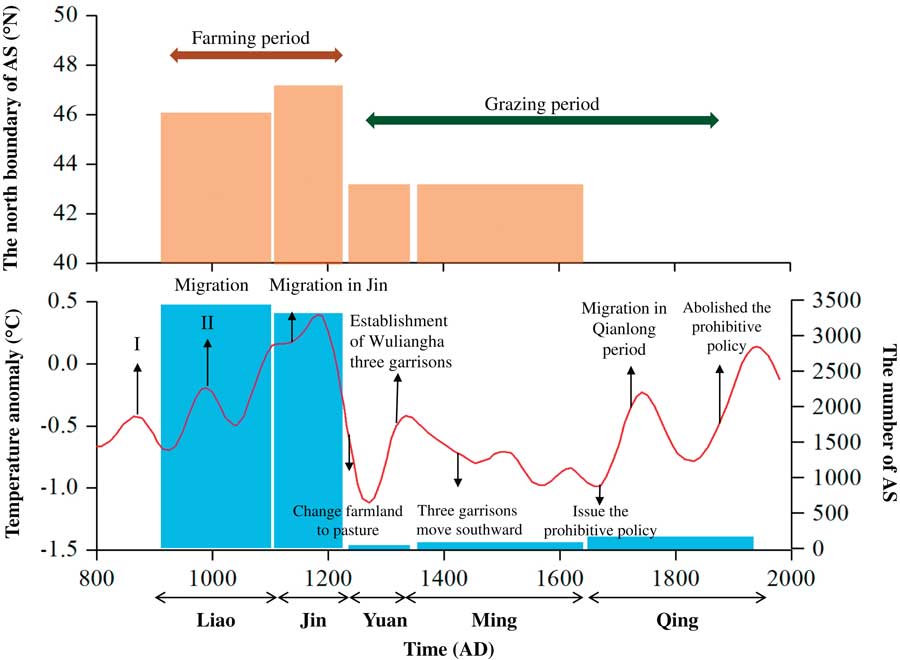
Northeast China remained a separatist state under the control of ethnic minorities from the Qin dynasty to the Five Dynasties period and was unified until the Liao dynasty (Fig. 2). In this article, we studied only the past 1000 yr under the five unified dynasties—namely, Liao, Jin, Yuan, Ming, and Qing. From the perspective of the climatic status of the past 1000 yr, they were in the Medieval Warm Period (MWP; Liao and Jin dynasties) and Little Ice Age (LIA; Yuan, Ming, and Qing dynasties), respectively (Fig. 3).
Temperature change, the total number and northern boundary of ancient settlements (AS), and relevant social events during the last millennium in northeast China. The red solid line represents the 100-year moving average temperature anomaly in northeast China reconstructed by Ge et al. (Reference Ge, Zheng, Hao, Shao, Wang and Luterbacher2010). The blue bars indicate the total number of ancient settlements in each dynasty. The orange bars indicate the northern boundary of the concentrated area of settlement distributions in each dynasty. The arrows indicate the major historical events related to agricultural activities; the up arrows indicate favorable events, and the down arrows indicate adverse events (Sheppard et al., Reference Sheppard, Tarasov, Graumlich, Heussner, Wagner, Österle and Thompson2004; Fang et al., Reference Fang, Ye and Zeng2007; Liu et al., Reference Liu, Zhang, Feng, Hou, Zhou and Zhang2010; Hou et al., 2015, Reference Hou, Yang, Cao and Wang2017). “I” refers to migration in the Liao Taizu and Taizong periods, and “II” refers to migration in the Liao Shengzong period. (For interpretation of the references to color in this figure legend, the reader is referred to the web version of this article.)

DATA AND METHODS
Archaeological settlement data collection and handling
In China, three systematic archaeological surveys covering the whole country were initiated by the Chinese government in 1956, 1981, and 2007, each of which lasted approximately 3–5 yr, respectively (State Administration of Cultural Heritage, 1993, 2003, 2009, 2015). In particular, the second survey during the 1980s provided a vast amount of data, which was used by the State Administration of Cultural Heritage (Chinese: Guojia Wenwuju) in the Atlas of Chinese Cultural Relics publication project presented as a series of consecutive volumes. The atlas has created a basis for heritage protection, settlement management, and further scientific analysis (State Administration of Cultural Heritage, 1993, 2003, 2009, 2015). The minimum administrative unit for all maps of the atlas is the county, and all volumes of the atlas are uniform in their structures and layouts. Two principal components of each volume are settlement location maps and indexes of the mapped settlements with short descriptions in separate subvolumes. The archeological chronologies are, however, recorded in dynastic time resolution.
In this study, we assembled the archaeological settlement data from four volumes (Heilongjiang, Jilin, Liaoning, and Inner Mongolia) of the Atlas of Chinese Cultural Relics (State Administration of Cultural Heritage, 1993, 2003, 2009, 2015), of which the Heilongjiang volume published in December 2015 is the latest one (State Administration of Cultural Heritage, 2015). We created a database of the archaeological settlements from the atlas in four steps: (1) We scanned each county map in the atlas at a high resolution and imported it into ArcGIS Desktop 9.3. (2) Image registration was used with each map in accordance with the administrative boundaries of each county. We then extracted the locations of all the settlements from the map and recorded their names. (3) The ages of the settlements (provided in the respective volumes of the atlas) were consistently assigned. The ages were expressed in the dynasties of Liao (AD 916–1125), Jin (AD 1115–1234), Yuan (AD 1279–1368), Ming (AD 1368–1644), and Qing (AD 1644–1911). (4) We defined the coordinate system (WGS 1984), determined the locations of the settlements, and saved them into the database. A total of 8865 ancient settlements in northeast China are recorded in our database.
We calculated the number of ancient settlements and used the point density toolbox in ArcGIS Desktop 9.3 to calculate the density of settlements to identify the northern boundary of the concentrated areas of the settlements in each dynasty. The criteria for determining the northern boundary of the concentrated area of settlements exceeded 1 (unit: per 100 km2) within a radius of 50 km.
Historical records on regional development
Northeast China has been the multiethnic habitation and birthplace of several nations, including Xianbei, Khitan, Jurchen, Mongolian, and Manchu. As parts of Chinese history, they flourished in northeast China and then moved southward into the Central Plains to affect the developmental history of China. Historical information used in this analysis on social factors in northeast China, including historical evolution, land use, and ethnic composition, were primarily obtained from contemporary scholars’ books, including Agricultural Geography of the Liao and Jin Dynasties (Han, Reference Han1999), Agricultural Geography of the Song Dynasty (Han, Reference Han1993), Agricultural Geography of the Yuan Dynasty (Wu, Reference Wu1997), Agricultural History of Northeast China (Yi, Reference Yi1993), General History of Northeast China (Li, Reference Li2003), and Northeast China of the Ming Dynasty (Li, Reference Li1986). We marked the historical records of agricultural sites on the density maps for comparison with the distribution of settlements in northeast China. In addition, based on the locations of postal roads in the Qing dynasty extracted from The Study on the Northeast Stage Transport of Qing Dynasty (Meng, Reference Meng2007), we registered and digitized the postal roads and marked them on the ancient settlement density maps for comparison. We also marked the significant historical events related to agriculture over the past 1000 yr on the temperature series for comparison.
Climate change data
Considering the limitations of heat resources on agricultural development, temperature change was used to analyze the possible impacts of climate change on agricultural development in northeast China. The temperature series in northeast China is among five reconstructed regional temperature anomaly series in China over the last 2000 yr (northeast, northwest, central east, Tibetan Plateau, and southeast) reconstructed by Ge et al. (Reference Ge, Zheng, Hao, Shao, Wang and Luterbacher2010). The temperature anomaly series (referencing the mean temperatures from 1906 to 2007 in Beijing, Shenyang, and Harbin) for northeast China (Fig. 3) was reconstructed using five published proxy temperature series of sediments from Jinchuan, Huinan County, Jilin Province (42°20′N, 126°22′E) (Hong et al., Reference Hong, Jiang, Liu, Qin, Zhou, Beer, Li, Leng, Hong and Qin2000); the Daihai basin in Liangcheng County of the Inner Mongolia Autonomous Region (40°35′N, 112°42′E) (Xu et al., Reference Xu, Xiao, Toshio, Yang, Yang, Liang and Yoshio2004); stalagmite microlayer thicknesses in Shihua Cave in Beijing (39°47′N, 115°56′E) (Tan et al., Reference Tan, Liu, Hou, Qin, Zhang and Li2003); and historical documents for Shandong Province (Zheng and Zheng, Reference Zheng and Zheng1993) and North China (Wang et al., Reference Wang, Ye and Gong1998; Ge et al., Reference Ge, Hao, Zheng and Shao2013). The reconstructed temperature of northeast China has a much higher confidence, which generally reached 80% in the period after the 1560s.
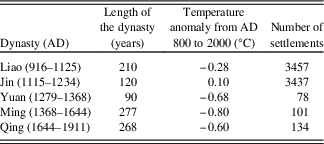
Based on the reconstructed temperature series in northeast China by Ge et al. (Reference Ge, Zheng, Hao, Shao, Wang and Luterbacher2010), we calculated the average temperature anomalies for each of the five dynasties to match the time resolution of settlements during the last millennium (Table 1).
Temperature anomalies and numbers of settlements in the dynasties of the last millennium.

We calculated the northern boundary of the areas of concentrated settlements and reconstructed a series of the number of ancient settlements spanning from the Liao dynasty to the Qing dynasty. We compared the number and northern boundary of the ancient settlements with the temperature sequence and the major historical events related to agricultural activities. We plotted the distribution of the ancient settlements on a density map and performed a spatial analysis of the distribution of the concentrated areas. Furthermore, we assessed the climatic background of the ancient settlements and other possible influencing factors in the different periods.
RESULTS AND ANALYSIS
The general characteristics of the distribution of ancient settlements
A total of 7096 ancient settlements from the Liao dynasty to the Qing dynasty in northeast China were extracted. For the Liao and Jin dynasties, we found a total of 6894 ancient settlements distributed over northeast China, with the northern boundary as far north as 47°N (Fig. 3). For the Yuan, Ming, and Qing dynasties, we found a total of 313 ancient settlements, which were mainly concentrated in the southern Liaoning Province (Fig. 3). The spatial difference between the northern boundaries of the areas of concentrated settlements in the two periods was approximately 4 degrees of latitude (Fig. 3).
The spatial distribution of ancient settlements in each dynasty
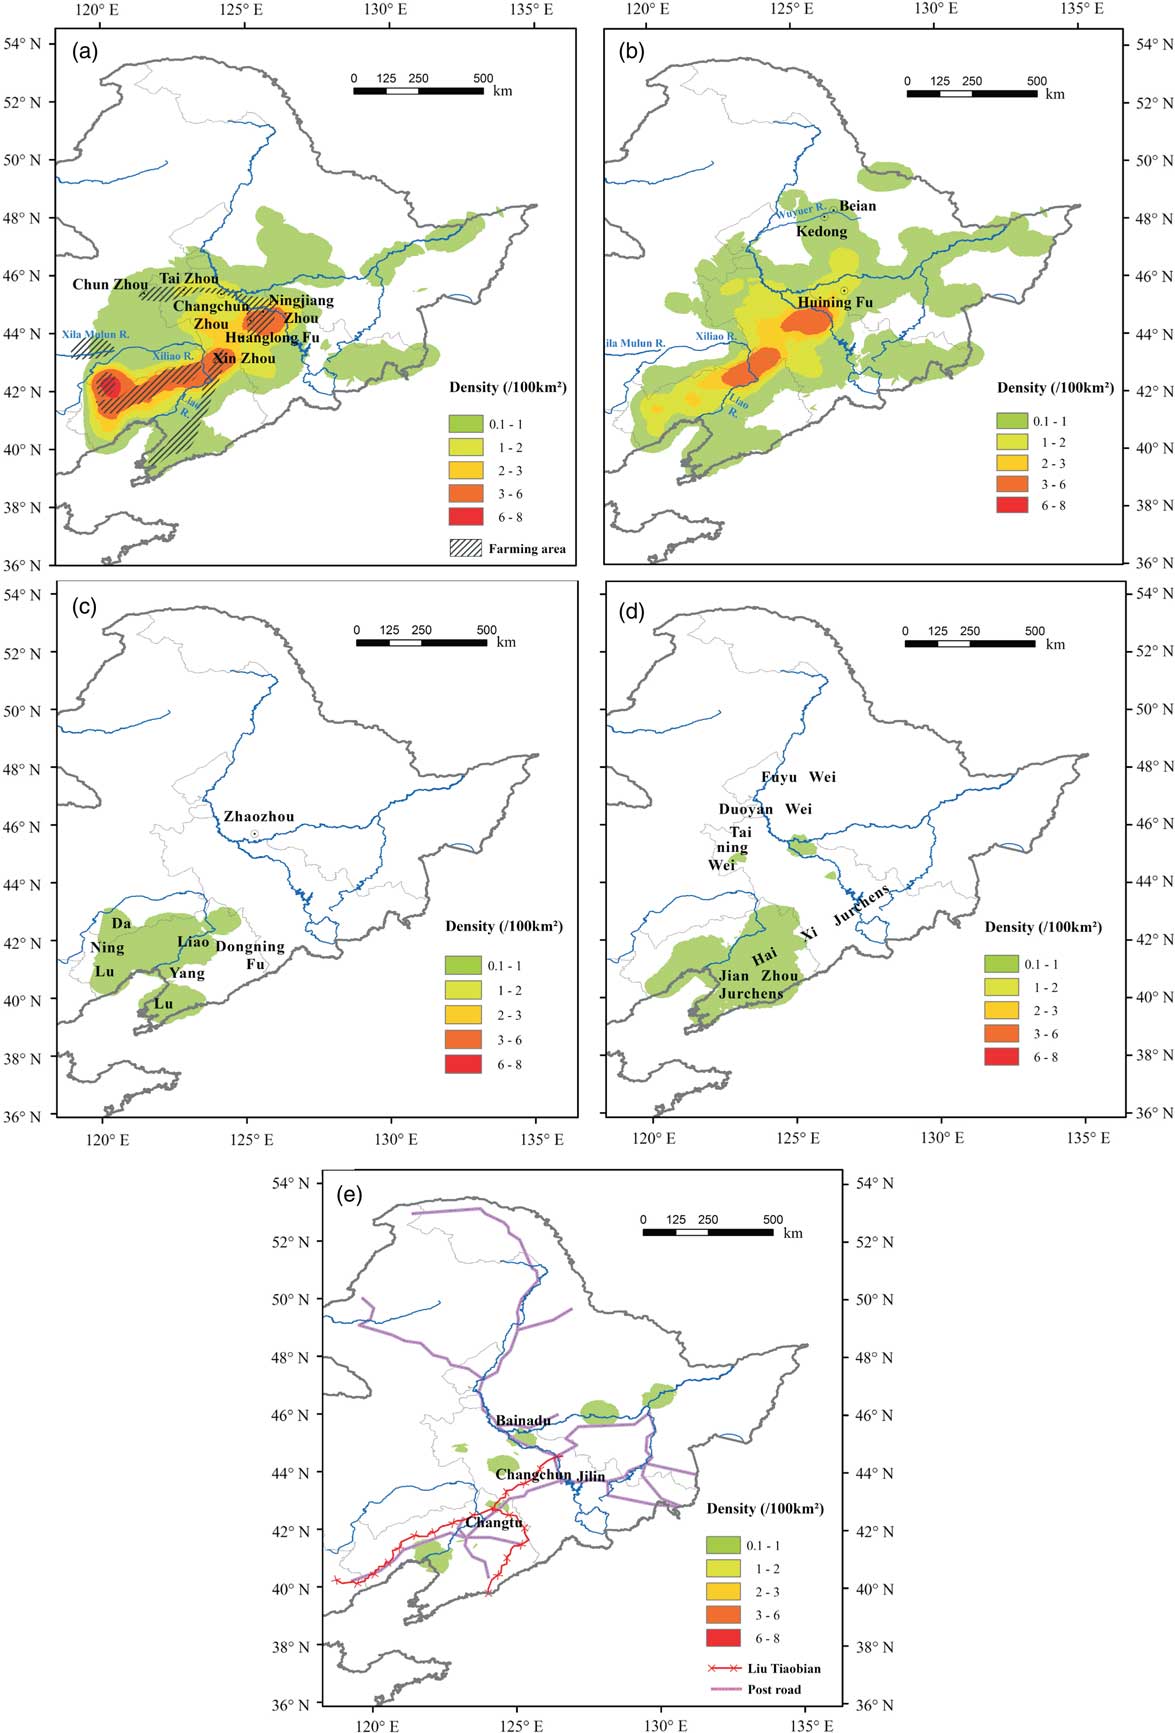
There were a total of 3457 settlements dated to the Liao dynasty and distributed in northeast China (Table 1). The density map shows the concentrated area of the settlements located in modern Liaoning and Jilin Provinces, and the northern boundary of the concentrated area of settlements could reach to 46°N (Fig. 4a). In combination with historical records on agriculture conditions in northeast China, we found the agricultural records confirm that the northern boundaries of the concentrated settlement areas extended as far as 46°N (Fig. 4a). There were three major agricultural reclamation areas recorded in history during the Liao dynasty (Fig. 4a), which were east of the Xila Mulun River basin, within the Xiliao River basin, and that of the frontier towns like Changchun Zhou (Tahu Town Site, Qian Gorlos Mongol Autonomous County, Jilin Province), Chun Zhou (Baoshi Township, Tuquan County, Inner Mongolia Autonomous Region), Xin Zhou (Qinjiatun Town Site, Huaide County, Jilin Province), and Ningjiang Zhou (Tiande Jun, Huanglong Fu, Jilin Province), among others (Han, Reference Han1999).
(color online) Density map of ancient settlements in the Liao (a), Jin (b), Yuan (c), Ming (d), and Qing (e) dynasties.

There were a total of 3437 settlements dated to the Jin dynasty and distributed over northeast China (Table 1). Compared with the Liao dynasty, the reclamation areas of the Jin dynasty extended farther northward to the Songhua River and Wuyuer River (47°N) (Fig. 4b). Numerous settlements in the cities of Beian and Kedong were surrounded by cultivated land in the upper reaches of the Wuyuer River, as recorded in historical records (Jing, Reference Jing1987; Han, Reference Han1999) (Fig. 4b). By combining abandoned settlements and historical documents, we estimated that the northern boundary of the concentrated settlement area was in the vicinity of 47°N.
Only 78 settlements dating from the Yuan dynasty have been found in northeast China (Table 1). The density map shows that almost all those settlements were concentrated in the modern Liaoning Province, which belonged to the Liaoyang, Daning, and Dongning Fus jurisdictions in the Yuan dynasty. The densities were less than 0.1/100 km2 within 50 km radii in the Jilin and Heilongjiang Provinces. The historical records also show that agriculture in the Heilongjiang Province was almost nonexistent (Li, Reference Li2003) (Fig. 4c). The northern boundary of the concentrated settlement area in the Yuan dynasty was approximately 43°N (Fig. 4c).
There were 101 settlements dated to the Ming dynasty in northeast China, which were mainly concentrated in the eastern part of the Liaoning Province and the middle and lower reaches of the Liao River plain, corresponding to the living area of Jianzhou Jurchen. The density was 0.1/100–1/100 km2 in the jurisdictions of Duoyan Wei and Taining Wei, where the Songhua River and Nen River joined in the Ming dynasty (Fig. 4d). In the modern Heilongjiang Province, settlements and agriculture were almost nonexistent in the Ming dynasty (Yi, Reference Yi1993). The northern boundary of the concentrated settlement area was approximately 43°N, which was the same as that in the Yuan dynasty (Fig. 4d).
In general, the distribution of the abandoned settlements in the Qing dynasty was along the postal road in northeast China (Fig. 4e). The 134 relic settlements of the Qing dynasty were sparsely distributed (Table 1). It was difficult to find areas with settlement densities exceeding 0.1/100 km2 in the Qing dynasty, in part possibly because many of the settlements from the Qing dynasty have continued to the present (Li, Reference Li1991, Reference Li1999). The point-shaped concentrated settlement areas were mainly located in the three large reclamation centers of Changchun, Changtu, and Bonadu, which were the places for refugees migrating into northeast China from AD 1791 to 1810 (Yi, Reference Yi1993) (Fig. 4e).
Physical limitations of the general distribution of settlements over the past millennium
Settlements are places where human beings carry out various production and social activities. They were usually built on areas with flat terrain and sufficient water to be convenient for farming activities (Zeng et al., Reference Zhang, Wang, Yimit, Shi, Ruan, Sun and Li2011). In the past 1000 yr, the most concentrated areas of the ancient settlements in northeast China were roughly consistent with that of modern agricultural areas (Fig. 1). Therefore, the natural factors that restrict the distribution of modern agriculture also may have restricted settlement distributions in the past 1000 yr. The northern boundary of the abandoned settlements was often limited by temperature, and therefore, settlements were distributed within the 0°C isotherm that roughly corresponds to the accumulated temperature (≥10°C) of 2000°C, the minimum temperature that precocious crops could be planted. The western boundary of the settlements was mainly limited by precipitation and the mountain of Great Khingan. Planting was mainly confined to the mountain valley basin, and drought was the greatest threat to the development of agriculture in the west. The eastern boundary of the settlement area was limited by Changbai Mountain (Liu, Reference Liu1987).
Climatic background of the distribution of settlements in the Liao and Jin dynasties
Referring to the average temperature anomalies over the past millennium, we divided the past 1000 yr into the Liao and Jin warm periods (average temperature anomaly ≥−0.51°C) and the Yuan, Ming, and Qing cold periods (average temperature anomaly <−0.51°C).
The Liao and Jin dynasties corresponded to the MWP of the last millennium. From the Liao dynasty to the Jin dynasty, temperatures continued to rise, and the average temperature increased by 0.36°C and reached a peak in approximately AD 1190 for the past 1000 yr (Fig. 3). In the late Jin dynasty, the temperature suddenly and drastically dropped, marking the onset of the LIA period (Fig. 3).
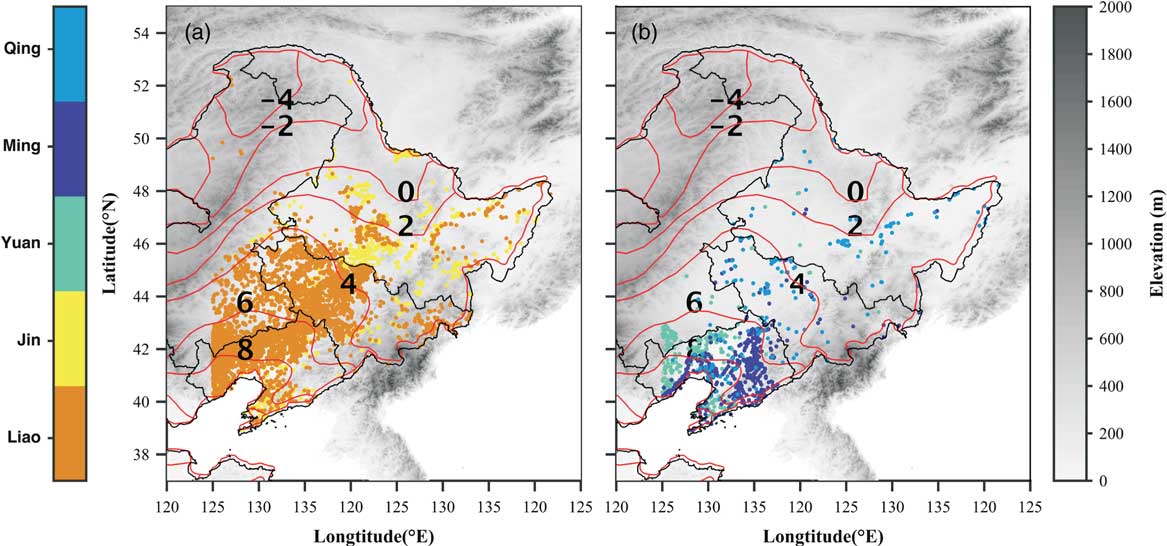
The warm climate provided favorable conditions for the development of agriculture and settlements in the Liao and Jin dynasties and positively affected agricultural policies. According to historical records, the main crops in the Liao and Jin dynasties were millet and beans, of which millet accounted for the greater proportion (Han, Reference Han1999). Millet is a drought-resistant crop that is now planted between 40°N and 48°N in northeast China. Early maturing millet requires growth periods <110 days and accumulated temperatures of <2200°C, medium millet requires growth periods between 110 and 120 days and accumulated temperatures of 2200–2500°C, and late-maturing millet requires growth periods >120 days and accumulated temperatures >2500°C (Liu, Reference Liu1987). The minimum accumulated temperature requirement for the precocious millet in the Sanjiang Plain is 2000°C, which corresponds to an annual mean temperature of 0°C (China Meteorological Administration and Meteorology, 1981). Millet could be planted south of the boundary of 0°C. The temperatures in the Liao and Jin dynasties (AD 916–1234) were higher than now (Ge et al., Reference Ge, Zheng, Hao, Shao, Wang and Luterbacher2010; Wang et al., Reference Wang, Rioual, Panizzo, Lu, Gu, Yang, Han, Liu and Mackay2012), which means millet could be planted in the area south of the modern 0°C isotherm in the Liao and Jin dynasties (Fig. 5). This implies that the northern boundary of the agricultural distribution indicated by the abandoned settlements in the Liao and Jin dynasties could be at least as north as the agricultural distribution now.
The ancient settlements distribution of the (a) MWP and (b) the LIA (the colored dots represent settlements in the research areas of the corresponding dynasties, and the red lines represent the annual mean temperature in °C). (For interpretation of the references to color in this figure legend, the reader is referred to the web version of this article.)

The Liao dynasty was established in AD 907 by the Khitan people and originated in the Huang River (the modern Xila Mulun and Xi Liao Rivers). Subsequently, the Liao conquered the surrounding areas and placed northeast China into a unified regime under the control of the Liao. The Khitan people were originally nomads, but they started farming under the influence of the Han and the Bohai people. As the Khitan conquered central China and the Bohai state, a large number of Han and Bohai people were forced to move into northeast China. To resettle those migrants, the Liao dynasty began to establish administrative cities and develop agriculture. Most of the settlements were surrounded by vast areas of farmland and were built by the Han and the Bohai people with high economic and cultural levels. These “Han cities” were distributed from the Xila Mulun River basin to the Daling and Luan River basins and were important symbols of Liao agricultural development (Li, Reference Li2003). Subsequently, and in accordance with the “Han city” form, the appointment of Han officials and land reclamation began to be widely implemented in the Liao dynasty.
The formation of the farming area in the Liao dynasty was directly related to the migration of agricultural people. The agricultural migrants were concentrated in the main cultivation areas in the Liao dynasty (Han, Reference Han1999). AD 916 to 947 (Liao Taizu and Taizong periods) and AD 982 to 1031 (Shengzong period) were two important stages for the agricultural population entering northeast China. The first stage saw the largest number of Han and Bohai migrants. The Han people mainly moved to the Xila Mulun River basin near the Liao Shangjing (Inner Mongolia Bahrain Zuoqi), and the Bohai people moved to the Xila Mulun River basin and east modern Liaoning Province (Han, Reference Han1999). In the second stage, the Han people mainly moved to the Sixteen Prefectures of Yan and Yun in modern North China, and the Bohai people moved to what is now the eastern part of the modern Liaoning Province; only a small number moved to Liao Shangjing. Until AD 936 large-scale agricultural migration into Liao Shangjing and its surrounding areas was essentially halted (Han, Reference Han1999). The two stages of migration and agriculture development corresponded to two significant warmings during the warm period of the Liao dynasty (Fig. 3).
The Jin dynasty was created in what are now the modern Jilin and Heilongjiang Provinces by the Jurchen tribal chieftain Aguda in AD 1115. After vanquishing the Liao dynasty in AD 1125, the Jin launched a war lasting more than 100 yr against the Song dynasty (AD 960–1279) in southern China. Over the course of their rule, the Jurchen of Jin quickly adapted to the Han customs and fortified the Great Wall against the rising Mongols. The Jurchen people engaged in crop cultivation in the Ashe River basin (Acheng County, modern Heilongjiang Province), a tributary of the Songhua River, before the establishment of the Jin dynasty. After the establishment of the Jin dynasty, to supplement the shortages of agricultural labor caused by the southward migration of a large number of Jurchen people and to learn advanced agricultural technology from the Han, plans were made to move the Han to Heilongjiang Province under the rule of the Jin dynasty (Jing, Reference Jing1987). Compared with that of the Liao dynasty, the Jin agricultural land area extensively expanded northward to the Songhua River basin. In addition to the Han and the Bohai people, the Jurchen, Khitan, Xi, and other ethnic communities joined in agricultural production (Han, Reference Han1999). The migration in the Jin dynasty could be divided into two stages. The first stage started in AD 1125 and lasted approximately 10 to 30 yr. It was concentrated in the Shangjing and Dongjing Lus and was characterized by the northward movement of the Han from the Central Plains. The second stage started in approximately AD 1133 with a large number of Meng’an and Mouke people moving southward, which caused agricultural development in the Liaoning Province to flourish gradually (Han, Reference Han1999).
From the Liao dynasty to the Jin dynasty, with the temperature rising by 0.36°C, the farming areas gradually expanded northward into the Wuyuer River basin. The northern boundary of the abandoned settlement concentrated area moved northward approximately 1 degree of latitude (Fig. 5).
Factors influencing the southward retreat of settlements since the Yuan dynasty
In comparison with those of the Liao and Jin dynasties, the number of settlements in the Yuan, Ming, and Qing dynasties dropped drastically, and the northern boundary of the concentrated settlement area retreated southward for 3–4 latitudes to modern Liaoning Province (43°N). The large-scale southward retreat of the abandoned settlements from the Liao and Jin dynasties to the Yuan, Ming, and Qing dynasties corresponded to the climatic transition from the MWP to the LIA with an approximately 1°C drop (Fig. 3). The climate deterioration undoubtedly affected the southward movement of the farming area and settlements, but the 1°C decrease was unable to cause the concentrated settlement area to retreat southward by 3–4 latitudes. If we assume that the thermal conditions at the northern boundaries of arable lands in the Yuan, Ming, and Qing dynasties were the same as those in the Jin dynasty, it could be inferred that a temperature drop by 1°C could only cause the northern boundary of arable land to move southward from the modern 0°C isotherm to the 1°C isotherm (Fig. 5). Thus, the northern boundary should be approximately 46°N, which was much higher than the latitude of the concentrated settlement area (43°N). Therefore, the cooling from the MWP to LIA might have affected the shift of the northern boundary of the settlement but was not the main factor that influenced the large-scale southward retreat in the Yuan, Ming, and Qing dynasties.
In fact, the historical records in the Yuan, Ming, and Qing dynasties showed that crops could be planted in places more northern than the concentrated area of settlements (43°N). For example, in the Yuan dynasty, there was 103 km2 of croplands in Zhao Zhou, roughly corresponding to the position of 46°N (Yi, Reference Yi1993) (Fig. 4c). In the Ming dynasty, sporadic agriculture of four Hulun tribes of Haixi Jurchen was mainly distributed from north of Kaiyuan city (42°N) to south of the Songhua River (46°N), which corresponded to the sparse settlement distribution (Fig. 4d). This pattern could be attributed to the weak control of the Ming dynasty in the modern Jilin and Heilongjiang Provinces. Although northeast China belonged to the scope of the Ming dynasty, the actual control of the Ming government in northeast China was concentrated in Liaoning Province. Military cultivation and parts of business cultivation and peasant cultivation corresponded to the dense settlement distribution in Liaoning Province. However, the food for the soldiers stationed in Liaodong Dusi (modern Liaoning Province) was mainly transported by sea from Shandong, Jiangnan, and other places (Li, Reference Li2003). In the early Ming dynasty of AD 1389, the government established in Wuliangha three garrisons (Duoyan, Fuyu, and Taining Weis) to strengthen the military defense, which means there were agricultural activities between 44°N and 48°N (Fig. 4d) (Li, Reference Li1986). There was 27 km2 of cropland in Puyu Lu (48°N, 126°E) (Li, Reference Li1986). However, the three garrisons moved south to the Xila Mulun and Laoha River basins at the beginning of the fifteenth century, coinciding with climate deterioration (Ao, Reference Ao1986; Man et al., Reference Man, Ge and Zhang2000). Ningguta (modern Ning’an, 44°N) was the earliest military base in Heilongjiang Province in the Qing dynasty, where reclamation began during the Shunzhi period (AD 1638–1661) (Li, Reference Li1991, Reference Li1999). In AD 1735, there were 174 km2 and 140 km2 of cultivated land distributed in Ningguta and Bukui (modern Qiqihar, 47°N), respectively, corresponding to warm periods during the Qing dynasty. In addition, the Qing government approved reclamation and cultivation by refugees in the Bonadu, Changchun, Jilin, and Changtu rehabilitation centers (46°N) during the Qianlong warm period (AD 1711–1799). After AD 1860, with the abolishment of the prohibitive policy and the construction of a railway, large numbers of Han migrants moved into Heilongjiang Province, which made the farming area expand northward gradually (Li, Reference Li1999), in correspondence with the warming of the twentieth century (Fig. 3).
The historical farming records discussed previously indicate that the places more northern than the concentrated settlement area could be cultivated, at least in warmer phases, if without any social restrictions. However, unlike the Khitan and Jurchen, the Mongolian and Manchu peoples that occupied northeast China in the Yuan, Ming, and Qing dynasties were nomadic and lacked farming traditions. It was social factors, especially national customs and policies, that played more significant roles than temperature deterioration in the processes of the southward retreat of settlements and their distributions in the Yuan, Ming, and Qing dynasties.
After the Mongolians conquered the Jin dynasty in AD 1234, all of northeast China was controlled by the Yuan dynasty. Following the arrival of the Mongolians, a large amount of farmland was converted to pasture (Li, Reference Li2003), and the livestock economy accounted for a considerable proportion of the economy in northeast China in the Yuan dynasty (Wu, Reference Wu1997). In the era of Kublai Khan, the importance of agriculture was recognized gradually, and an agricultural-based economic policy was undertaken. Large tracts of farmland began to appear in the Liao River basin, Liaoxi corridor, north of the Liaodong Peninsula, and south of the Songhua River basin, but the main farming areas were still concentrated in the Liaoyang, Xianping, and Daning Lus, which roughly corresponded to the modern Liaoning Province (Fig. 4c). In the Ming dynasty, the northern part of northeast China (modern Jilin and Heilongjiang Provinces) was mainly occupied by different tribes of Jurchen people (the Wild, Haixi, and Jianzhou) from north to south (Li, Reference Li1986). The economy among the three tribes was unbalanced. The undeveloped Wild Jurchen engaged in gathering and hunting. The Haixi and Jianzhou Jurchen belonged to semifarming and semihusbandry tribes. The Jianzhou Jurchen tribe living in the southeast of modern Liaoning Province (south of 43°N) was the most advanced (Li, Reference Li1986).
Northeast China was the birthplace of the Manchu. The distribution of settlements in the Qing dynasty was strongly affected by the prohibitive policy (AD 1668–1860) that caused northeast China to maintain a closed state over a long period in the Qing dynasty. To protect the profits of the Manchu, the Qing government delineated the forbidden area in northeast China and built the Liu Tiaobian to prevent the Han entering into the Mongolian nomadic area and the Manchu hunting and fishing area (Li, Reference Li2003) (Fig. 4e). At the same time, the Qing government had also designated lands that were forbidden to all but the royal family in northeast China (e.g., paddocks, pastures, and the Gongjiang Mountain) and set aside Changbai Mountain as a holy land (Yi, Reference Yi1993). Jilin and Heilongjiang Provinces are far beyond the Liu Tiaobian, where agriculture was almost nonexistent (Li, Reference Li2003). This corresponds to the sparse distribution of the archaeological settlements.
The sparse distribution of settlements in the area outside of Liu Tiaobian in the Qing dynasty was highly dependent on the traffic lines. Although the area outside of Liu Tiaobian was forbidden to reclamation, there were several postal roads that linked the central and local governments for political control. The settlements along the postal roads provided accommodations and places to change horses for officers responsible for delivering official documents and military intelligence (Meng, Reference Meng2007). Surrounding those ancient settlements, there was some farmland. These features were unlike those in the Yuan and Ming dynasties (Fig. 4e).
CONCLUSIONS
Settlements could be used to investigate the history of agricultural development in northern China. In this study, we created a database of archaeological settlements extracted from the Atlas of Chinese Cultural Relics for northeast China (Liaoning, Jilin, and Heilongjiang Provinces and east of the Inner Mongolia Autonomous Region) including information about time (dynasty) and location from AD 916 to 1911. We used the data to analyze the complexity of the relationships between climate change and changes in agriculture and pasture in northeast China. This research could provide a case for better understanding the impacts of climate change and avoiding environmental determinism. The following are the main conclusions.
In the Liao and Jin dynasties, a large number of settlements were distributed as far north as 47°N, which is almost the same latitude as the northern boundary of the modern farming area in northeast China. The warm climate of the MWP provided a background to promote the positive policies of the Liao and Jin dynasties for the development of agriculture and settlement.
During the Yuan, Ming, and Qing dynasties, the numbers of settlements declined drastically, and the northern boundary of settlement distribution retreated 3–4 latitudes to the modern Liaoning Province. Although the great changes in the spatial and temporal characteristics of the settlement distributions were convincingly associated with the climatic transition from the MWP to LIA, it was social factors, especially national customs and policies, that played more significant roles than temperature deterioration in the process of the southward movement of the settlements.
During the Qing dynasty, agriculture was almost nonexistent in the modern Jilin and Heilongjiang Provinces outside Liu Tiaobian because of the prohibitive policy from AD 1668 to 1860. The settlements sparsely distributed outside Liu Tiaobian could be attributed to the distribution of postal roads.
ACKNOWLEDGMENTS
This work was supported by the National Key R&D Program of China (2017YFA0603304) and the National Scientific Foundation of China (41371201 and 41430528).