Implications
Our findings show for the first time that carnitine inhibits the expression of genes of the ubiquitin proteasome system (UPS), which is the most important system for protein breakdown in tissues. This finding may provide an explanation for the previous observation that carnitine stimulates protein accretion in growing pigs, although a direct relationship between the downregulation of UPS and an increased protein has to be shown in future studies. Nevertheless, this study, overall, confirms recent studies indicating that carnitine has a beneficial effect on protein metabolism in pigs.
Introduction
l-Carnitine (3-hydroxy-4-N,N,N-trimethylaminobutyric acid) is an essential compound that serves a number of indispensable functions in intermediary metabolism. The most important function is in its role in the transport of activated long-chain fatty acids from the cytosol to the mitochondrial matrix in which β-oxidation takes place. Thus, all tissues that use fatty acids as an energy source require carnitine for normal function (McGarry and Brown, Reference McGarry and Brown1997; Kerner and Hoppel, Reference Kerner and Hoppel2000).
Evidence suggests that the supplementation of carnitine improves the performance characteristics of livestock or sport animals, such as horses (Foster et al., Reference Foster, Harris and Pouret1989; Rivero et al., Reference Rivero, Sporleder, Quiroz-Rothe, Vervuert, Coenen and Harmeyer2002) dairy cows or steers (LaCount et al., Reference LaCount, Drackley and Weigel1995; Greenwood et al., Reference Greenwood, Titgemeyer, Stokka, Drouillard and Löest2001), laying hens and broilers (Geng et al., Reference Geng, Li and Guo2007; Zhai et al., Reference Zhai, Neuman, Latour and Hester2008). In addition, an improvement of performance characteristics in response to carnitine supplementation was reported for sows (Musser et al., Reference Musser, Goodband, Tokach, Owen, Nelssen, Blum, Campbell, Smits, Dritz and Civis1999; Ramanau et al., Reference Ramanau, Kluge, Spilke and Eder2002 and Reference Ramanau, Kluge, Spilke and Eder2004), growing–finishing pigs (Heo et al., Reference Heo, Odle, Han, Cho, Seo, van Heugten and Pilkington2000; Owen et al., Reference Owen, Nelssen, Goodband, Tokach and Friesen2001a; Birkenfeld et al., Reference Birkenfeld, Ramanau, Kluge, Spilke and Eder2005) and, in particular, suckling and weanling piglets (Wolfe et al., Reference Wolfe, Maxwell and Nelson1978; Heo et al., Reference Heo, Odle, Han, Cho, Seo, van Heugten and Pilkington2000; Rincker et al., Reference Rincker, Carter, Real, Nelssen, Tokach, Goodband, Dritz, Senne, Fent, Pettey and Owen2003). In piglets, dietary carnitine supplementation increased whole-body protein accretion and simultaneously decreased fat deposition (Owen et al., Reference Owen, Nelssen, Goodband, Weeden and Blum1996; Heo et al., Reference Heo, Odle, Han, Cho, Seo, van Heugten and Pilkington2000). Regarding the underlying mechanisms of action, it has been postulated that the beneficial effect of carnitine on growth performance in piglets is due to an increase in available energy to the growing piglet. It has been suggested that the increase in energy availability is due to an improvement in fatty acid oxidation, which in turn enhances energy availability for protein accretion and/or growth (Owen et al., Reference Owen, Jit, Maxwell, Nelssen, Goodband, Tokach, Tremblay and Koo2001b; Rincker et al., Reference Rincker, Carter, Real, Nelssen, Tokach, Goodband, Dritz, Senne, Fent, Pettey and Owen2003). In an attempt to explore further effects of carnitine that might contribute to its beneficial effect on protein accretion, we have recently performed genome-wide transcript profiling in skeletal muscle of piglets fed supplemental carnitine (Keller et al., Reference Keller, Ringseis, Priebe, Guthke, Kluge and Eder2011). Using this approach, we observed that several genes belonging to the UPS were downregulated by carnitine, indicating that carnitine may inhibit the UPS. The UPS is the most important system for intracellular protein degradation in mammalian cells. It consists of several components, namely the 26S proteasome and three enzymatic components, designated as E1, E2 and E3 classes. The 26S proteasome is a large multicatalytic protease complex that degrades ubiquitinated proteins to small peptides. The β subunits of this complex are of particular significance functionally as they are responsible for its proteolytic activities (Baumeister et al., Reference Baumeister, Walz, Zühl and Seemüller1998). Substrates for proteasomal proteolysis are marked by the addition of ubiquitin molecules. E1 (ubiquitin-activating enzymes) and E2 (ubiquitin carrier or conjugating proteins) prepare ubiquitin for conjugation, whereas E3, which is the key enzyme class in this process, recognizes a specific protein substrate and catalyses the transfer of the activated ubiquitin to it. Successful ubiquitination of the target protein by E3 is followed by their unfolding and importing into the proteasome by an ATP-dependent process, where it is degraded (Attaix et al., Reference Attaix, Ventadour, Codran, Bechet, Thaillandier and Combaret2005). The significance of the UPS for whole-body protein status is shown by the fact that the stimulation of this system under certain pathological (e.g. metabolic acidosis, kidney failure, muscle denervation, diabetes mellitus, thermal injury, glucocorticoid treatment, hyperthyroidism) as well as physiological conditions (e.g. fasting) leads to muscle atrophy (Mitch and Goldberg, Reference Mitch and Goldberg1996; Costelli and Baccino, Reference Costelli and Baccino2003; Murton et al., Reference Murton, Constantin and Greenhaff2008). As stimulators of the UPS in response to pathological conditions, pro-inflammatory cytokines and glucocorticoids have been identified (Nury et al., Reference Nury, Doucet and Coux2007), whereas insulin and IGF-1 were shown to suppress the UPS (Mitch and Goldberg, Reference Mitch and Goldberg1996; Tisdale, Reference Tisdale2005).
In light of the above-mentioned findings, we hypothesized that carnitine supplementation inhibits protein breakdown by downregulating genes of the UPS. To test this hypothesis, we used tissue samples taken from a previous experiment with piglets (Keller et al., Reference Keller, Ringseis, Priebe, Guthke, Kluge and Eder2011) that were fed a diet supplemented with carnitine and determined the transcript levels of important genes involved in the UPS in skeletal muscle, namely ubiquitin, the subunits Psma1 and Psmb1 of the 20S proteasome, E214k as a member of the E2 enzyme class and atrogin-1 and MuRF1 as members of the E3 enzyme class. In this recent study, carnitine concentrations in tissues and plasma were markedly increased (approximately fourfold) by carnitine, indicating that the carnitine status of these piglets was significantly improved by the supplement. As the UPS is also important for protein degradation in visceral tissues, we also investigated changes in the liver as a tissue with a high protein turnover. To explore whether carnitine has a direct effect on the expression of components of the UPS, we also investigated the effect of carnitine on the expression of genes of the UPS in C2C12 myotubes and HepG2 cells, which are established in vitro model systems for skeletal muscle cells and hepatocytes, respectively.
Material and methods
Animal experiment
The animal experiment was approved by the local Animal Care and Use Committee. As described recently in more detail (Keller et al., Reference Keller, Ringseis, Priebe, Guthke, Kluge and Eder2011), the experiment was performed with sixteen male crossbred pigs ((German Landrace × Large White) × Pietrain) with an average body weight of 10 ± 1 (mean ± s.d.) kg. The pigs were assigned to two groups (control and carnitine) and fed experimental diets for a period of 21 days. The control group received a basal diet with a low native carnitine concentration (<5 mg/kg), which was nutritionally adequate for growing pigs in a body weight range between 10 and 20 kg, according to the recommendations of the German Society for Nutrition Physiology (Gesellschaft für Ernährungsphysiologie, 2006). The carnitine group received the same diet supplemented with 500 mg l-carnitine/kg (obtained from Lohmann Animal Health, Cuxhaven, Germany). At the end of the feeding experiment, pigs with a mean body weight of 17.0 ± 3.2 kg were sacrificed. The feed intake, final body weights and feed conversion ratio were not different between both the groups (Keller et al., Reference Keller, Ringseis, Priebe, Guthke, Kluge and Eder2011). Blood sample was collected and plasma was obtained by centrifugation of the blood, and the skeletal muscle and liver were excised. Plasma and tissue samples were immediately stored at −80°C until analysis. A full description of the diet composition, feeding regime, sample collection and carnitine analysis of the diets and tissues can be found in our recent publication (Keller et al., Reference Keller, Ringseis, Priebe, Guthke, Kluge and Eder2011).
Cell culture experiments
HepG2 cells
As a model for hepatocytes, the hepatoma cell line HepG2, obtained from the German Collection of Microorganisms and Cell Cultures (Braunschweig, Germany), was used. HepG2 cells were grown in RPMI1640 medium (GIBCO/Invitrogen, Karlsruhe, Germany) supplemented with 10% foetal calf serum (GIBCO/Invitrogen) and 0.5% gentamycin (GIBCO/Invitrogen) at 37°C in 5% CO2 (Eder et al., Reference Eder, Slomma and Becker2002). Cells were seeded in 24-well culture plates (Catalogue no. 662960; Greiner Bio-One, Frickenhausen, Germany) at a density of 2.2 × 10⁵ cells/well and, before reaching confluence (usually 3 days after seeding), incubated with different concentrations (0, 50, 100, 500 and 1000 μM) of l-carnitine (⩾98% pure; Sigma-Aldrich, Taufkirchen, Germany) for 24 h. Incubation media containing carnitine were prepared by diluting the carnitine stock solution (100 mM in bi-destilled water) with RPMI1640 medium without supplements to the concentrations indicated. At the end of incubation, the media were discarded, the cell layer was washed once with phosphate-buffered saline (PBS) and plates including the attached cells were immediately placed in a refrigerator at −80°C.
C2C12 myoblasts
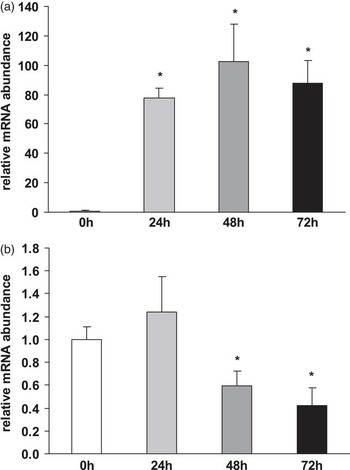
As a model for skeletal muscle cells, the muscle-derived C2C12 myoblast cell line, obtained from Cell Lines Service (Eppelheim, Germany), was used. Undifferentiated myoblasts were grown in Dulbecco's modified Eagle's medium (DMEM; GIBCO/Invitrogen, Karlsruhe, Germany) supplemented with 10% foetal calf serum and 0.5% gentamycin at 37°C in 5% CO2 (Mordier et al., Reference Mordier, Deval, Béchet, Tassa and Ferrara2000). Cells were seeded in 24-well culture plates (Catalogue no. 662960; Greiner Bio-One) at a density of 1.5 × 10⁴ cells/well. After reaching 60% to 70% confluence (after 3 days), the medium was replaced by DMEM supplemented with 2% horse serum to induce myogenic differentiation into myotubes. In preliminary experiments, successful differentiation into myotubes was confirmed by determining the mRNA levels of myogenin – a myogenesis-stimulating factor that is upregulated during differentiation – and AT-motif-binding factor 1 (ATBF1-A) – a myogenesis-inhibiting factor that is downregulated during differentiation (Figure 1). For this, cells were seeded as mentioned above and cultured with differentiation medium for different durations (0, 24, 48 and 72 h). Subsequently, RNA was isolated as described below and analysed for myogenin and ATBF1-A mRNA levels. The medium was changed every 48 h, and differentiation was allowed to continue for 96 h. Subsequently, myotubes were incubated with different concentrations (0, 50, 100, 500 and 1000 μM) of carnitine for 24 h. Incubation media containing carnitine were prepared as described in the section ‘HepG2 cells’, except that DMEM was used as a medium.
Relative mRNA abundance of myogenin (a) and AT-motif-binding factor 1 (ATBF1-A) (b) in C2C12 myotubes treated with differentiation medium for different durations (0, 24, 48 and 72 h). Data are expressed relative to the mRNA concentrations of time point 0 h (= 1.0). Bars are mean ± s.d. from three independent experiments performed in quadruplicate. Bars marked without a common superscript letter differ significantly at P < 0.05.

To study the effect of carnitine on stimulus-induced expression of genes of the UPS, cells were treated in parallel with different carnitine concentrations and 10 μM hydrocortisone. Cells treated with 10 μM hydrocortisone without carnitine were used as controls (stimulated control). Cells treated without hydrocortisone were used as a negative control (unstimulated control). At the end of incubation, the media were discarded, the cell layer was washed once with PBS and plates including the attached cells were immediately placed in a refrigerator at −80°C.
RNA isolation and quantitative real-time PCR (qPCR)
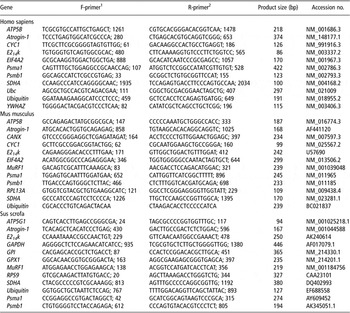
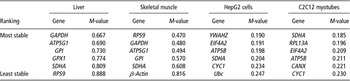
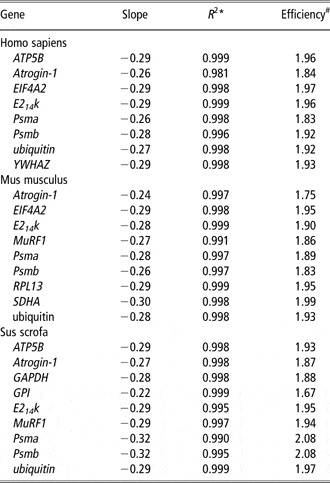
For the determination of mRNA expression levels, total RNA was isolated from the liver, skeletal muscle and cells using Trizol™ reagent (Invitrogen, Karlsruhe, Germany) according to the manufacturer's protocol. RNA from 15 mg of each tissue was isolated within 1 week after completion of the trial. RNA from cells (24 well at 90 (HepG2 cells) and 80% (C2C12 myotubes) confluence) was isolated within 1 week following cell incubation by adding Trizol directly to the wells, and pipetting the lysed cells up and down 2 to 3 times. Genomic DNA was removed from total RNA isolated with on-column DNase I digestion using RNeasy Mini Kit columns (Qiagen, Germany). Isolated RNA was preserved at −80°C until use. The RNA concentration and purity were estimated from the optical density at 260 and 280 nm, respectively. The A260/A280 ratios were 1.98 ± 0.02 (Mean±SD) (liver), 2.00 ± 0.02 (muscle), 1.89 ± 0.04 (HepG2 cells) and 1.92 ± 0.04 (C2C12 myotubes). cDNA was synthesized in less than a week after RNA extraction from 1.2 μg of total RNA using 100 pmol dT18 primer (Eurofins MWG Operon, Ebersberg, Germany), 1.25 μl 10 mmol/l dNTP mix (GeneCraft, Lüdinghausen, Germany), 5 μl buffer (MBI Fermentas, St. Leon-Rot, Germany) and 60 units M-MuLV reverse transcriptase (MBI Fermentas) at 42°C for 60 min, and a final inactivating step at 70°C for 10 min in a Biometra Thermal Cycler (Whatman Biometra®, Göttingen, Germany). Subsequently, cDNA was stored in aliquots at −20°C. For the standard curve, a cDNA pool each from the liver, muscle, HepG2 cells and C2C12 myotubes was prepared. qPCR was performed using 2 μl cDNA combined with 18 μl of a mixture composed of 10 μl KAPA SYBR FAST qPCR Universal Mastermix (Peqlab, Erlangen, Germany), 0.4 μl each of 10 μM forward and reverse primers and 7.2 μl DNase/RNase free water in 0.1 ml tubes (Ltf Labortechnik, Wasserburg, Germany). Gene-specific primer pairs obtained from Eurofins MWG Operon were designed using Primer3 and BLAST. The features of the primer pairs are listed in Table 1. All primer pairs were designed to have melting temperatures of about 60°C and, if possible, both primers of a primer pair were designed to be located in different exons. qPCR runs were performed using a Rotorgene 2000 system (Corbett Research, Mortlake, Australia) and included all samples and a 5-point relative standard curve plus the non-template control. The qPCR protocol was as follows: 3 min at 95°C, followed by 40 cycles of a two-step PCR consisting of 5 s at 95°C (denaturation) and 20 s at 60°C (annealing and extension). Subsequently, melting curve analysis was performed from 50°C to 95°C to verify the presence of a single PCR product. In addition, the amplification of a single product of the expected size was confirmed using 2% agarose gel electrophoresis stained with GelRed™ nucleic acid gel stain (Biotium, Hayward, CA, USA). C t values of target genes and reference genes were obtained using Rotorgene Software 5.0 (Corbett Research). For the determination of the relative expression levels, relative quantities were calculated using the GeNorm normalization factor. To calculate the normalization factor, all C t values were transformed into relative quantification data using the 2−ΔCt equation (Livak and Schmittgen, Reference Livak and Schmittgen2001), and the highest relative quantities for each gene were set to 1. From these values, the normalization factor was calculated as the geometric mean of expression data of the three most stable out of six tested potential reference genes (Table 2). Reference gene stability across samples from each tissue and each cell line was determined by performing GeNorm analysis (Vandesompele et al., Reference Vandesompele, De Preter, Pattyn, Poppe, Van Roy, De Paepe and Speleman2002). After normalization of gene expression data using the calculated GeNorm normalization factor, the mean and s.d. were calculated from normalized expression data for samples of the same treatment group. The mean of the control group was set to 1 and the mean and s.d. of the other treatment groups were scaled proportionally. Data on qPCR performance for each gene measured in the tissues and cell lines are shown in Table 3.
Characteristics of the primers used for quantitative real-time PCR analysis

1 Forward primer (from 5′ to 3′) and hybridization position.
2 Reverse primer (from 5′ to 3′) and hybridization position.
Average expression stability ranking of six candidate reference genes used in pig liver and skeletal muscle, HepG2 cells and C2C12 myotubesFootnote *

* Ranking of the candidate reference genes according to their stability score M as calculated by the Microsoft Excel-based application GeNorm.
Quantitative real-time PCR performance data

*Coefficient of determination of the standard curve.
The efficiency is determined by [10−slope].
Statistical analysis
Data of all experiments were analysed using the Minitab Statistical Software Rel 13.0 (Minitab, State college, PA, USA). Treatment effects were analysed using one-way ANOVA. For significant F-values, means were compared using Fisher's multiple-range test. Means were considered significantly different at P < 0.05. Data shown from the animal experiment are mean ± s.d. for n = 8/group. Data shown from cell culture experiments are mean ± s.d. for n = 3 independent experiments.
Results
Effect of carnitine on mRNA abundance of selected genes of the UPS in skeletal muscle and liver of piglets
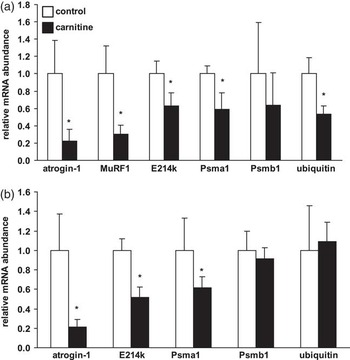
Carnitine supplementation decreased the relative mRNA concentrations of atrogin-1, MuRF1, E214k, Psma1 and ubiquitin in the skeletal muscle of piglets by 40% to 80% (P < 0.05; Figure 2a). The relative mRNA level of Psmb1 in the skeletal muscle did not differ between both the groups (Figure 2a).
Relative mRNA abundance of selected genes of the ubiquitin proteasome system in the skeletal muscle (a) and liver (b) of growing pigs fed either a control diet or a diet supplemented with 500 mg carnitine/kg diet. Bars are mean ± s.d. (n = 8/group). The normalized expression ratio in the control group is set to 1.0. *Significantly different from the control group (0 mg carnitine/kg diet) at P < 0.05.

The relative mRNA levels of atrogin-1, E214k and Psma1 in the liver were 40% to 80% lower (P < 0.05) in the carnitine group than in piglets fed the control diet (Figure 2b), whereas the mRNA levels of Psmb1 and ubiquitin in the liver were not affected by carnitine supplementation (Figure 2b).
Effect of carnitine on mRNA abundance of selected genes of the UPS in C2C12 myotubes and HepG2 liver cells
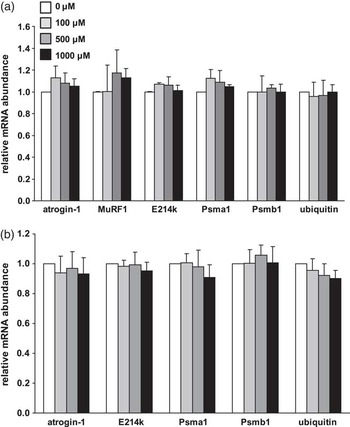
Incubating C2C12 myotubes and HepG2 liver cells with increasing concentrations of carnitine had no effect on the relative mRNA levels of genes of the UPS (Figure 3a and b), indicating that the effect of carnitine on the expression of genes of the UPS in skeletal muscle and liver of piglets is not a direct effect.
Relative mRNA abundance of selected genes of the ubiquitin proteasome system in C2C12 myotubes (a) and HepG2 liver cells (b) treated with increasing concentrations of carnitine (0, 100, 500 and 1000 μM). Data are expressed relative to the mRNA concentrations of the control group (n = 1.0). Bars are mean ± s.d. from three independent experiments performed in quadruplicate. Bars marked without a common superscript letter differ significantly at P < 0.05.

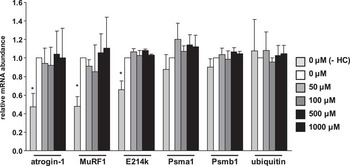
In Figure 4, the effect of carnitine on the relative mRNA levels of genes of the UPS in C2C12 myotubes under stimulated conditions (hydrocortisone) is shown. The relative mRNA levels of atrogin-1, MuRF1 and E214k, but not ubiquitin, Psma1 and Psmb1, were increased in cells stimulated with hydrocortisone relative to unstimulated cells (P < 0.05). However, incubating hydrocortisone-stimulated C2C12 myotubes with increasing concentrations of carnitine also had no effect on the relative mRNA levels of genes of the UPS (Figure 4).
Relative mRNA abundance of selected genes of the ubiquitin proteasome system in C2C12 myotubes treated with increasing concentrations of carnitine (0, 50, 100, 500 and 1000 μM) and 10 μM hydrocortisone (+HC). C2C12 myotubes treated with 10 μmol/l hydrocortisone served only as controls. C2C12 myotubes treated without hydrocortisone served as unstimulated controls. Data are expressed relative to the mRNA concentrations of the control group (n = 1.0). Bars are mean ± s.d. from three independent experiments performed in quadruplicate. Bars marked without a common superscript letter differ significantly at P < 0.05.

Discussion
As a main finding, we observed that the transcript levels of genes belonging to the UPS were markedly reduced in both the skeletal muscle and the liver of piglets fed supplemental carnitine. These findings confirm indications from a recently performed DNA microchip analysis in which the expression levels of genes of the UPS pathway were reduced in pigs with carnitine supplementation (Keller et al., Reference Keller, Ringseis, Priebe, Guthke, Kluge and Eder2011). The most drastic downregulation by the supplemental carnitine of genes belonging to the UPS was observed for genes encoding the E3 ligases (atrogin-1 and MuRF1). Both atrogin-1 and MuRF1 are considered key mediators and established markers of protein degradation via the UPS because they are responsible for connecting multiple ubiquitin monomers to the target protein, which is an essential step in the proteolytic breakdown of intracellular proteins (Thrower et al., Reference Thrower, Hoffman, Rechsteiner and Pickart2000; Cao et al., Reference Cao, Kim and Lecker2005). The importance of these E3 ligases is underlined by the fact that under pathological conditions (e.g. metabolic acidosis, kidney failure or muscle denervation) of increased protein loss, these two E3 ligases are consistently upregulated, whereas E1 and E2 ligases and ubiquitin are not or only marginally upregulated under such conditions (Wray et al., Reference Wray, Mammen, Hershko and Hasselgren2003; Lecker et al., Reference Lecker, Jagoe, Gilbert, Gomes, Baracos, Bailey, Price, Mitch and Goldberg2004). The role of the E3 ligases in muscle atrophy has also been clearly demonstrated in knockout studies with mice in which the deletion of MuRF1 and atrogin-1 resulted in 36% and 56%, respectively, sparing of muscle mass loss after denervation of the right hindlimb muscle compared with the controls (Bodine et al., Reference Bodine, Latres, Baumhueter, Lai, Nunez, Clarke, Poueymirou, Panaro, Na, Dharmarajan, Pan, Valenzuela, DeChiara, Stitt, Yancopoulos and Glass2001). Consistent with these findings, it was suggested that atrogin-1 and MuRF1 are, at least in part, responsible for the muscle protein degradation observed under muscle atrophy conditions and thus represent highly reliable markers of skeletal muscle atrophy by the UPS (Latres et al., Reference Latres, Amini, Amini, Griffiths, Martin, Wei, Lin, Yancopoulos and Glass2005). Thus, it is likely that the observed increases in protein mass in growing pigs supplemented with carnitine (Owen et al., Reference Owen, Nelssen, Goodband, Tokach and Friesen2001a; Rincker et al., Reference Rincker, Carter, Real, Nelssen, Tokach, Goodband, Dritz, Senne, Fent, Pettey and Owen2003) might be, at least in part, due to an inhibition of protein degradation via the UPS in skeletal muscle, even though we observed no effect of carnitine supplementation on protein accretion in this experiment. One might speculate that the duration of our feeding trial was sufficient to induce changes in the gene expression level but too short to induce phenotypic changes. A further reason for the lack of effect on protein accretion might be that the food intake and daily body weight gain of the piglets were on a relatively low level under the experimental conditions applied. Inhibition of the UPS by carnitine in the liver is probably of less importance for the recent observations showing that carnitine increases protein accretion in growing pigs (Owen et al., Reference Owen, Nelssen, Goodband, Weeden and Blum1996 and Reference Owen, Nelssen, Goodband, Tokach and Friesen2001a; Rincker et al., Reference Rincker, Carter, Real, Nelssen, Tokach, Goodband, Dritz, Senne, Fent, Pettey and Owen2003) because the contribution of hepatic protein pool to the total body protein pool is comparatively small. In contrast to skeletal muscle, the main function of the UPS in the liver is to degrade cytosolic proteins that are either short-lived or folded abnormally (Hamel et al., Reference Hamel, Fawcett, Bennett and Duckworth2004), and not to provide other tissues with amino acids. This largely explains why, under, the above-mentioned pathological conditions, but also during fasting, in which the UPS is stimulated, protein loss occurs preferentially in skeletal muscle, whereas protein loss in visceral organs like the liver and kidney is kept to a minimum to facilitate biological functions essential for survival (Mitch and Goldberg, Reference Mitch and Goldberg1996).
To investigate whether the inhibitory effect of carnitine on the expression of genes of the UPS is mediated directly by carnitine, we treated muscle and liver cells with different carnitine concentrations, ranging from physiological (<100 μM) to pharmacological (>500 μM). We observed that incubating the cells with carnitine even at pharmacological concentrations had no effect on the basal expression of genes involved in the UPS pathway (e.g. atrogin-1, MuRF1, E214k, Psma1, Psmb1, ubiquitin). To further study whether carnitine might exert an effect on the expression of genes of the UPS under stimulated conditions, we treated muscle cells with different concentrations of carnitine in the presence of hydrocortisone, which is a known stimulator of the UPS (Price et al., Reference Price, Bailey and England1996; Combaret et al., Reference Combaret, Taillandier, Dardevet, Béchet, Rallière, Claustre, Grizard and Attaix2004; Nury et al., Reference Nury, Doucet and Coux2007). As expected, hydrocortisone treatment markedly upregulated genes of the UPS pathway. However, carnitine failed to exert an inhibitory effect on hydrocortisone-stimulated expression of genes of the UPS pathway. Thus, the findings from our cell culture experiments indicate that the inhibitory effect of carnitine on the expression of genes of the UPS observed in the animal experiment is not a direct one but likely mediated by modulating the release of inhibitors of the UPS pathway. Indeed, convincing evidence exists showing that carnitine supplementation influences the IGF axis as shown by increased plasma concentrations of IGF-1 and IGF-2 observed in pigs (Doberenz et al., Reference Doberenz, Birkenfeld, Kluge and Eder2006; Woodworth et al., Reference Woodworth, Tokach, Nelssen, Goodband, Dritz, Koo, Minton and Owen2007; Brown et al., Reference Brown, Goodband, Tokach, Dritz, Nelssen, Minton, Higgins, Lin, Odle, Woodworth and Johnson2008). Similar observations were found in broiler chicks, rats and humans (Di Marzio et al., Reference Di Marzio, Moretti, D'Alò, Zazzeroni, Marcellini, Smacchia, Alesse, Cifone and De Simone1999; Heo et al., Reference Heo, Kang and Cha2001; Kita et al., Reference Kita, Kato, Amanyaman, Okumura and Yokota2002). Recently, it was identified that the IGF-1 signalling pathway is one regulatory pathway associated with carnitine supplementation in skeletal muscle of piglets, indicating that carnitine activates the IGF-1 pathway (Keller et al., Reference Keller, Ringseis, Priebe, Guthke, Kluge and Eder2011). IGF-1 is well known to inhibit the UPS by blocking the transcriptional upregulation of the key mediators of this pathway, MuRF1 and atrogin-1 (Sacheck et al., Reference Sacheck, Ohtsuka, McLary and Goldberg2004; Sandri et al., Reference Sandri, Sandri, Gilbert, Skurk, Calabria, Picard, Walsh, Schiaffino, Lecker and Goldberg2004; Stitt et al., Reference Stitt, Drujan, Clarke, Panaro, Timofeyva, Kline, Gonzalez, Yancopoulos and Glass2004; Tong et al., Reference Tong, Yan, Zhu and Du2009), thereby reducing protein degradation and muscle wasting (Sacheck, Reference Sacheck2003). The beneficial effect of IGF-1 in preventing protein loss is also shown by the fact that overexpression of IGF-1 in muscle protects against age-related sarcopenia (Li et al., Reference Li, Li and Parkhouse2003). From these findings, we suggest that the marked inhibitory effect of carnitine on genes of the UPS in skeletal muscle and liver could be due to the known stimulatory effect of carnitine on IGF-1 secretion and signalling.
In conclusion, this study shows that dietary carnitine decreases the transcript levels of several genes involved in the UPS in skeletal muscle and liver of piglets, whereas carnitine has no effect on the transcript levels of these genes in cultivated HepG2 liver cells and C2C12 myotubes. These data suggest that the inhibitory effect of carnitine on the expression of genes of the UPS is mediated indirectly, probably via modulating the release of inhibitors of the UPS such as IGF-1. The inhibitory effect of carnitine on the expression of genes of the UPS might explain, at least partially, the increased protein accretion in piglets supplemented with carnitine.