INTRODUCTION
Fish scales have been used extensively to determine age, identify populations and estimate growth of various commercially and ecologically important species (Ibáñez-Aguirre & Lleonart, Reference Ibáñez-Aguirre and Lleonart1996). Agassiz (Reference Agassiz1834–1843) identified four types of fish scales, namely placoid, ganoid, ctenoid and cycloid (Roberts, Reference Roberts1993). The latter two types are characteristic in teleost species. The overall morphology of the scales, including the shape of the ctenii, is species-specific and has been used to identify various species such as those of the mullets (Ibáñez & Gallardo-Cabello, Reference Ibáñez and Gallardo-Cabello2005). The use of microscopy has revealed many new features of teleost scales. Roberts (Reference Roberts1993) demonstrated that scales, including their shape, contain significant phylogenetic information of great value in systematics.
Scale shape analyses are primarily based on landmark data and geometric morphometric methods (GMM). The advantage of GMM over landmark data methods is their use of equivalent biological structures, or ‘homologous’ landmarks, that result from biometric values. Recently, Ibáñez et al. (Reference Ibáñez, Cowx and O'Higgins2007) applied GMM to scales in order to identify genera, species and local populations of the family Mugilidae. Garduño-Paz et al. (Reference Garduño-Paz, Demetriou and Adams2010) also used fish-scale morphometrics and were able to discriminate between sympatric phenotypes of the Arctic charr (Salvelinus alpinus (Linnaeus, 1758)). Despite systematic improvements based on molecular research, there is still a rising demand for methods using fish scales, especially in the case of species not inventoried in several regions of the world, requiring morphological studies of scales in the evolutionary study of several groups (Roberts, Reference Roberts1993).
Grenadiers or rattail fish include species of the Bathygadidae, Macrouridae and Trachyrincidae (Nelson et al., Reference Nelson, Grande and Wilson2016). They inhabit deep marine habitats from the Arctic to the Antarctic. Macrourid fish form an abundant and widely distributed group in deep-sea habitats of the New Zealand continental slopes (McMillan & Paulin, Reference McMillan and Paulin1993). They commonly occur as by-catch of commercial fisheries in New Zealand's deep waters (Anonymous, 2004), yet little is known of their biology or feeding habits that would make it possible to eventually implement conservation measures (McMillan, Reference McMillan1980; Clark, Reference Clark1982, Reference Clark1985; Clark et al., Reference Clark, King and McMillan1989). Knowledge of many species is limited to a species’ original description and its presence in research trawls (Anderson et al., Reference Anderson, Bagley, Hurst, Francis, Clark and McMillan1998). Macrourids play an important ecological role, as they constitute one of the most important deep-water demersal fish due to their high number of species and biomass (Cohen et al., Reference Cohen, Inada, Iwamoto, Scialabba, Whitehead and Palmer1990).
This study is the first to record the differences in the shape of the scales of rattail fish, since there are no previous studies on scale morphometry for this group. Variations in scale shape are examined and their importance in the identification of genera and species is discussed.
MATERIALS AND METHODS
Fish scale collection
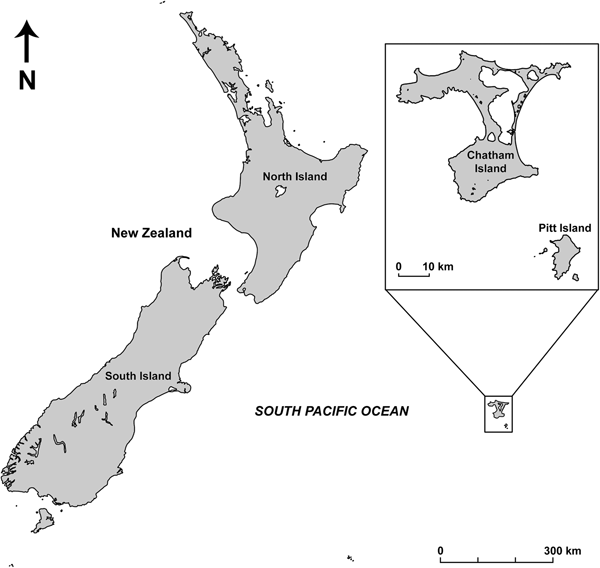
Rattail specimens were collected from waters around Chatham Island, New Zealand (Figure 1) as part of the Ocean Survey 20/20 Chatham/Challenger Biodiversity and Seabed Habitat Projects, jointly funded by the New Zealand Ministry of Fisheries, Land Information New Zealand, the National Institute of Water and Atmospheric Research and the Department of Conservation. Since the specimens were allocated for projects other than the scale morphology study, species identification was made prior to the process of scale extraction by Peter McMillan, National Institute of Water and Atmospheric Research (NIWA), Wellington, New Zealand. The identification matches that given recently by McMillan & Iwamoto (Reference McMillan, Iwamoto, Roberts, Stewart and Struthers2015). Scales of four genera of the Macrouridae family (Coelorhinchus, Coryphaenoides, Mesovagus and Macrourus) and of the genus Trachyrincus of the Trachyrincidae family (Nelson et al., Reference Nelson, Grande and Wilson2016) were extracted from the fish specimens in 2006 and analysed in this study.
Map of New Zealand and Chatham Island showing the study area where rattail fish were collected.

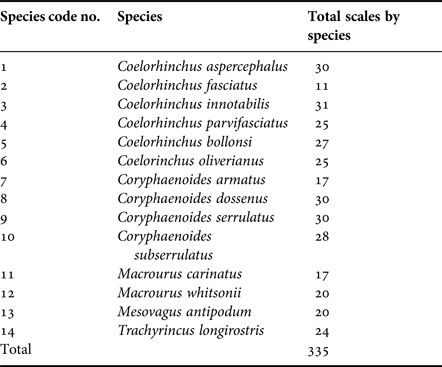
A total of 335 scales, one per fish, were analysed (Table 1). One scale was used to evaluate a fast discrimination method for species based on a single sample per individual. The scales were obtained from the area below the dorsal fin following the method of Iwamoto et al. (Reference Iwamoto, McMillan and Shcherbachev1999). A digital image of each scale was obtained using a Zeiss stereomicroscope (Stemi 2000-C) with an integrated 4.0 MP Canon digital camera. Regenerated or deformed scales were discarded because of possible shape alterations. Regenerated scales were identified by a diffused focus and an abnormal circuli pattern.
Collection of fish scales number by species.

Morphometrics
A preliminary visual assessment was carried out to identify potential landmarks on the scales. Seven landmarks per scale were determined with the TPSdig software (Rohlf, Reference Rohlf2006), following the protocol of Ibáñez et al. (Reference Ibáñez, Cowx and O'Higgins2007). The landmarks were located on key features of the ctenoid scale, common to all scales of the species under study. This ensured that, in the subsequent interpretation, variations in particular landmarks could be related to shared morphological features. The following landmarks were considered in this study (Figure 2): landmarks 1 and 3 were at the ventro- and dorsolateral tips of the anterior portion of the scale, landmark 2 was at the anterior-most tip of the scale, landmarks 4 and 6 were at the boundary between the anterior portion with circuli and the posterior area covered by cteni, landmark 5 was the focus of the scale and landmark 7 was at the tip of the posterior portion.
Location of landmark on scales of rattail fish used in the analysis.

The configurations of the landmark coordinates for the 335 samples were scaled, translated and rotated using a generalized Procrustes analysis (GPA). They were then subjected to a tangent projection (Dryden & Mardia, Reference Dryden and Mardia1993) and subsequently to a principal components analysis (PCA; Dryden & Mardia, Reference Dryden and Mardia1993; Kent, Reference Kent1994). For plotting purposes, the principal component (PC) scores were labelled per species to plot the distribution of the scales. Predicted extreme shapes were computed for each principal component. Differences in shape between the extremes of the PCs of interest were visualized using transformation grids (Bookstein, Reference Bookstein1989; Marcus et al., Reference Marcus, Corti, Loy, Naylor and Slice1996; Dryden & Mardia, Reference Dryden and Mardia1998) computed by Morphologika2 (O'Higgins & Jones, Reference O'Higgins and Jones2006). The scores of the specimens on all principal components were used in a canonical discriminant analysis to compute generalized Mahalanobis distances to derive discriminate functions and to assess the efficacy in their classification. A cross-validated discriminant analysis was applied to assess and compare the efficacy of the shape and the relative warp in size-shape (centroid size plus shape variables). The percentages of the correct classifications were recorded per genus and species. The centroid size was taken as a measure of the overall size of the scale, calculated as the square root of the sum of squared distances between each landmark and the centroid of the landmark configuration. The scores of the PC from the analyses of the shapes were regressed (with multivariate analyses) on the centroid size in order to determine the extent to which fish scale size and shape variation were related to size variation in each species.
Phenetic relationships were established by a cluster analysis of the consensus or the mean landmark configurations of each species. The cluster analysis was based on the between group-linkage method to show the phenotypic relationships among the scale characteristics of the studied species. A strict consensus tree was computed based on these methods.
RESULTS
The first canonical discriminant function for the 335 scales classified by genus explained 47.8% of the total among-location variance, while the second accounted for 28.5% (Wilks’ lambda = 0.046, P < 0.0001). The cross-validated discriminant analysis using shape variables (PC scores) correctly classified between 59 and 95.8% by genus (Table 2). The lowest correct classification rate of 59% was obtained for the species of the genus Coryphaenoides, while the highest correct classification rate of 95.8% was recorded for Trachyrincus. The cross-validated discriminant analysis correctly classified 74% by genus. Specimens of Coelorhinchus and Coryphaenoides showed a notable overlap of individuals, of 28.6 and 21.5% respectively (Table 2).
Classification resultsa for the discriminant analysis with the cross-validation testing procedure (cross-validated) for the five genera.

a 74.0% of cross-validated grouped cases correctly classified.
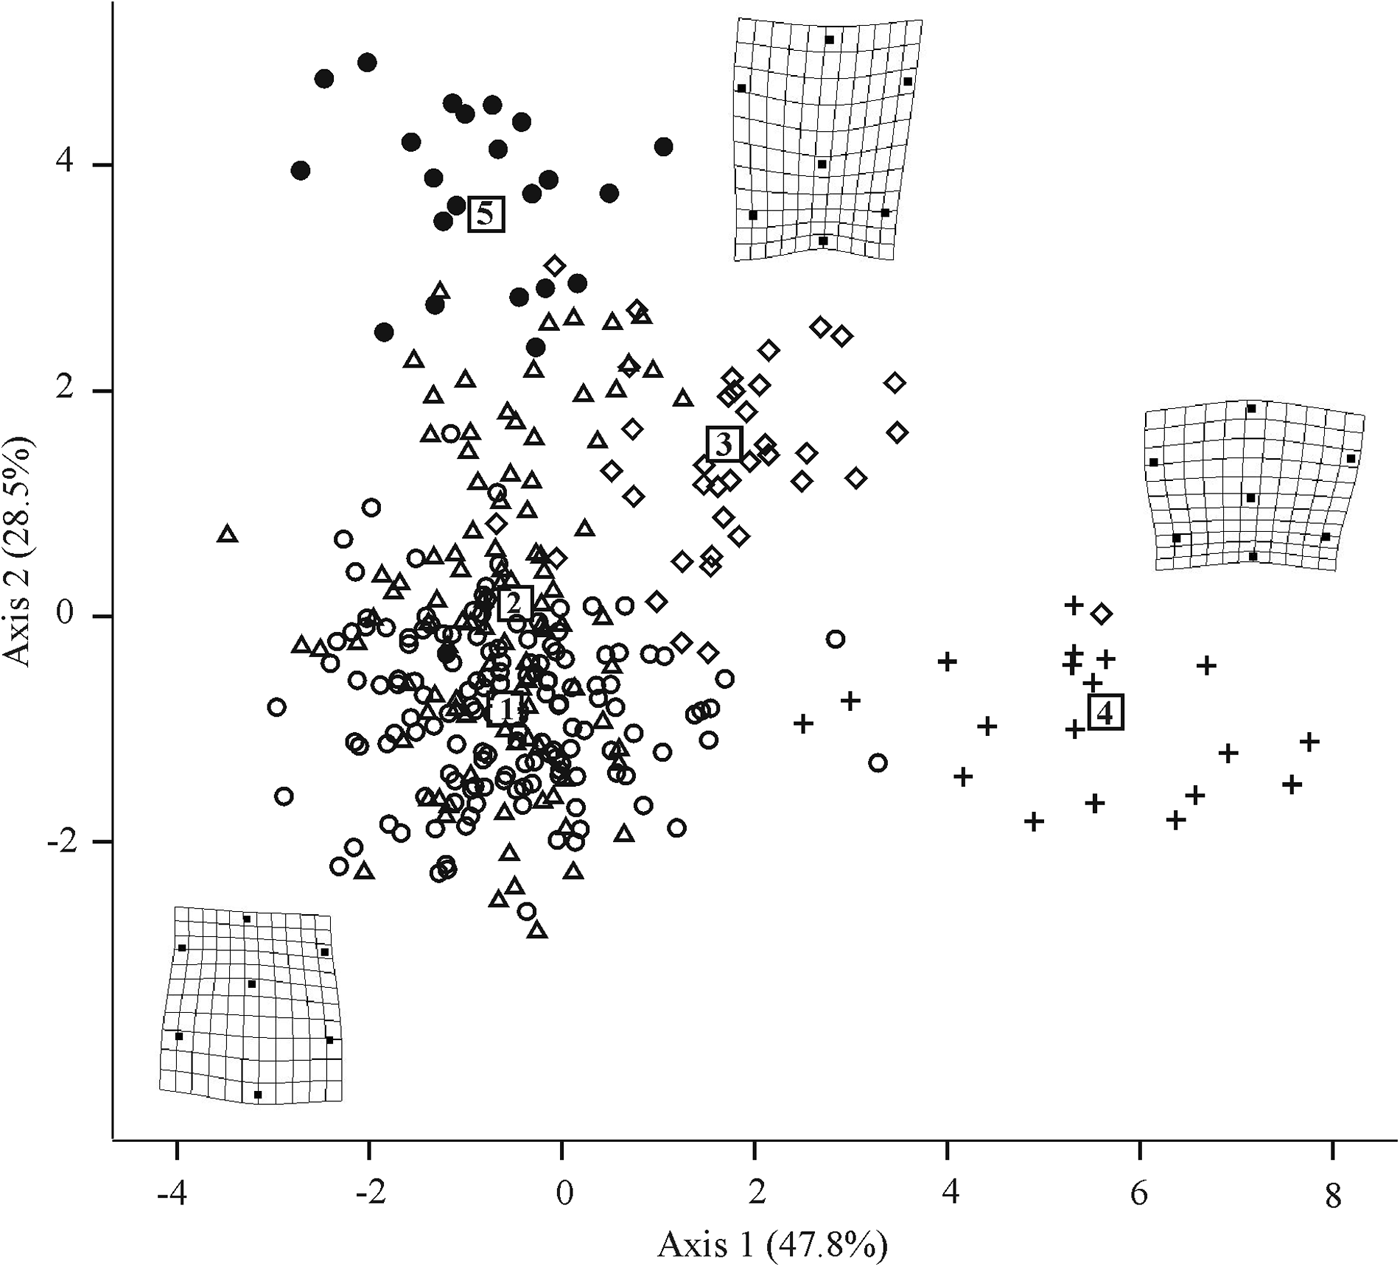
The centroids and specimens of the genera were separated mainly at the first discriminant function, with those of Mesovagus on the right and those of the other genera on the left of the classification tree. Individuals of Coelorhinchus and Coryphaenoides presented a considerable overlap of specimens. The genera Macrourus and Trachyrincus were separated mainly at the second discriminant function, which indicated a clear discrimination (Figure 3).
Scatter plot of the discriminant function scores from the analysis of genus. (1) Circles = Coelorhinchus; (2) Triangles = Coryphaenoides; (3) Diamond = Macrourus; (4) Cross = Mesovagus; (5) Black circle = Trachyrincus; Rectangle = Group centroids. Values over the white squares are the number of centroids. The grids are shape variation by genus visualized using transformation grids.

Figure 3 presents the specimens labelled by genus, and the general pattern of morphological differences described by these first two discriminant axes is explored using transformation grids. The up grid represents the mean shape warped for Macrourus and Trachyrincus. These scales are characterized by a relatively large distance between the focus and landmark 2 and by a concave anterior edge, whereas this distance was relatively shorter in the case of the Mesovagus scales (right grid), with the focus more central and the anterior edge convex. Mesovagus scales are relatively wide and short.
Major differences in scale shape were recorded for Macrourus, Mesovagus and Trachyrincus on the one hand, and for the other two genera Coelorhinchus and Coryphaenoides (down grid) on the other hand. These scales are characterized by a plane anterior edge and a relatively short distance between the focus and landmark 2. Landmarks 5 and 7 tended to be positioned further posteriorly to landmark 2 (Figure 3).
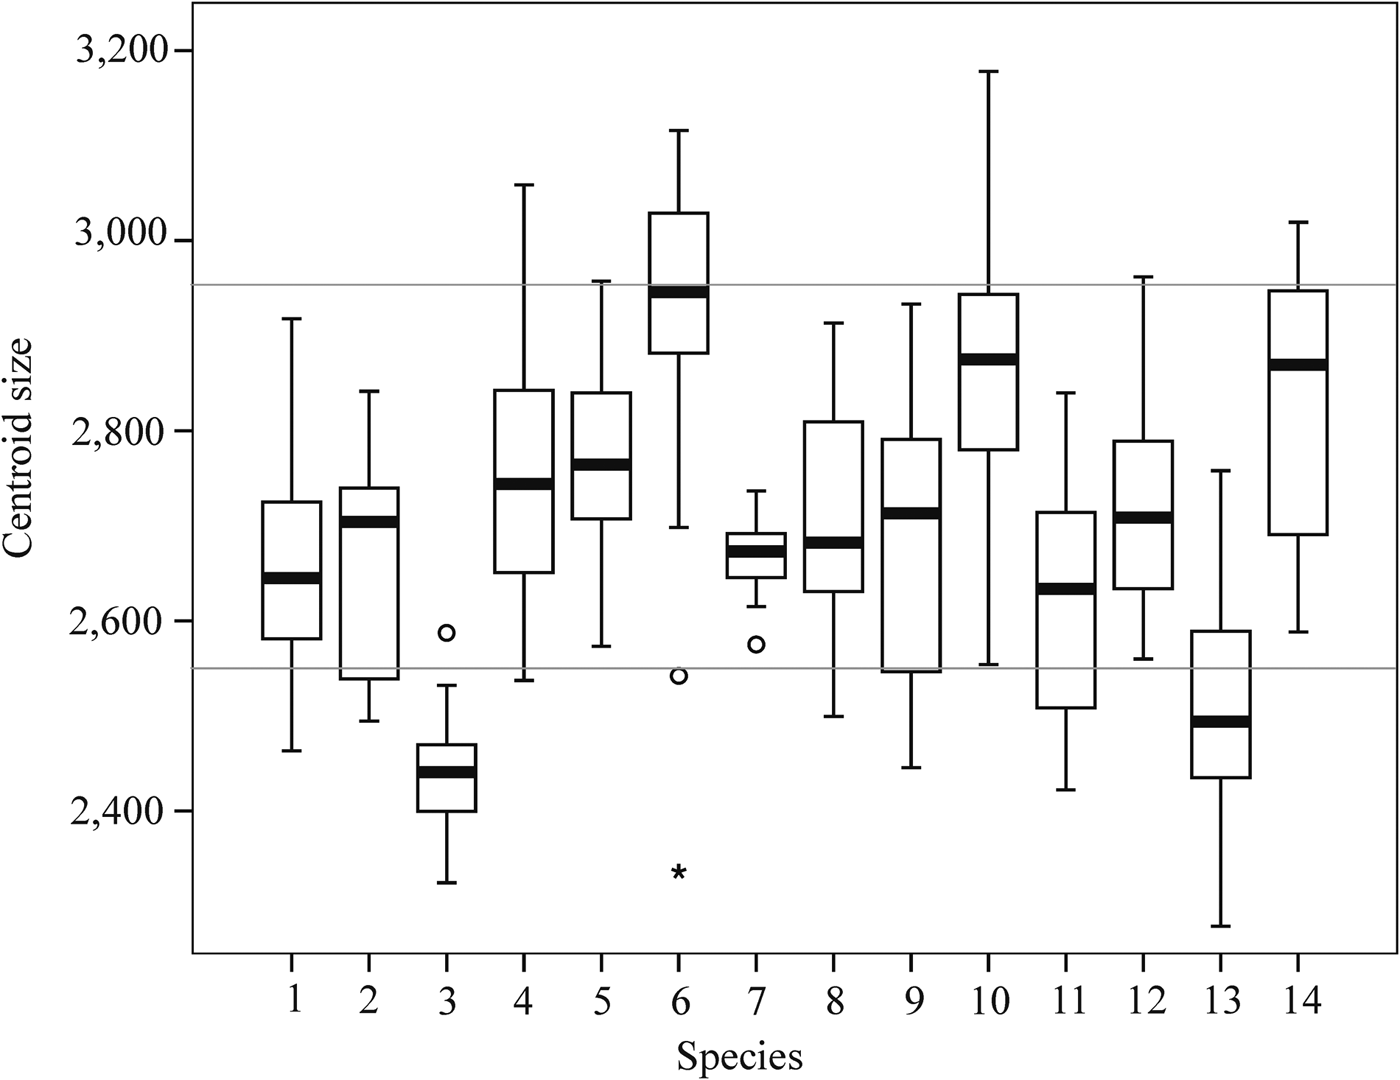
The size was established from the centroid size as a mathematically independent measure of shape. Empirically, the centroid size may be correlated with the shape because larger organisms are frequently shaped differently from smaller ones (Zelditch et al., Reference Zelditch, Swiderski, Sheets and Fink2004). With respect to the overall size of the fish scales, most centroid sizes fell in the middle range shown in Figure 4. When the size overlapped between species, the shape differences between these groups were not allometric. Exceptions were the specimens that belonged to the moderately large species Coelorinchus oliverianus and to the somewhat larger species Coryphaenoides subserrulatus, both of which fall in the upper size range. The two smallest species Coelorhinchus innotabilis and Mesovagus antipodum fall in the lower half of the range. A multivariate regression of the PCs on centroids size was significant, with an R 2 of 21.03% (Wilks’ lambda = 0.002, P < 0.001).
Variation of the centroid size among species. Key numbers by species as in Table 1. Asterisk represents an extreme value.

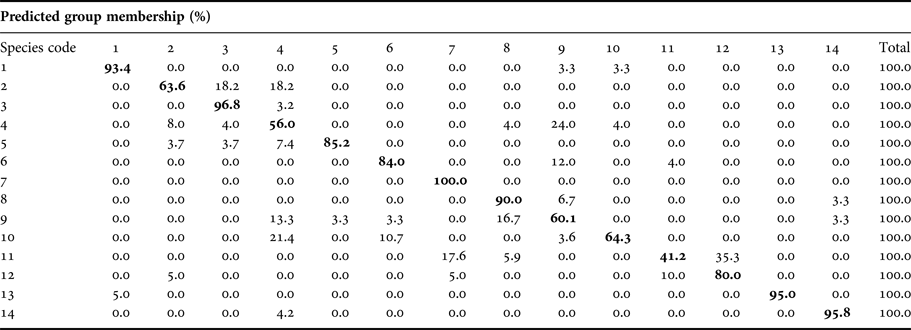
The cross-validated discriminant analysis using shape variables (PC scores) correctly classified from 41.2 to 100% by species (Table 3). The lowest correct classification rate of 41.2% was obtained for Macrourus carinatus, while the highest correct classification rate of 100% was recorded for Coryphaenoides armatus, followed by Trachyrincus longirostris (95.8%) and Coelorhinchus innotabilis (96.8%). The remainder of the species’ classifications varied from 56 to 90%. The cross-validated discriminant analysis correctly classified 80% of the species.

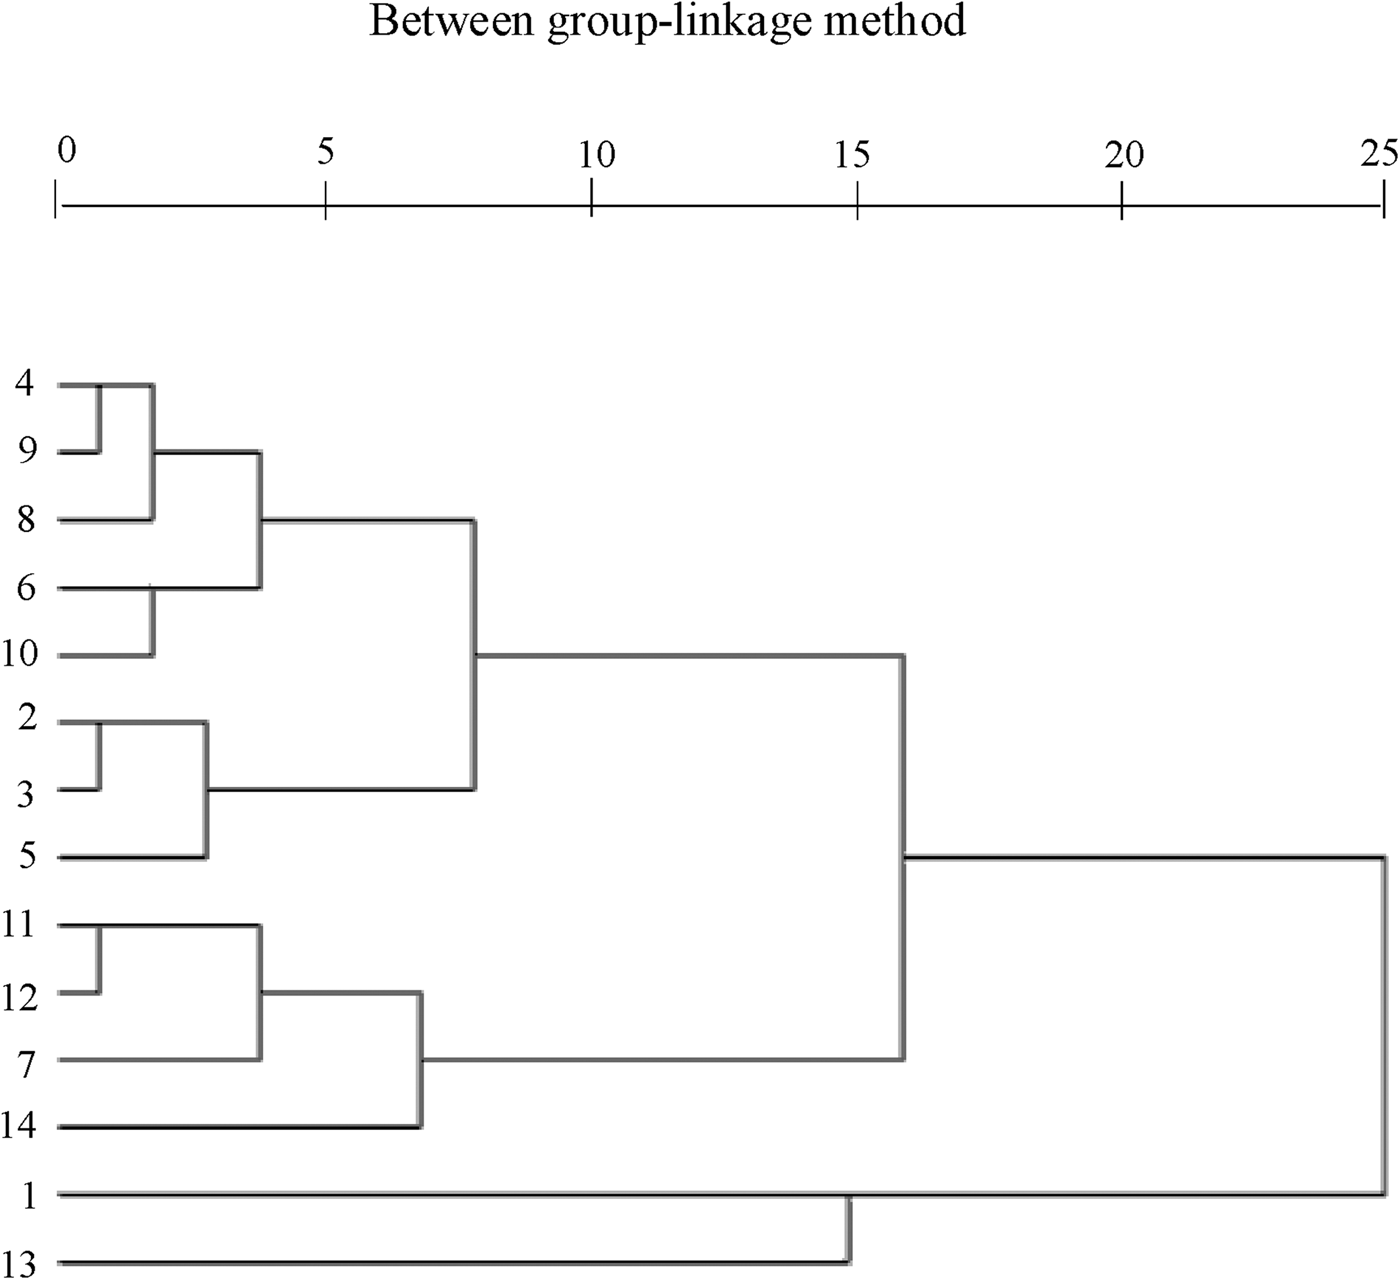
The consensus phenogram of rattail mean shapes (Figure 5) presents distinctions among the three clusters. Coelorhinchus parvifasciatus, Coryphaenoides serrulatus, Coryphaenoides dossenus, Coelorinchus oliverianus, Coryphaenoides subserrulatus, Coelorhinchus fasciatus, Coelorhinchus innotabilis and Coelorhinchus bollonsi form the first group with similar scale shapes. Macrourus carinatus, Macrourus whitsonii, Coryphaenoides armatus and Trachyrincus longirostris form the second group, and the remainder of the species, Coelorhinchus aspercephalus and Mesovagus antipodum, form the third group.
Cluster analysis performed on the matrix of Procrustes distances using Ward's method for rattail fish species. Key numbers by species as in Table 1.

DISCUSSION
The analysis carried out in this study provided sufficient evidence to conclude that scale morphology is a promising tool for discrimination between the genera of this study's target fish. The genera Trachyrincus and Mesovagus were better separated than Coelorhinchus and Coryphaenoides, as the intergeneric variability is greater than the interspecific variability.
Most of the species were correctly identified considering the shape of the scales. The best discrimination (over 80%) was obtained for nine species, three species recorded 60–70% and only two species, Coelorhinchus parvifasciatus and Macrourus carinatus, had a discrimination rate of 56 and 41.2% respectively. In our study, the fish scales shape showed elevated resemblance and consequently did not show 100% success of classification. However, it was possible to discriminate between them in a large proportion of cases (80%). The percentage of discrimination might be further improved by increasing the number of landmarks, since only seven landmarks were used. Thus, discrete differences between species could be revealed. All scales were sampled from the same body area in order to reduce the variation observed in scales from different regions of the fish bodies (Ibáñez et al., Reference Ibáñez, Cowx and O'Higgins2009). However, ignoring anatomical sampling region fish scales shape still achieves good classification by species. Ibáñez & O'Higgins (Reference Ibáñez and O'Higgins2011) showed that when using scales from the central regions of the fish the identification between species is optimal; nevertheless, they showed that using landmark data from isolated scales is also effective in identification of fish species. Thus, disregarding the body sampling region still allows good discrimination by species. Morphometrics is very important in biology because it allows quantitative descriptions of organisms. A quantitative approach allows better comparison of shapes of different organisms and removes any reliance on word descriptions, which may be interpreted differently by each researcher.
The biggest disadvantage of landmark-based geometric morphometrics methods is that a sufficient number of landmarks may not be enough to capture the shape of an object. Landmarks do not contain information on the spaces, curves, or surfaces between them. If data concerning regions between landmarks are not part of the data collected, then we cannot expect to obtain verifiable information regarding the aspects of form or form change occurring between landmarks (Richtsmeier et al., Reference Richtsmeier, Deleon and Lele2002). Important shape differences may also be located in the regions between landmarks (Adams et al., Reference Adams, Rohlf and Slice2004). As described above, outlines of structures can be captured and analysed using shape variables such as those generated by an elliptic Fourier analysis (e.g. with fish scales: Jarvis et al., Reference Jarvis, Klodowski and Sheldon1978; Richards & Esteves, Reference Richards and Esteves1997; Poulet et al., Reference Poulet, Reyjol, Collier and Lek2005), but this goes to the other extreme by ignoring differences in the relative positions of landmark points. An alternative is to use an outline analysis method.
Differences in scale shape among species may be related to scale function. The hydrodynamic function of fish scales is largely unknown and untested to date, but constitutes an interesting and attractive direction for future comparative morphological work.
The scale centroid size was used to reduce the variance from allometry. It is generally agreed that working with size may provide a better species discrimination (Ibáñez & O'Higgins, Reference Ibáñez and O'Higgins2011; Ibáñez, Reference Ibáñez2015). In this study, less than 22% of the shape variance was due to the size by regression. Identification rates were much better than by chance, when considering the shape only (and not the size). Classifications were somewhat improved when taking the size into account. Thus, the size should be taken into account in studies such as this one in order to obtain a better discrimination.
The present study focuses on phenetics, given that the objective was not to establish phylogeny but to examine variations in scale shape for taxon identification. Nevertheless, it is worthwhile to investigate to what extent scale shape morphometric variations relate to variations in phylogeny.
Notwithstanding that there are several studies on the phylogenetic relationships of the Gadiformes (Wilson et al., Reference Wilson, Siebenaller and Bonnie1991; Endo, Reference Endo2002; Wilson & Attia, Reference Wilson and Attia2003; Smith et al., Reference Smith, Steinke, McMillan, Stewart, McVeagh, Diaz de Astarloa, Welsford and Ward2011; Nakayama & Endo, Reference Nakayama and Endo2017), no studies exist for the taxa studied here. Based on scale shape, Nelson et al. (Reference Nelson, Grande and Wilson2016) assigned the genus Trachyrincus to the Trachyrincidae family, and not to the Macrouridae family. Larger differences in scale shape are recorded as the distance increases between taxonomic groups.
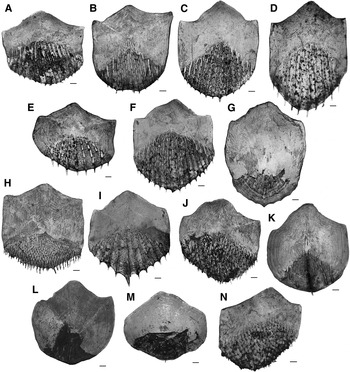
Fish scale morphometrics may be very useful in family, genus, species and also population identifications, due to the high variability in scale shape present among such groups (Ibáñez, Reference Ibáñez2015). Scale morphology has been used to identify North American inland fish (Daniels, Reference Daniels1996) and to develop identification keys for freshwater fish of diverse regions including California (Casteel, Reference Casteel1972), Great Britain and Ireland (Maitland, Reference Maitland2004). Moreover, it has been used to identify species and populations (Chervinski, Reference Chervinski1984; Ibáñez & O'Higgins, Reference Ibáñez and O'Higgins2011), since scale shape is species-specific and, thus, useful in identification (Ibáñez et al., Reference Ibáñez, Cowx and O'Higgins2007; Garduño-Paz et al., Reference Garduño-Paz, Demetriou and Adams2010). According to the dendrogram presented in this study, the species in each cluster show some similarities in the shape of their scales. The dendrogram in Figure 5 includes two main clusters, and two clusters branching out from each. Cluster no. 1 included eight species and cluster no. 2 included six. In the first cluster, Coelorhinchus parvifasciatus and Coryphaenoides serrulatus are together. Looking at the shape of their scales (Figure 6), the two species present a similar position of the ctenii area, a regular hexagonal scale shape, and the anterior tip of the scale is located at the same distance from the anterior corners. Coryphaenoides dossenus is the sister species to the cluster of C. parvifasciatus and C. serrulatus. The scales of C. dossenus, compared with the latter two species, have a similar location of ctenii and a regular hexagonal shape.
Scales of A, Coelorhinchus aspercephalus; B, Coelorhinchus bollonsi; C, Coelorhinchus fasciatus; D, Coelorhinchus innotabilis; E, Coelorhinchus oliverianus; F, Coelorhinchus parvifasciatus; G, Coryphaenoides armatus; H, Coryphaenoides dossenus; I, Coryphaenoides serrulatus; J, Coryphaenoides subserrulatus; K, Macrourus carinatus; L, Macrourus whitsonii; M, Mesovagus antipodum; N, Trachyrincus longirostris.

Coelorinchus oliverianus and Coryphaenoides subserrulatus form another cluster, together with the large first cluster. The scales of these two species share the following characters: short and wide, and a curved anterior edge.
Coelorhinchus fasciatus and Coelorhinchus innotabilis form a cluster, with Coelorhinchus bollonsii as a sister species to both. The shape of the scales of C. fasciatus and C. innotabilis is similar in that the anterior corners of the scales have a shallow notch making them conspicuous, and the anterior tip of the scale is sub-pointed. The scale morphology of C. bollonsii is similar to that of C. fasciatus and C. innotabilis in having a shallow notch near the anterior corners of the scales.
Macrourus carinatus, M. whitsonii, Coryphaenoides armatus and Trachyrincus longirostris form a sub-clade within the second clade. The two species of the genus Macrourus share the following characters: the anterior end of the scale is broad and rounded, the lateral sides of the scales are slightly curved and the ctenii area is at the posterior 1/3 of the scale's surface. The scales of C. armatus are similar to those of Macrourus in having a broad and rounded anterior end and slightly curved lateral sides. The scale morphology of T. longirostris is similar to that of M. carinatus, M. whitsonii and C. armatus in having a broad and rounded anterior end. Finally, Coelorhinchus aspercephalus and Mesovagus antipodum have similar short and broad scales, with a rounded posterior end.
Our results show that it is possible to identify genera in 74% of the cases. Most misclassifications occurred between Coelorhinchus and Coryphaenoides, and the highest correct genera classification was that between Mesovagus and Trachyrincus. The correct classification of species ranged from 41.2 to 100%. The highest correct classifications were those between Coryphaenoides armatus, Coelorhinchus innotabilis, Trachyrincus longirostris and Mesovagus antipodum. The approach used in this study shows promise for future research focused on discriminating between closely related species that are otherwise difficult to identify. In addition, the method used here is non-destructive, allowing its use on rare and endangered species. It is also cost-effective and fast, compared with methods based on genetic analyses, and it can be used in studies based on large numbers of individuals.
ACKNOWLEDGEMENTS
Our sincere thanks are due to the National Institute of Water and Atmospheric Research, Wellington for giving permission to use the specimens of the rattail fishes, to Kristiaan Hoedemakers, the Royal Belgian Institute of Natural Sciences (RBINS), Belgium and to Eddie Espinosa from the Universidad Autónoma Metropolitana-Iztapalapa for the scale photography.
FINANCIAL SUPPORT
The research presented in this manuscript was funded by the Universidad Autónoma Metropolitana.